Capnography Equipment Market by Product (Multiparameter, Standalone, Software, Accessories), Technology (Mainstream, Sidestream, Microstream), Application (Cardiac Care, Respiratory Monitoring), End User (Hospitals, ASC), Region - Global Forecast to 2030

icon1
USD 0.67 BN
MARKET SIZE, 2030
icon2
CAGR 4.6%
(2025-2030)
icon3
320
REPORT PAGES
icon4
421
MARKET TABLES

OVERVIEW

Source: Secondary Research, Interviews with Experts, MarketsandMarkets Analysis

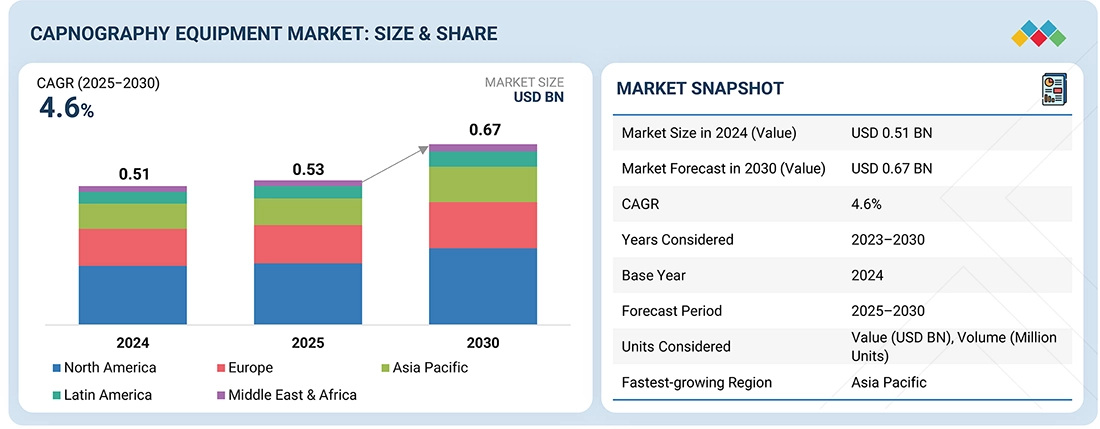
The global capnography equipment market is projected to reach USD 0.67 billion by 2030 from USD 0.53 billion in 2025, at a CAGR of 4.6% during the forecast period. The capnography equipment market is expanding due to the increasing prevalence of respiratory and cardiovascular disorders, a rise in surgical procedures, and a greater focus on patient safety through continuous monitoring. Additionally, technological advancements in sensors and portable systems, as well as the growing use of noninvasive monitoring in critical care and emergency settings, contribute to this market growth.

KEY TAKEAWAYS

  • BY PRODUCT
    The capnography equipment market is mainly divided into three categories: capnometers (which include both standalone and handheld devices), accessories, and software. Handheld capnometers are becoming increasingly popular because they are portable and easy to use in various clinical settings. Additionally, accessories such as sensors and sampling lines are crucial for the proper functioning of capnography systems, contributing to the growing demand for these items alongside the primary devices.
  • BY TECHNOLOGY
    Capnography devices utilize various technologies, including mainstream, sidestream, and microstream. Among these, sidestream capnography currently has the largest market share due to its versatility and reliability across different clinical settings. Microstream capnography is becoming more popular because of its compact size and suitability for portable applications. Meanwhile, mainstream capnography is typically used in hospital environments for real-time monitoring.
  • BY APPLICATION
    Capnography equipment is used in various applications, including trauma and emergency care, cardiac care, and respiratory monitoring. Currently, trauma and emergency care applications dominate the market due to the necessity for rapid and accurate assessments of patients in critical conditions. Additionally, respiratory monitoring applications are important, particularly given the rising prevalence of respiratory diseases.
  • BY END USER
    The main end users of capnography equipment are hospitals & clinics, followed by ambulatory surgery centers (ASCs) and home healthcare settings. Hospitals & clinics are the leading users due to the large number of patients needing continuous monitoring. However, the increasing trend toward home healthcare is driving the adoption of portable capnography devices, especially for patients with chronic respiratory conditions.
  • BY REGION
    The Asia Pacific region is anticipated to experience the highest CAGR in the capnography equipment market. This growth is driven by several factors, including the rising incidence of respiratory disorders, an increase in surgical procedures, and the enhancement of healthcare infrastructure in developing countries. Additionally, growing awareness about patient safety, a broader adoption of advanced monitoring technologies, and investments by global market players to strengthen their presence in the region are further contributing to rapid market growth.
  • COMPETITIVE LANDSCAPE
    The major market players have employed both organic and inorganic strategies, including partnerships and collaborations. For example, Philips and Masimo announced an innovation partnership to advance access to patient monitoring measurement technologies.

The growth of the capnography equipment market is primarily driven by the increasing prevalence of respiratory and cardiovascular disorders, such as chronic obstructive pulmonary disease (COPD), asthma, sleep apnea, and heart diseases, all of which require continuous patient monitoring. The rising number of surgical procedures and the widespread use of anesthesia and sedation also contribute to the demand for accurate CO2 monitoring. Technological advancements, including portable and non-invasive capnography systems, improved sensors, and integration with multiparameter patient monitoring platforms, enhance both clinical efficiency and reliability. Furthermore, the growing awareness of patient safety, stringent regulatory guidelines, and the adoption of capnography in emergency and critical care settings collectively serve as significant factors driving market growth.

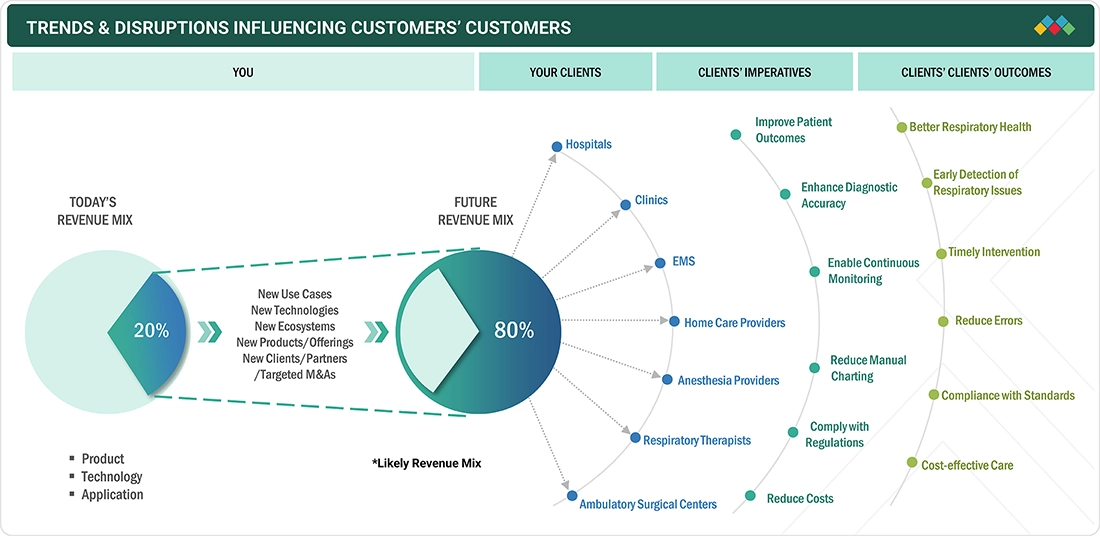
TRENDS & DISRUPTIONS IMPACTING CUSTOMERS' CUSTOMERS

The capnography equipment market is experiencing several key trends and disruptions that are transforming customer businesses and clinical practices. One significant trend is the increasing integration of capnography with multiparameter monitoring systems and electronic health records. This integration allows for real-time data analysis and enhances clinical decision-making. Another important trend is the rise in demand for portable and wireless capnography devices, which support point-of-care and home-based monitoring solutions. Advances in sensor accuracy, miniaturization, and noninvasive technology are also improving device efficiency and patient comfort. Additionally, the growing emphasis on value-based healthcare and patient safety standards is encouraging hospitals and clinics to adopt capnography more widely, particularly in surgical, emergency, and intensive care settings. Emerging disruptors such as digital connectivity, AI-driven analytics, and interoperability between devices are revolutionizing how healthcare providers monitor, interpret, and respond to patient respiratory data.

Source: Secondary Research, Interviews with Experts, MarketsandMarkets Analysis

MARKET DYNAMICS

Drivers
Impact
Level
  • Increasing prevalence of respiratory diseases
  • Clinical benefits of capnography over pulse oximetry
RESTRAINTS
Impact
Level
  • Complex regulatory framework for approval of capnography equipment
  • High equipment and maintenance costs
OPPORTUNITIES
Impact
Level
  • Increased availability of clinical research evidence
  • Growth opportunities for healthcare industry in emerging economies
CHALLENGES
Impact
Level
  • Lack of skilled technicians & specialized training to operate capnometers

Source: Secondary Research, Interviews with Experts, MarketsandMarkets Analysis

Driver: Increasing prevalence of respiratory diseases

The rising prevalence of respiratory diseases, such as chronic obstructive pulmonary disease (COPD), asthma, sleep apnea, and acute respiratory distress syndrome (ARDS), is a significant factor driving the capnography equipment market. These conditions often necessitate continuous monitoring of ventilation and gas exchange, making capnography an essential diagnostic and monitoring tool in both hospital and emergency settings. Increasing pollution levels, an aging population, and lifestyle changes are contributing to the growing burden of respiratory disorders worldwide. As a result, healthcare providers are adopting capnography systems more frequently to ensure early detection and effective management of respiratory issues. This trend is further supported by increased clinical awareness and the integration of advanced capnography technologies into critical care and surgical procedures.

Restraint: Complex regulatory framework for approval of capnography equipment

One of the major challenges in the capnography equipment market is the complex regulatory framework governing product approval and commercialization. Capnography devices, essential for patient monitoring, must meet strict safety, efficacy, and quality standards set by regulatory bodies such as the US FDA, the European Medicines Agency (EMA), and other regional authorities. The approval process often requires extensive clinical testing, detailed documentation, and ongoing post-market surveillance, all of which can be time-consuming and costly for manufacturers. Additionally, differences in regulatory requirements across countries complicate market entry and delay product launches. This complexity not only drives up development costs but also makes it difficult for smaller companies to compete effectively, ultimately slowing innovation and hindering overall market growth.

Opportunity: Increased availability of clinical research evidence

An important opportunity in the capnography equipment market lies in the growing availability of clinical research evidence supporting the effectiveness of capnography in improving patient outcomes. Numerous studies have demonstrated its value in early detection of respiratory depression, enhanced anesthesia safety, and reduced incidences of postoperative complications. This expanding body of evidence is driving wider clinical acceptance and reinforcing its inclusion in patient monitoring standards across hospitals and ambulatory care settings. As research continues to validate the benefits of capnography across new applications such as procedural sedation, emergency care, and noninvasive monitoring, healthcare providers are increasingly recognizing its importance, creating significant growth opportunities for manufacturers to expand adoption globally.

Challenge: Lack of skilled technicians & specialized training to operate capnometers

A significant challenge in the capnography equipment market is the lack of skilled technicians and specialized training required to operate capnometers effectively. Proper use and interpretation of capnography data are essential for accurate patient monitoring, particularly in critical care, anesthesia, and emergency settings. However, in many healthcare facilities, especially in developing regions, there is a shortage of adequately trained staff who can handle the equipment, calibrate sensors, and interpret CO2 waveforms correctly. This skill gap often leads to underutilization or misuse of capnography devices, reducing their clinical effectiveness. Limited training programs, inadequate awareness of capnography’s diagnostic value, and the need for continuous skill development further exacerbate this challenge, hindering optimal adoption and performance of these devices in healthcare practice.

Capnography Equipment Market: COMMERCIAL USE CASES ACROSS INDUSTRIES

COMPANY USE CASE DESCRIPTION BENEFITS
Continuous patient monitors are advanced monitoring systems designed to provide real-time measurement of multiple vital signs, including CO2 levels, heart rate, SpO2, blood pressure, and respiratory rate across critical, surgical, and general care settings. Enable continuous assessment of patient status, support early detection of respiratory or cardiac distress, and improve patient safety and clinical decision-making.
Capnography systems are specialized devices that measure and display the concentration or partial pressure of exhaled CO2 to assess ventilation and airway integrity during anesthesia, sedation, and critical care. Ensure accurate monitoring of respiratory function, enable early detection of hypoventilation or airway obstruction, and enhance patient safety during surgical and emergency procedures.
Airway adapters are disposable or reusable connectors that link the patient’s breathing circuit to the capnography sensor for CO2 measurement during ventilation. Provide a secure and accurate interface for gas sampling, minimize leakage, and ensure reliable CO2 readings for both intubated and non-intubated patients.
Capnography sensors are a core component of capnography systems, which detect and analyze CO2 levels from exhaled breath using infrared spectroscopy or similar technologies. Deliver precise, real-time CO2 readings, improve diagnostic accuracy, and enhance the effectiveness of patient monitoring in both mainstream and sidestream configurations.
Integrated software processes and visualizes CO2 waveform data, enabling clinicians to monitor trends, set alerts, and analyze ventilation performance remotely or locally. Enhance clinical workflow efficiency, enable data-driven decisions through trend analysis, and support interoperability with hospital information systems for better patient management.

Logos and trademarks shown above are the property of their respective owners. Their use here is for informational and illustrative purposes only.

MARKET ECOSYSTEM

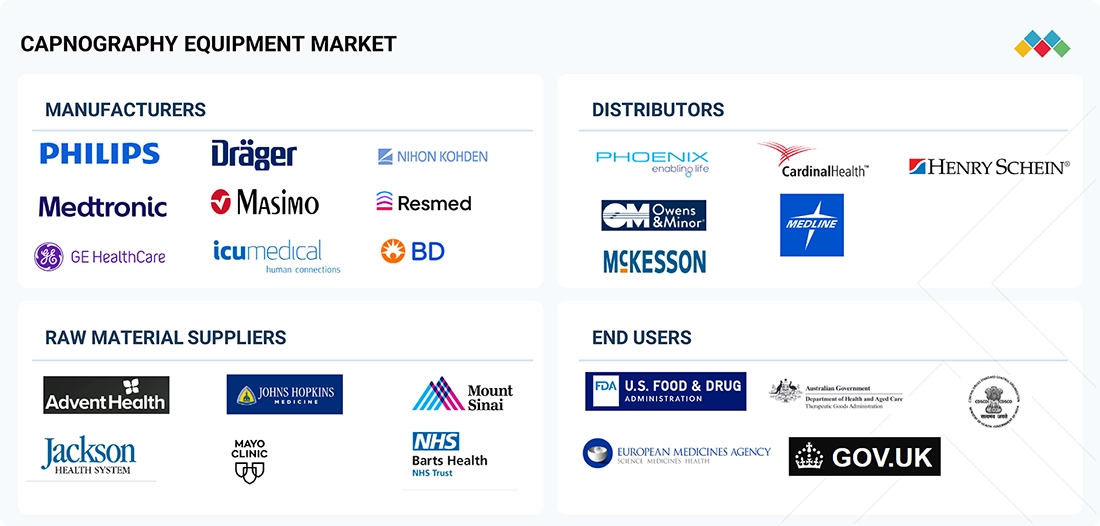
The capnography equipment market operates within a complex ecosystem that includes device manufacturers, healthcare providers, regulatory bodies, and suppliers of consumables and accessories. Key manufacturers, such as Medtronic, Philips, Dräger, Nihon Kohden, and Masimo, develop capnography devices, including handheld monitors, multiparameter monitors, and capnometers. These devices are essential for monitoring carbon dioxide levels in patients' respiratory gases. Supporting components, such as disposable sampling lines, filters, connectors, and calibration gases, ensure accurate measurements and maintain hygiene. The demand for capnography equipment is driven by healthcare providers in hospitals, ambulatory surgical centers, and home care settings, influenced by clinical needs, technological advancements, and reimbursement policies. Regulatory standards also guide the safety and performance of these devices. Geographically, North America leads the market due to its advanced healthcare infrastructure, while the Asia Pacific region is experiencing rapid growth due to increased healthcare access and rising awareness of respiratory health. This ecosystem aims to improve patient monitoring and clinical outcomes.

Logos and trademarks shown above are the property of their respective owners. Their use here is for informational and illustrative purposes only.

MARKET SEGMENTS

Source: Secondary Research, Interviews with Experts, MarketsandMarkets Analysis

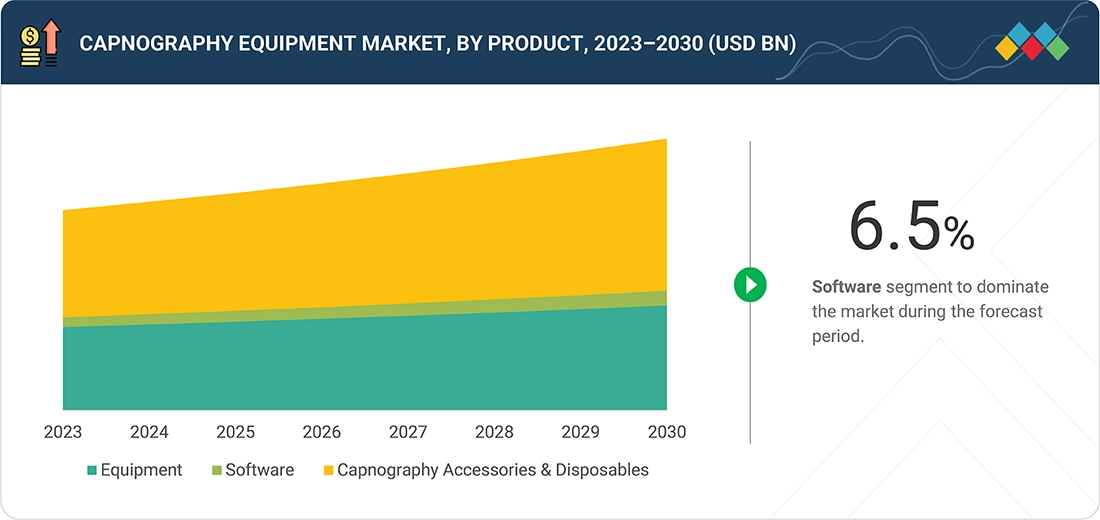
Capnography Equipment Market, By Product

In the capnography equipment market, the capnography accessories & disposables product segment holds a dominant position. This segment includes essential components such as nasal/oral CO2 cannulas, airway adapters, sampling lines, filters, connectors, and calibration gases, which are critical for the accurate functioning of capnography devices. The high demand for these consumables is driven by their single-use nature, which ensures hygiene and prevents cross-contamination in clinical settings. Additionally, frequent replacement cycles in hospitals, intensive care units, and surgical centers contribute to sustained market growth. The rising number of surgical procedures, growing awareness of respiratory monitoring, and stringent infection control protocols further reinforce the dominance of this segment, making accessories and disposables a key revenue generator in the capnography equipment ecosystem.

Capnography Equipment Market, By Technology

In the capnography equipment market, mainstream capnography devices dominate the technology segment, holding the largest market share due to their established reliability, ease of use, and broad clinical adoption. These devices measure carbon dioxide directly at the airway, providing real-time, accurate monitoring of patients’ respiratory status, which is crucial during anesthesia, intensive care, and emergency procedures. Their widespread use can be attributed to healthcare professionals' familiarity with them, a lower risk of sampling errors compared to sidestream devices, and compatibility with existing monitoring systems. While newer technologies like sidestream and microstream capnography are emerging, mainstream systems remain the preferred choice in hospitals and surgical centers worldwide. This preference significantly contributes to the overall growth and stability of the capnography equipment market.

Capnography Equipment Market, By Application

In the capnography equipment market, the cardiac care application segment stands out as the leader. Continuous monitoring of respiratory gases is crucial for patients with cardiovascular conditions. Capnography provides real-time measurements of carbon dioxide levels, which allows for early detection of respiratory issues, cardiac arrest, and complications during cardiac surgeries or interventions. Its use in cardiac care units, operating rooms, and emergency settings enables clinicians to make timely decisions, optimize ventilation, and improve patient outcomes. The high prevalence of cardiovascular diseases, along with the emphasis on patient safety during complex cardiac procedures, drives the demand for capnography devices in this segment, establishing cardiac care as a dominant area in the market.

Capnography Equipment Market, By End User

In the capnography equipment market, hospitals are the primary end users due to their high patient volumes, complex clinical procedures, and critical care needs. Tertiary care centers and specialized surgical facilities depend heavily on capnography devices to monitor patients during anesthesia, in intensive care, and during emergency interventions. These devices are essential for ensuring patient safety and for the timely detection of respiratory complications. The preference for hospitals stems from their need for continuous and accurate monitoring, the ability to integrate with other patient monitoring systems, and compliance with strict regulatory and clinical standards. Furthermore, the increasing number of surgical procedures, the rising prevalence of respiratory disorders, and a focus on improving clinical outcomes all contribute to the dominance of hospitals as end users, making them a significant driver of growth in the capnography equipment market.

REGION

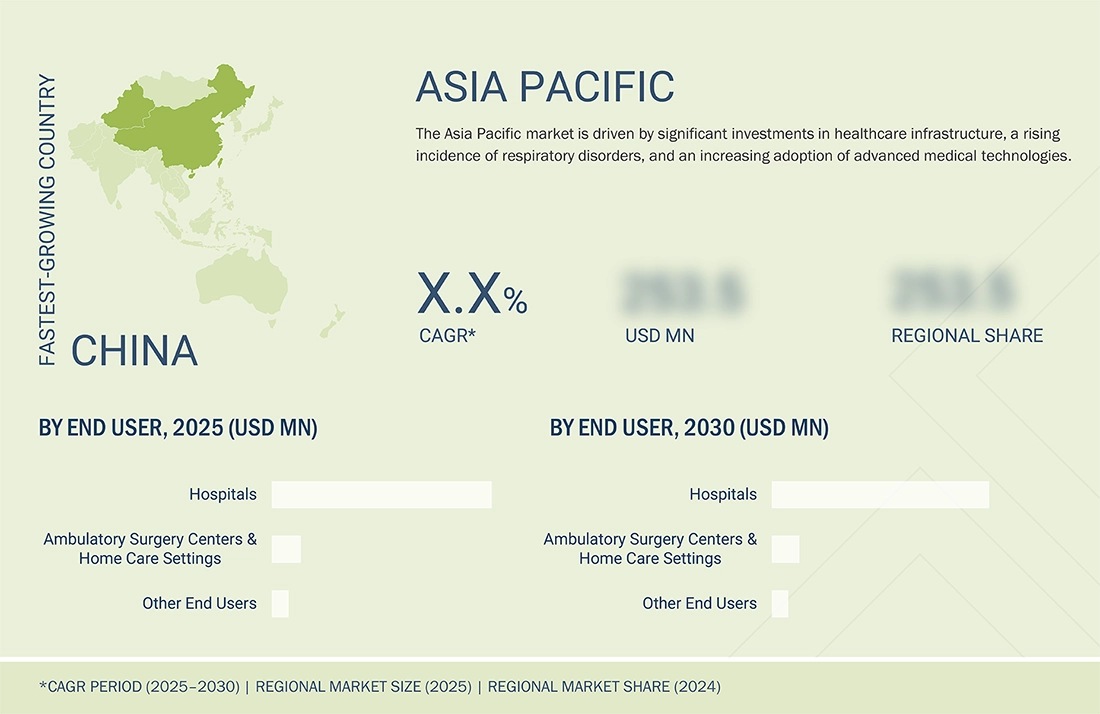
Asia Pacific to be fastest-growing region in global capnography equipment market during forecast period

The Asia Pacific region is projected to be the fastest-growing market for capnography equipment. This growth can be attributed to several factors, including the expansion of healthcare infrastructure, an increasing prevalence of respiratory diseases, a rising number of surgical procedures, and heightened awareness of patient monitoring. Additionally, the adoption of advanced medical technologies and portable monitoring solutions, combined with supportive government initiatives aimed at improving healthcare access, is further boosting market growth in the region. Countries such as China, India, and Japan are at the forefront of this expansion, establishing the Asia Pacific as a key driver of the global capnography equipment market.

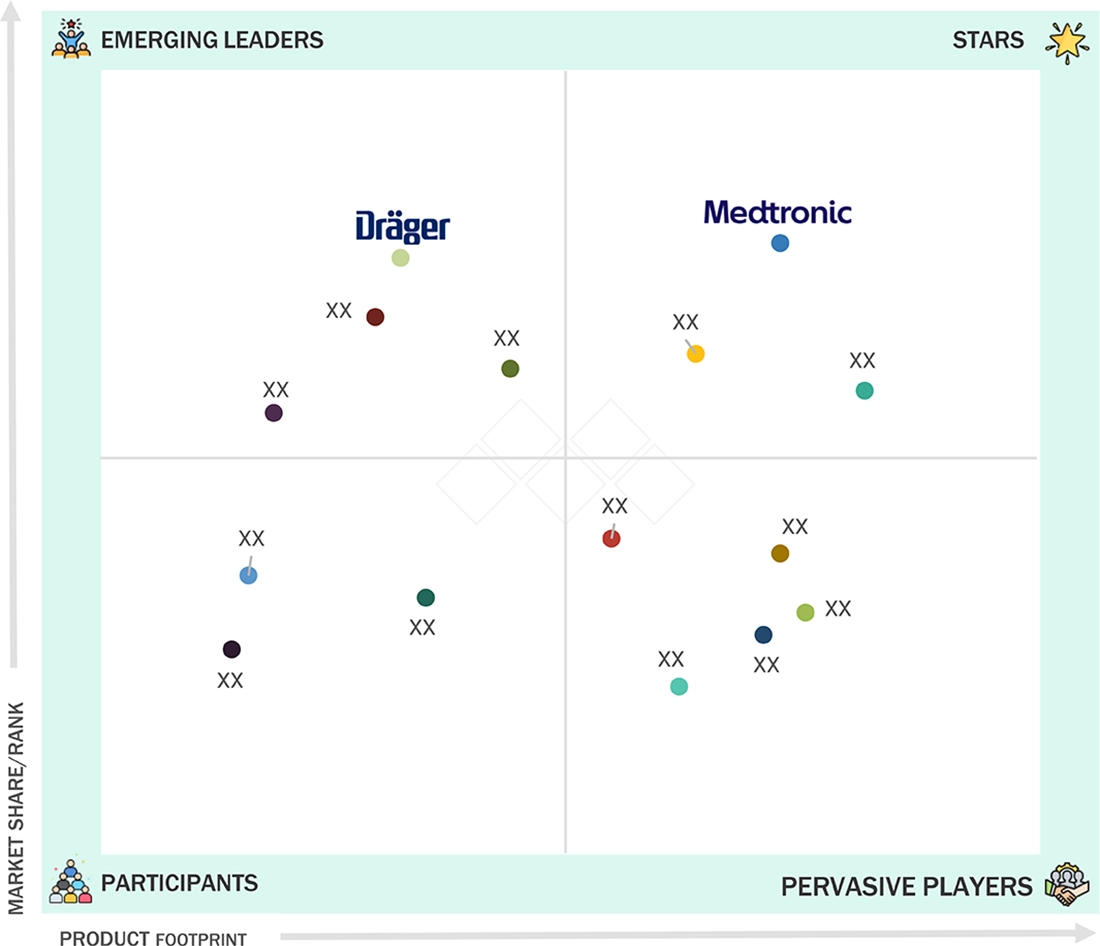
Capnography Equipment Market: COMPANY EVALUATION MATRIX

In the capnography equipment market, Medtronic holds a leading position due to its large-scale, extensive distribution network and comprehensive range of monitoring solutions. Dräger, identified as an Emerging Leader, is gaining traction by offering innovative capnography devices that enhance clinical accuracy, improve patient safety, and facilitate efficient respiratory monitoring. While Medtronic dominates the market with its global reach and established presence, Dräger’s emphasis on technological innovation positions it for rapid growth toward the leadership quadrant.

Source: Secondary Research, Interviews with Experts, MarketsandMarkets Analysis

MARKET SCOPE

REPORT METRIC DETAILS
Market Size in 2024 (Value) USD 0.51 Billion
Market Forecast in 2030 (Value) USD 0.67 Billion
Growth Rate CAGR of 4.6% from 2025-2030
Years Considered 2023-2030
Base Year 2024
Forecast Period 2025-2030
Units Considered Value (USD Million), Volume (Million Units)
Report Coverage Revenue Forecast, Company Ranking, Competitive Landscape, Growth Factors, and Trends
Segments Covered
  • By Product:
    • Equipment [Multiparameter Capnometers (Handheld
    • Conventional)
    • Standalone Capnometers(Handheld
    • Conventional)]
    • Software
    • Capnography Accessories & Disposables
  • By Technology:
    • Mainstream
    • Sidestream
    • Microstream
  • By Application:
    • Cardiac Care
    • Trauma & Emergency Care
    • Respiratory Monitoring
    • Other Applications
  • By End User:
    • Hospitals
    • Ambulatory Surgery Centers & Home Care Settings
    • Other End Users
  • By Region
Regions Covered North America, Asia Pacific, Europe, Latin America, and the Middle East & Africa

WHAT IS IN IT FOR YOU: Capnography Equipment Market REPORT CONTENT GUIDE

DELIVERED CUSTOMIZATIONS

We have successfully delivered the following deep-dive customizations:

CLIENT REQUEST CUSTOMIZATION DELIVERED VALUE ADDS
Product Analysis Comparison of top capnography equipment: multiparameter capnometers, standalone capnometers, capnography software, capnography accessories & disposables
  • Identify interconnections and supply chain blind spots
  • Detect customer migration trends across industries
Company Information
  • Key players: Medtronic (Ireland), Koninklijke Philips N.V. (Netherlands), Masimo (US), GE Healthcare (US), and Becton, Dickinson and Company (US)
  • Top 3–5 players market share analysis at the APAC and European country level
Insights on revenue shifts towards emerging therapeutic applications and device innovations
Geographic Analysis
  • Detailed analysis on the Rest of APAC was provided to one of the top players
  • The client focused on the ASEAN market at the country level for the device market
Country-level demand mapping for new product launches and localization strategy planning

RECENT DEVELOPMENTS

  • September 2025 : Philips and Masimo formed a strategic partnership focused on enhancing access to patient monitoring technologies. This collaboration aims to integrate Philips’ advanced patient monitoring platforms with Masimo’s innovative non-invasive monitoring systems. As a result, hospitals and healthcare providers will benefit from more accurate, real-time patient data. The partnership is designed to improve clinical decision-making and patient outcomes, especially in critical care and surgical environments.
  • December 2023 : Nantworks AirStrip entered into an agreement with GE HealthCare to commercialize integrated solutions for patient monitoring and cardiac data visualization in healthcare systems. This collaboration allows hospitals to utilize unified platforms for real-time monitoring of patients and their cardiac conditions, thereby enhancing workflow efficiency and patient management. By integrating AirStrip's mobile data technologies with GE HealthCare's monitoring devices, the partnership supports seamless visualization of patient data across various care settings.
  • July 2023 : Mindray DS USA acquired DiaSys Diagnostic Systems to consolidate its operations under the Mindray brand. This acquisition strengthens Mindray's global presence in in vitro diagnostics. DiaSys is well-regarded for its expertise in clinical chemistry and immunoturbidimetric reagents. By utilizing DiaSys's advanced diagnostic technologies and manufacturing capabilities, Mindray aims to provide a broader range of diagnostic solutions worldwide, thereby expanding both its product offerings and international reach.
  • July 2023 : Dräger received FDA 510(k) clearance for its Evita V600, V800, and Babylog VN800 ventilators. This clearance permits Dräger to market these devices in the US, confirming that they meet established safety and performance standards. The approval enables the use of these advanced ventilators in intensive care and neonatal units, enhancing respiratory support and monitoring capabilities for critically ill patients.
  • June 2023 : Philips announced that it received FDA clearance for several advanced features on its IntelliVue MX750 and MX850 patient monitors. These features include SedLine Brain Function Monitoring, Regional Oximetry (O3), and CO2 measurements. By incorporating these capabilities, the monitors provide enhanced real-time monitoring of neurological status, oxygen levels, and respiratory function, ultimately improving patient safety and clinical efficiency. Hospitals can now utilize these comprehensive monitoring solutions for surgical and critical care patients, supporting better health outcomes.
  • January 2023 : In January 2023, NantWorks, AirStrip, and GE HealthCare announced their collaboration to commercialize integrated patient monitoring and cardiac data visualization solutions. This announcement laid the groundwork for their formal agreement in December 2023. It underscores the increasing emphasis on digital and interoperable patient monitoring platforms that enable healthcare providers to effectively manage patient data across various systems.


Table of Contents

Exclusive indicates content/data unique to MarketsandMarkets and not available with any competitors.

TITLE
PAGE NO
INTRODUCTION
32
RESEARCH METHODOLOGY
36
EXECUTIVE SUMMARY
51
PREMIUM INSIGHTS
55
MARKET OVERVIEW
58
  • 5.1 INTRODUCTION
    DRIVERS
    - Increasing prevalence of respiratory diseases
    - Clinical benefits of capnography over pulse oximetry
    - Rising number of surgeries and target diseases requiring CO2 monitoring
    RESTRAINTS
    - Complex regulatory framework for approval of capnography equipment
    OPPORTUNITIES
    - Increased availability of clinical research evidence
    - Growth opportunities for healthcare industry in emerging economies
    CHALLENGES
    - Lack of skilled technicians and specialized training for operating capnometers
  • 5.2 INDUSTRY TRENDS
    ADVANCEMENTS OF WEARABLE AND WIRELESS DEVICES
    INTEGRATION WITH MULTIPARAMETER MONITORS
  • 5.3 VALUE CHAIN ANALYSIS
  • 5.4 PORTER’S FIVE FORCES ANALYSIS
    THREAT OF NEW ENTRANTS
    BARGAINING POWER OF SUPPLIERS
    BARGAINING POWER OF BUYERS
    THREAT OF SUBSTITUTES
    INTENSITY OF COMPETITIVE RIVALRY
  • 5.5 KEY STAKEHOLDERS & BUYING CRITERIA
    KEY STAKEHOLDERS IN BUYING PROCESS
    KEY BUYING CRITERIA
  • 5.6 PATENT ANALYSIS
  • 5.7 TRADE DATA ANALYSIS
    IMPORT DATA FOR HS CODE 9018
    EXPORT DATA FOR HS CODE 9018
  • 5.8 KEY CONFERENCES & EVENTS, 2024–2025
  • 5.9 UNMET NEEDS AND KEY PAIN POINTS
  • 5.10 ECOSYSTEM ANALYSIS
  • 5.11 SUPPLY CHAIN ANALYSIS
    PROMINENT COMPANIES
    SMALL AND MEDIUM-SIZED ENTERPRISES
    END USERS
  • 5.12 IMPACT OF AI/GEN AI ON CAPNOGRAPHY EQUIPMENT MARKET
  • 5.13 TRENDS/DISRUPTIONS IMPACTING CUSTOMER’S BUSINESS
  • 5.14 TECHNOLOGY ANALYSIS
    KEY TECHNOLOGIES
    - Mainstream capnography
    - Side-stream capnography
    - Waveform capnography
    COMPLEMENTARY TECHNOLOGIES
    - Pulse oximetry
    - Ventilators
    ADJACENT TECHNOLOGIES
    - Microrotor technology
  • 5.15 REGULATORY LANDSCAPE ANALYSIS
    REGULATORY BODIES, GOVERNMENT AGENCIES, AND OTHER ORGANIZATIONS
    REGULATORY FRAMEWORK
    - North America
    - Europe
    - Asia Pacific
  • 5.16 REIMBURSEMENT SCENARIO ANALYSIS
    REIMBURSEMENT CODES FOR CAPNOGRAPHY PROCEDURES
    REIMBURSEMENT LANDSCAPE FOR CAPNOGRAPHY EQUIPMENT, BY REGION
  • 5.17 INVESTMENT & FUNDING SCENARIO
  • 5.18 PRICING ANALYSIS
    INDICATIVE SELLING PRICE OF CAPNOGRAPHY EQUIPMENT, BY REGION
    AVERAGE SELLING PRICE FOR TOP THREE APPLICATIONS, BY KEY PLAYER, 2023
CAPNOGRAPHY EQUIPMENT MARKET, BY PRODUCT
100
  • 6.1 INTRODUCTION
  • 6.2 EQUIPMENT
    MULTIPARAMETER CAPNOMETERS
    - Handheld multiparameter capnometers
    - Conventional multiparameter capnometers
    STANDALONE CAPNOMETERS
    - Handheld standalone capnometers
    - Conventional standalone capnometers
  • 6.3 SOFTWARE
    BETTER CLINICAL DECISION-MAKING AND PATIENT MANAGEMENT TO FUEL MARKET GROWTH
  • 6.4 CAPNOGRAPHY ACCESSORIES & DISPOSABLES
    FAVORABLE REIMBURSEMENT SCENARIO TO SUPPORT MARKET GROWTH
CAPNOGRAPHY EQUIPMENT MARKET, BY TECHNOLOGY
124
  • 7.1 INTRODUCTION
  • 7.2 MAINSTREAM CAPNOGRAPHY
    HIGH ACCURACY, FAST RESPONSE TIME, AND IMPROVED SUITABILITY FOR NEONATES TO AID MARKET GROWTH
  • 7.3 SIDE-STREAM CAPNOGRAPHY
    RELIABLE MEASUREMENT OF END-TIDAL CO2 LEVELS TO PROPEL ADOPTION IN CLINICAL SETTINGS
  • 7.4 MICROSTREAM CAPNOGRAPHY
    LIMITATIONS IN BLACK-BODY INFRARED TECHNOLOGY TO LIMIT USAGE IN OPERATING ROOMS
CAPNOGRAPHY EQUIPMENT MARKET, BY APPLICATION
133
  • 8.1 INTRODUCTION
  • 8.2 CARDIAC CARE
    INCREASING NUMBER OF CARDIOPULMONARY SURGERIES AND RISING PREFERENCE FOR MONITORING ETCO2 LEVELS TO DRIVE MARKET
  • 8.3 TRAUMA & EMERGENCY CARE
    INCREASING NUMBER OF ROAD ACCIDENTS TO SPUR MARKET GROWTH
  • 8.4 RESPIRATORY MONITORING
    RISING PREVALENCE OF TARGET RESPIRATORY CONDITIONS TO SUPPORT MARKET GROWTH
  • 8.5 OTHER APPLICATIONS
CAPNOGRAPHY EQUIPMENT MARKET, BY END USER
145
  • 9.1 INTRODUCTION
  • 9.2 HOSPITALS
    FOCUS ON REDUCING AIRWAY-RELATED DEATHS IN ICU PATIENTS TO ACCELERATE MARKET GROWTH
  • 9.3 AMBULATORY SURGERY CENTERS & HOME CARE SETTINGS
    INCREASING NUMBER OF REIMBURSEMENT-APPROVED MEDICAL PROCEDURES UNDER ASC PAYMENT SYSTEM TO DRIVE MARKET
  • 9.4 OTHER END USERS
CAPNOGRAPHY EQUIPMENT MARKET, BY REGION
156
  • 10.1 INTRODUCTION
  • 10.2 NORTH AMERICA
    MACROECONOMIC OUTLOOK FOR NORTH AMERICA
    US
    - US to dominate North American capnography equipment market during forecast period
    CANADA
    - Rising prevalence of target respiratory diseases to support market growth
  • 10.3 EUROPE
    MACROECONOMIC OUTLOOK FOR EUROPE
    GERMANY
    - Developed healthcare infrastructure and high government investments to spur market growth
    UK
    - Increasing target patient population and rising healthcare expenditure to propel market growth
    FRANCE
    - Growing awareness of capnography monitoring procedures and increasing number of trauma cases to augment market growth
    ITALY
    - Rise in diabetes cases and high geriatric population to boost market growth
    SPAIN
    - Increasing prevalence of lifestyle diseases to drive demand for capnography equipment
    REST OF EUROPE
  • 10.4 ASIA PACIFIC
    MACROECONOMIC OUTLOOK FOR ASIA PACIFIC
    JAPAN
    - Rising geriatric population and growing prevalence of obesity to augment market growth
    CHINA
    - High target patient population and improved inpatient service availability to support market growth
    INDIA
    - Favorable regulatory policies and high public healthcare expenditure to aid market growth
    AUSTRALIA
    - Growing patient population and rising availability of grants to fuel market growth
    SOUTH KOREA
    - Increased focus on R&D activities and high penetration of health insurance to propel market growth
    REST OF ASIA PACIFIC
  • 10.5 LATIN AMERICA
    MACROECONOMIC OUTLOOK FOR LATIN AMERICA
    BRAZIL
    - Improved healthcare sector and increased private-public investments to drive market
    MEXICO
    - Favorable trade environment and easy entry of foreign players to fuel market growth
    REST OF LATIN AMERICA
  • 10.6 MIDDLE EAST & AFRICA
    MACROECONOMIC OUTLOOK FOR MIDDLE EAST & AFRICA
    GCC COUNTRIES
    - Healthcare infrastructural developments and increased focus on patient safety to drive market
    REST OF MIDDLE EAST & AFRICA
COMPETITIVE LANDSCAPE
233
  • 11.1 INTRODUCTION
  • 11.2 KEY PLAYER STRATEGY/RIGHT TO WIN
    OVERVIEW OF STRATEGIES ADOPTED BY PLAYERS IN CAPNOGRAPHY EQUIPMENT MARKET
  • 11.3 REVENUE ANALYSIS, 2019–2023
  • 11.4 MARKET SHARE ANALYSIS, 2023
    RANKING OF KEY MARKET PLAYERS
  • 11.5 COMPANY EVALUATION MATRIX: KEY PLAYERS, 2023
    STARS
    EMERGING LEADERS
    PERVASIVE PLAYERS
    PARTICIPANTS
    COMPANY FOOTPRINT: KEY PLAYERS, 2023
    - Company footprint
    - Product footprint
    - Technology footprint
    - Application footprint
    - End-user footprint
    - Region footprint
  • 11.6 COMPANY EVALUATION MATRIX: STARTUPS/SMES, 2023
    PROGRESSIVE COMPANIES
    RESPONSIVE COMPANIES
    DYNAMIC COMPANIES
    STARTING BLOCKS
    COMPETITIVE BENCHMARKING: STARTUPS/SMES, 2023
  • 11.7 COMPANY VALUATION & FINANCIAL METRICS
    FINANCIAL METRICS
    COMPANY VALUATION
  • 11.8 BRAND/PRODUCT COMPARISON
  • 11.9 COMPETITIVE SCENARIO
    PRODUCT LAUNCHES AND APPROVALS
    DEALS
COMPANY PROFILES
253
  • 12.1 KEY PLAYERS
    BECTON, DICKINSON AND COMPANY
    - Business overview
    - Products/Services/Solutions offered
    - MnM view
    MEDTRONIC
    - Business overview
    - Products/Services/Solutions offered
    - Recent developments
    - MnM view
    KONINKLIJKE PHILIPS N.V.
    - Business overview
    - Products/Services/Solutions offered
    - Recent developments
    - MnM view
    GE HEALTHCARE
    - Business overview
    - Products/Services/Solutions offered
    - Recent developments
    - MnM view
    DRÄGERWERK AG & CO. KGAA
    - Business overview
    - Products/Services/Solutions offered
    - MnM view
    NIHON KOHDEN CORPORATION
    - Business overview
    - Products/Services/Solutions offered
    - Recent developments
    ZOLL MEDICAL CORPORATION
    - Business overview
    - Products/Services/Solutions offered
    - Recent developments
    EDAN INSTRUMENTS, INC.
    - Business overview
    - Products/Services/Solutions offered
    HAMILTON MEDICAL
    - Business overview
    - Products/Services/Solutions offered
    - Recent developments
    MASIMO
    - Business overview
    - Products/Services/Solutions offered
    - Recent developments
    MINDRAY
    - Business overview
    - Products/Services/Solutions offered
    - Recent developments
    NONIN
    - Business overview
    - Products/Services/Solutions offered
    - Recent developments
    SCHILLER
    - Business overview
    - Products/Services/Solutions offered
    AVANTE
    - Business overview
    - Products/Services/Solutions offered
    ICU MEDICAL, INC.
    - Business overview
    - Products/Services/Solutions offered
    - Recent developments
  • 12.2 OTHER PLAYERS
    BIONICS CO., LTD.
    BPL MEDICAL TECHNOLOGIES
    BURTONS MEDICAL EQUIPMENT, LTD.
    CRITICARE TECHNOLOGIES, INC.
    DIAMEDICA (UK) LIMITED
    INFINIUM MEDICAL
    SPACELABS HEALTHCARE
    NIDEK MEDICAL INDIA
    RESMED
    RECORDERS & MEDICARE SYSTEMS PVT. LTD.
    SHENZHEN COMEN MEDICAL INSTRUMENTS CO., LTD.
    SLE LTD.
    ZOE MEDICAL
    EMCO MEDITEK PVT. LTD.
    MONARCH MEDITECH
APPENDIX
311
  • 13.1 DISCUSSION GUIDE
  • 13.2 KNOWLEDGESTORE: MARKETSANDMARKETS’ SUBSCRIPTION PORTAL
  • 13.3 CUSTOMIZATION OPTIONS
  • 13.4 RELATED REPORTS
  • 13.5 AUTHOR DETAILS
LIST OF TABLES
 
  • TABLE 1 CAPNOGRAPHY EQUIPMENT MARKET: INCLUSIONS & EXCLUSIONS
  • TABLE 2 CAPNOGRAPHY EQUIPMENT MARKET: STUDY ASSUMPTIONS
  • TABLE 3 CAPNOGRAPHY EQUIPMENT MARKET: RISK ASSESSMENT
  • TABLE 4 NUMBER OF DEATHS DUE TO COVID-19, INFLUENZA, AND RSV, 2020–2024 (TILL FEBRUARY 17)
  • TABLE 5 CAPNOGRAPHY EQUIPMENT MARKET: PORTER’S FIVE FORCES
  • TABLE 6 INFLUENCE OF KEY STAKEHOLDERS ON BUYING PROCESS FORTOP THREE END USERS (%)
  • TABLE 7 KEY BUYING CRITERIA FOR TOP THREE END USERS
  • TABLE 8 LIST OF MAJOR PATENT INNOVATIONS AND REGISTRATIONS, 2022–2024
  • TABLE 9 IMPORT DATA FOR HS CODE 9018, BY COUNTRY, 2019–2023 (USD THOUSAND)
  • TABLE 10 EXPORT DATA FOR HS CODE 9018, BY COUNTRY, 2019–2023 (USD THOUSAND)
  • TABLE 11 CAPNOGRAPHY EQUIPMENT MARKET: LIST OF KEY CONFERENCES & EVENTS, JANUARY 2024–DECEMBER 2025
  • TABLE 12 CAPNOGRAPHY EQUIPMENT MARKET: CURRENT UNMET NEEDS
  • TABLE 13 CAPNOGRAPHY EQUIPMENT MARKET: ROLE IN ECOSYSTEM
  • TABLE 14 NORTH AMERICA: REGULATORY BODIES, GOVERNMENT AGENCIES, AND OTHER ORGANIZATIONS
  • TABLE 15 EUROPE: REGULATORY BODIES, GOVERNMENT AGENCIES, AND OTHER ORGANIZATIONS
  • TABLE 16 ASIA PACIFIC: REGULATORY BODIES, GOVERNMENT AGENCIES, AND OTHER ORGANIZATIONS
  • TABLE 17 LATIN AMERICA: REGULATORY BODIES, GOVERNMENT AGENCIES, AND OTHER ORGANIZATIONS
  • TABLE 18 MIDDLE EAST & AFRICA: REGULATORY BODIES, GOVERNMENT AGENCIES, AND OTHER ORGANIZATIONS
  • TABLE 19 US FDA: MEDICAL DEVICE REGULATORY APPROVAL PROCESS
  • TABLE 20 REIMBURSEMENT CODES FOR VARIOUS PROCEDURES
  • TABLE 21 US: MAJOR CPT CODES FOR PULMONARY FUNCTION TEST, 2023
  • TABLE 22 INDICATIVE SELLING PRICE OF CAPNOGRAPHY EQUIPMENT, BY REGION, 2021–2023 (USD THOUSAND)
  • TABLE 23 INDICATIVE SELLING PRICE OF TOP THREE APPLICATIONS, BY KEY PLAYER, 2023 (USD)
  • TABLE 24 CAPNOGRAPHY EQUIPMENT MARKET, BY PRODUCT, 2022–2029 (USD MILLION)
  • TABLE 25 CAPNOGRAPHY EQUIPMENT MARKET, BY TYPE, 2023 (UNITS)
  • TABLE 26 CAPNOGRAPHY EQUIPMENT MARKET, BY TYPE, 2022–2029 (USD MILLION)
  • TABLE 27 CAPNOGRAPHY EQUIPMENT MARKET, BY REGION, 2022–2029 (USD MILLION)
  • TABLE 28 NORTH AMERICA: CAPNOGRAPHY EQUIPMENT MARKET, BY COUNTRY, 2022–2029 (USD MILLION)
  • TABLE 29 EUROPE: CAPNOGRAPHY EQUIPMENT MARKET, BY COUNTRY, 2022–2029 (USD MILLION)
  • TABLE 30 ASIA PACIFIC: CAPNOGRAPHY EQUIPMENT MARKET, BY COUNTRY, 2022–2029 (USD MILLION)
  • TABLE 31 LATIN AMERICA: CAPNOGRAPHY EQUIPMENT MARKET, BY COUNTRY, 2022–2029 (USD MILLION)
  • TABLE 32 MIDDLE EAST & AFRICA: CAPNOGRAPHY EQUIPMENT MARKET, BY REGION, 2022–2029 (USD MILLION)
  • TABLE 33 MULTIPARAMETER CAPNOMETERS MARKET, BY TYPE, 2022–2029 (USD MILLION)
  • TABLE 34 MULTIPARAMETER CAPNOMETERS MARKET, BY REGION, 2022–2029 (USD MILLION)
  • TABLE 35 NORTH AMERICA: MULTIPARAMETER CAPNOMETERS MARKET, BY COUNTRY, 2022–2029 (USD MILLION)
  • TABLE 36 EUROPE: MULTIPARAMETER CAPNOMETERS MARKET, BY COUNTRY, 2022–2029 (USD MILLION)
  • TABLE 37 ASIA PACIFIC: MULTIPARAMETER CAPNOMETERS MARKET, BY COUNTRY, 2022–2029 (USD MILLION)
  • TABLE 38 LATIN AMERICA: MULTIPARAMETER CAPNOMETERS MARKET, BY COUNTRY, 2022–2029 (USD MILLION)
  • TABLE 39 MIDDLE EAST & AFRICA: MULTIPARAMETER CAPNOMETERS MARKET, BY REGION, 2022–2029 (USD MILLION)
  • TABLE 40 HANDHELD MULTIPARAMETER CAPNOMETERS MARKET, BY REGION, 2022–2029 (USD MILLION)
  • TABLE 41 NORTH AMERICA: HANDHELD MULTIPARAMETER CAPNOMETERS MARKET, BY COUNTRY, 2022–2029 (USD MILLION)
  • TABLE 42 EUROPE: HANDHELD MULTIPARAMETER CAPNOMETERS MARKET, BY COUNTRY, 2022–2029 (USD MILLION)
  • TABLE 43 ASIA PACIFIC: HANDHELD MULTIPARAMETER CAPNOMETERS MARKET, BY COUNTRY, 2022–2029 (USD MILLION)
  • TABLE 44 LATIN AMERICA: HANDHELD MULTIPARAMETER CAPNOMETERS MARKET, BY COUNTRY, 2022–2029 (USD MILLION)
  • TABLE 45 MIDDLE EAST & AFRICA: HANDHELD MULTIPARAMETER CAPNOMETERS MARKET, BY REGION, 2022–2029 (USD MILLION)
  • TABLE 46 CONVENTIONAL MULTIPARAMETER CAPNOMETERS MARKET, BY REGION, 2022–2029 (USD MILLION)
  • TABLE 47 NORTH AMERICA: CONVENTIONAL MULTIPARAMETER CAPNOMETERS MARKET, BY COUNTRY, 2022–2029 (USD MILLION)
  • TABLE 48 EUROPE: CONVENTIONAL MULTIPARAMETER CAPNOMETERS MARKET, BY COUNTRY, 2022–2029 (USD MILLION)
  • TABLE 49 ASIA PACIFIC: CONVENTIONAL MULTIPARAMETER CAPNOMETERS MARKET, BY COUNTRY, 2022–2029 (USD MILLION)
  • TABLE 50 LATIN AMERICA: CONVENTIONAL MULTIPARAMETER CAPNOMETERS MARKET, BY COUNTRY, 2022–2029 (USD MILLION)
  • TABLE 51 MIDDLE EAST & AFRICA: CONVENTIONAL MULTIPARAMETER CAPNOMETERS MARKET, BY REGION, 2022–2029 (USD MILLION)
  • TABLE 52 STANDALONE CAPNOMETERS MARKET, BY TYPE, 2022–2029 (USD MILLION)
  • TABLE 53 STANDALONE CAPNOMETERS MARKET, BY REGION, 2022–2029 (USD MILLION)
  • TABLE 54 NORTH AMERICA: STANDALONE CAPNOMETERS MARKET, BY COUNTRY, 2022–2029 (USD MILLION)
  • TABLE 55 EUROPE: STANDALONE CAPNOMETERS MARKET, BY COUNTRY, 2022–2029 (USD MILLION)
  • TABLE 56 ASIA PACIFIC: STANDALONE CAPNOMETERS MARKET, BY COUNTRY, 2022–2029 (USD MILLION)
  • TABLE 57 LATIN AMERICA: STANDALONE CAPNOMETERS MARKET, BY COUNTRY, 2022–2029 (USD MILLION)
  • TABLE 58 MIDDLE EAST & AFRICA: STANDALONE CAPNOMETERS MARKET, BY REGION, 2022–2029 (USD MILLION)
  • TABLE 59 HANDHELD STANDALONE CAPNOMETERS MARKET, BY REGION, 2022–2029 (USD MILLION)
  • TABLE 60 NORTH AMERICA: HANDHELD STANDALONE CAPNOMETERS MARKET, BY COUNTRY, 2022–2029 (USD MILLION)
  • TABLE 61 EUROPE: HANDHELD STANDALONE CAPNOMETERS MARKET, BY COUNTRY, 2022–2029 (USD MILLION)
  • TABLE 62 ASIA PACIFIC: HANDHELD STANDALONE CAPNOMETERS MARKET, BY COUNTRY, 2022–2029 (USD MILLION)
  • TABLE 63 LATIN AMERICA: HANDHELD STANDALONE CAPNOMETERS MARKET, BY COUNTRY, 2022–2029 (USD MILLION)
  • TABLE 64 MIDDLE EAST & AFRICA: HANDHELD STANDALONE CAPNOMETERS MARKET, BY REGION, 2022–2029 (USD MILLION)
  • TABLE 65 CONVENTIONAL STANDALONE CAPNOMETERS MARKET, BY REGION, 2022–2029 (USD MILLION)
  • TABLE 66 NORTH AMERICA: CONVENTIONAL STANDALONE CAPNOMETERS MARKET, BY COUNTRY, 2022–2029 (USD MILLION)
  • TABLE 67 EUROPE: CONVENTIONAL STANDALONE CAPNOMETERS MARKET, BY COUNTRY, 2022–2029 (USD MILLION)
  • TABLE 68 ASIA PACIFIC: CONVENTIONAL STANDALONE CAPNOMETERS MARKET, BY COUNTRY, 2022–2029 (USD MILLION)
  • TABLE 69 LATIN AMERICA: CONVENTIONAL STANDALONE CAPNOMETERS MARKET, BY COUNTRY, 2022–2029 (USD MILLION)
  • TABLE 70 MIDDLE EAST & AFRICA: CONVENTIONAL STANDALONE CAPNOMETERS MARKET, BY REGION, 2022–2029 (USD MILLION)
  • TABLE 71 CAPNOGRAPHY SOFTWARE MARKET, BY REGION, 2022–2029 (USD MILLION)
  • TABLE 72 NORTH AMERICA: CAPNOGRAPHY SOFTWARE MARKET, BY COUNTRY, 2022–2029 (USD MILLION)
  • TABLE 73 EUROPE: CAPNOGRAPHY SOFTWARE MARKET, BY COUNTRY, 2022–2029 (USD MILLION)
  • TABLE 74 ASIA PACIFIC: CAPNOGRAPHY SOFTWARE MARKET, BY COUNTRY, 2022–2029 (USD MILLION)
  • TABLE 75 LATIN AMERICA: CAPNOGRAPHY SOFTWARE MARKET, BY COUNTRY, 2022–2029 (USD MILLION)
  • TABLE 76 MIDDLE EAST & AFRICA: CAPNOGRAPHY SOFTWARE MARKET, BY REGION, 2022–2029 (USD MILLION)
  • TABLE 77 CAPNOGRAPHY ACCESSORIES & DISPOSABLES MARKET, BY REGION, 2022–2029 (USD MILLION)
  • TABLE 78 NORTH AMERICA: CAPNOGRAPHY ACCESSORIES & DISPOSABLES MARKET, BY COUNTRY, 2022–2029 (USD MILLION)
  • TABLE 79 EUROPE: CAPNOGRAPHY ACCESSORIES & DISPOSABLES MARKET, BY COUNTRY, 2022–2029 (USD MILLION)
  • TABLE 80 ASIA PACIFIC: CAPNOGRAPHY ACCESSORIES & DISPOSABLES MARKET, BY COUNTRY, 2022–2029 (USD MILLION)
  • TABLE 81 LATIN AMERICA: CAPNOGRAPHY ACCESSORIES & DISPOSABLES MARKET, BY COUNTRY, 2022–2029 (USD MILLION)
  • TABLE 82 MIDDLE EAST & AFRICA: CAPNOGRAPHY ACCESSORIES & DISPOSABLES MARKET, BY REGION, 2022–2029 (USD MILLION)
  • TABLE 83 CAPNOGRAPHY EQUIPMENT MARKET, BY TECHNOLOGY, 2022–2029 (USD MILLION)
  • TABLE 84 MAINSTREAM CAPNOGRAPHY MARKET, BY REGION, 2022–2029 (USD MILLION)
  • TABLE 85 NORTH AMERICA: MAINSTREAM CAPNOGRAPHY MARKET, BY COUNTRY, 2022–2029 (USD MILLION)
  • TABLE 86 EUROPE: MAINSTREAM CAPNOGRAPHY MARKET, BY COUNTRY, 2022–2029 (USD MILLION)
  • TABLE 87 ASIA PACIFIC: MAINSTREAM CAPNOGRAPHY MARKET, BY COUNTRY, 2022–2029 (USD MILLION)
  • TABLE 88 LATIN AMERICA: MAINSTREAM CAPNOGRAPHY MARKET, BY COUNTRY, 2022–2029 (USD MILLION)
  • TABLE 89 MIDDLE EAST & AFRICA: MAINSTREAM CAPNOGRAPHY MARKET, BY REGION, 2022–2029 (USD MILLION)
  • TABLE 90 SIDE-STREAM CAPNOGRAPHY MARKET, BY REGION, 2022–2029 (USD MILLION)
  • TABLE 91 NORTH AMERICA: SIDE-STREAM CAPNOGRAPHY MARKET, BY COUNTRY, 2022–2029 (USD MILLION)
  • TABLE 92 EUROPE: SIDE-STREAM CAPNOGRAPHY MARKET, BY COUNTRY, 2022–2029 (USD MILLION)
  • TABLE 93 ASIA PACIFIC: SIDE-STREAM CAPNOGRAPHY MARKET, BY COUNTRY, 2022–2029 (USD MILLION)
  • TABLE 94 LATIN AMERICA: SIDE-STREAM CAPNOGRAPHY MARKET, BY COUNTRY, 2022–2029 (USD MILLION)
  • TABLE 95 MIDDLE EAST & AFRICA: SIDE-STREAM CAPNOGRAPHY MARKET, BY REGION, 2022–2029 (USD MILLION)
  • TABLE 96 MICROSTREAM CAPNOGRAPHY MARKET, BY REGION 2022–2029 (USD MILLION)
  • TABLE 97 NORTH AMERICA: MICROSTREAM CAPNOGRAPHY MARKET, BY COUNTRY, 2022–2029 (USD MILLION)
  • TABLE 98 EUROPE: MICROSTREAM CAPNOGRAPHY MARKET, BY COUNTRY, 2022–2029 (USD MILLION)
  • TABLE 99 ASIA PACIFIC: MICROSTREAM CAPNOGRAPHY MARKET, BY COUNTRY, 2022–2029 (USD MILLION)
  • TABLE 100 LATIN AMERICA: MICROSTREAM CAPNOGRAPHY MARKET, BY COUNTRY, 2022–2029 (USD MILLION)
  • TABLE 101 MIDDLE EAST & AFRICA: MICROSTREAM CAPNOGRAPHY MARKET, BY REGION, 2022–2029 (USD MILLION)
  • TABLE 102 CAPNOGRAPHY EQUIPMENT MARKET, BY APPLICATION, 2022–2029 (USD MILLION)
  • TABLE 103 CAPNOGRAPHY EQUIPMENT MARKET FOR CARDIAC CARE, BY REGION, 2022–2029 (USD MILLION)
  • TABLE 104 NORTH AMERICA: CAPNOGRAPHY EQUIPMENT MARKET FOR CARDIAC CARE, BY COUNTRY, 2022–2029 (USD MILLION)
  • TABLE 105 EUROPE: CAPNOGRAPHY EQUIPMENT MARKET FOR CARDIAC CARE, BY COUNTRY, 2022–2029 (USD MILLION)
  • TABLE 106 ASIA PACIFIC: CAPNOGRAPHY EQUIPMENT MARKET FOR CARDIAC CARE, BY COUNTRY, 2022–2029 (USD MILLION)
  • TABLE 107 LATIN AMERICA: CAPNOGRAPHY EQUIPMENT MARKET FOR CARDIAC CARE, BY COUNTRY, 2022–2029 (USD MILLION)
  • TABLE 108 MIDDLE EAST & AFRICA: CAPNOGRAPHY EQUIPMENT MARKET FOR CARDIAC CARE, BY REGION, 2022–2029 (USD MILLION)
  • TABLE 109 CAPNOGRAPHY EQUIPMENT MARKET FOR TRAUMA & EMERGENCY CARE, BY REGION, 2022–2029 (USD MILLION)
  • TABLE 110 NORTH AMERICA: CAPNOGRAPHY EQUIPMENT MARKET FOR TRAUMA & EMERGENCY CARE, BY COUNTRY, 2022–2029 (USD MILLION)
  • TABLE 111 EUROPE: CAPNOGRAPHY EQUIPMENT MARKET FOR TRAUMA & EMERGENCY CARE, BY COUNTRY, 2022–2029 (USD MILLION)
  • TABLE 112 ASIA PACIFIC: CAPNOGRAPHY EQUIPMENT MARKET FOR TRAUMA & EMERGENCY CARE, BY COUNTRY, 2022–2029 (USD MILLION)
  • TABLE 113 LATIN AMERICA: CAPNOGRAPHY EQUIPMENT MARKET FOR TRAUMA & EMERGENCY CARE, BY COUNTRY, 2022–2029 (USD MILLION)
  • TABLE 114 MIDDLE EAST & AFRICA: CAPNOGRAPHY EQUIPMENT MARKET FOR TRAUMA & EMERGENCY CARE, BY REGION, 2022–2029 (USD MILLION)
  • TABLE 115 CAPNOGRAPHY EQUIPMENT MARKET FOR RESPIRATORY MONITORING, BY REGION, 2022–2029 (USD MILLION)
  • TABLE 116 NORTH AMERICA: CAPNOGRAPHY EQUIPMENT MARKET FOR RESPIRATORY MONITORING, BY COUNTRY, 2022–2029 (USD MILLION)
  • TABLE 117 EUROPE: CAPNOGRAPHY EQUIPMENT MARKET FOR RESPIRATORY MONITORING, BY COUNTRY, 2022–2029 (USD MILLION)
  • TABLE 118 ASIA PACIFIC: CAPNOGRAPHY EQUIPMENT MARKET FOR RESPIRATORY MONITORING, BY COUNTRY, 2022–2029 (USD MILLION)
  • TABLE 119 LATIN AMERICA: CAPNOGRAPHY EQUIPMENT MARKET FOR RESPIRATORY MONITORING, BY COUNTRY, 2022–2029 (USD MILLION)
  • TABLE 120 MIDDLE EAST & AFRICA: CAPNOGRAPHY EQUIPMENT MARKET FOR RESPIRATORY MONITORING, BY REGION, 2022–2029 (USD MILLION)
  • TABLE 121 CAPNOGRAPHY EQUIPMENT MARKET FOR OTHER APPLICATIONS, BY REGION, 2022–2029 (USD MILLION)
  • TABLE 122 NORTH AMERICA: CAPNOGRAPHY EQUIPMENT MARKET FOR OTHER APPLICATIONS, BY COUNTRY, 2022–2029 (USD MILLION)
  • TABLE 123 EUROPE: CAPNOGRAPHY EQUIPMENT MARKET FOR OTHER APPLICATIONS, BY COUNTRY, 2022–2029 (USD MILLION)
  • TABLE 124 ASIA PACIFIC: CAPNOGRAPHY EQUIPMENT MARKET FOR OTHER APPLICATIONS, BY COUNTRY, 2022–2029 (USD MILLION)
  • TABLE 125 LATIN AMERICA: CAPNOGRAPHY EQUIPMENT MARKET FOR OTHER APPLICATIONS, BY COUNTRY, 2022–2029 (USD MILLION)
  • TABLE 126 MIDDLE EAST & AFRICA: CAPNOGRAPHY EQUIPMENT MARKET FOR OTHER APPLICATIONS, BY REGION, 2022–2029 (USD MILLION)
  • TABLE 127 CAPNOGRAPHY EQUIPMENT MARKET, BY END USER, 2022–2029 (USD MILLION)
  • TABLE 128 NORTH AMERICA: CAPNOGRAPHY EQUIPMENT END USER MARKET, BY COUNTRY, 2022–2029 (USD MILLION)
  • TABLE 129 EUROPE: CAPNOGRAPHY EQUIPMENT END USER MARKET, BY COUNTRY, 2022–2029 (USD MILLION)
  • TABLE 130 ASIA PACIFIC: CAPNOGRAPHY EQUIPMENT END USER MARKET, BY COUNTRY, 2022–2029 (USD MILLION)
  • TABLE 131 LATIN AMERICA: CAPNOGRAPHY EQUIPMENT END USER MARKET, BY COUNTRY, 2022–2029 (USD MILLION)
  • TABLE 132 MIDDLE EAST & AFRICA: CAPNOGRAPHY EQUIPMENT END USER MARKET, BY REGION, 2022–2029 (USD MILLION)
  • TABLE 133 CAPNOGRAPHY EQUIPMENT MARKET FOR HOSPITALS, BY REGION, 2022–2029 (USD MILLION)
  • TABLE 134 NORTH AMERICA: CAPNOGRAPHY EQUIPMENT MARKET FOR HOSPITALS, BY COUNTRY, 2022–2029 (USD MILLION)
  • TABLE 135 EUROPE: CAPNOGRAPHY EQUIPMENT MARKET FOR HOSPITALS, BY COUNTRY, 2022–2029 (USD MILLION)
  • TABLE 136 ASIA PACIFIC: CAPNOGRAPHY EQUIPMENT MARKET FOR HOSPITALS, BY COUNTRY, 2022–2029 (USD MILLION)
  • TABLE 137 LATIN AMERICA: CAPNOGRAPHY EQUIPMENT MARKET FOR HOSPITALS,BY COUNTRY, 2022–2029 (USD MILLION)
  • TABLE 138 MIDDLE EAST & AFRICA: CAPNOGRAPHY EQUIPMENT MARKET FOR HOSPITALS, BY REGION, 2022–2029 (USD MILLION)
  • TABLE 139 CAPNOGRAPHY EQUIPMENT MARKET FOR AMBULATORY SURGERY CENTERS & HOME CARE SETTINGS, BY REGION, 2022–2029 (USD MILLION)
  • TABLE 140 NORTH AMERICA: CAPNOGRAPHY EQUIPMENT MARKET FOR AMBULATORY SURGERY CENTERS & HOME CARE SETTINGS, BY COUNTRY, 2022–2029 (USD MILLION)
  • TABLE 141 EUROPE: CAPNOGRAPHY EQUIPMENT MARKET FOR AMBULATORY SURGERY CENTERS & HOME CARE SETTINGS, BY COUNTRY, 2022–2029 (USD MILLION)
  • TABLE 142 ASIA PACIFIC: CAPNOGRAPHY EQUIPMENT MARKET FOR AMBULATORY SURGERY CENTERS & HOME CARE SETTINGS, BY COUNTRY, 2022–2029 (USD MILLION)
  • TABLE 143 LATIN AMERICA: CAPNOGRAPHY EQUIPMENT MARKET FOR AMBULATORY SURGERY CENTERS & HOME CARE SETTINGS, BY COUNTRY, 2022–2029 (USD MILLION)
  • TABLE 144 MIDDLE EAST & AFRICA: CAPNOGRAPHY EQUIPMENT MARKET FOR AMBULATORY SURGERY CENTERS & HOME CARE SETTINGS, BY REGION, 2022–2029 (USD MILLION)
  • TABLE 145 CAPNOGRAPHY EQUIPMENT MARKET FOR OTHER END USERS, BY REGION, 2022–2029 (USD MILLION)
  • TABLE 146 NORTH AMERICA: CAPNOGRAPHY EQUIPMENT MARKET FOR OTHER END USERS, BY COUNTRY, 2022–2029 (USD MILLION)
  • TABLE 147 EUROPE: CAPNOGRAPHY EQUIPMENT MARKET FOR OTHER END USERS, BY COUNTRY, 2022–2029 (USD MILLION)
  • TABLE 148 ASIA PACIFIC: CAPNOGRAPHY EQUIPMENT MARKET FOR OTHER END USERS, BY COUNTRY, 2022–2029 (USD MILLION)
  • TABLE 149 LATIN AMERICA: CAPNOGRAPHY EQUIPMENT MARKET FOR OTHER END USERS, BY COUNTRY, 2022–2029 (USD MILLION)
  • TABLE 150 MIDDLE EAST & AFRICA: CAPNOGRAPHY EQUIPMENT MARKET FOR OTHER END USERS, BY REGION, 2022–2029 (USD MILLION)
  • TABLE 151 CAPNOGRAPHY EQUIPMENT MARKET, BY REGION, 2022–2029 (USD MILLION)
  • TABLE 152 NORTH AMERICA: CAPNOGRAPHY EQUIPMENT MARKET, BY TYPE, 2023 (UNITS)
  • TABLE 153 NORTH AMERICA: CAPNOGRAPHY EQUIPMENT MARKET, BY COUNTRY, 2022–2029 (USD MILLION)
  • TABLE 154 NORTH AMERICA: CAPNOGRAPHY EQUIPMENT MARKET, BY PRODUCT, 2022–2029 (USD MILLION)
  • TABLE 155 NORTH AMERICA: CAPNOGRAPHY EQUIPMENT MARKET, BY TYPE, 2022–2029 (USD MILLION)
  • TABLE 156 NORTH AMERICA: MULTIPARAMETER CAPNOMETERS MARKET, BY TYPE, 2022–2029 (USD MILLION)
  • TABLE 157 NORTH AMERICA: STANDALONE CAPNOMETERS MARKET, BY TYPE, 2022–2029 (USD MILLION)
  • TABLE 158 NORTH AMERICA: CAPNOGRAPHY EQUIPMENT MARKET, BY TECHNOLOGY, 2022–2029 (USD MILLION)
  • TABLE 159 NORTH AMERICA: CAPNOGRAPHY EQUIPMENT MARKET, BY APPLICATION, 2022–2029 (USD MILLION)
  • TABLE 160 NORTH AMERICA: CAPNOGRAPHY EQUIPMENT MARKET, BY END USER, 2022–2029 (USD MILLION)
  • TABLE 161 NORTH AMERICA: MACROECONOMIC INDICATORS
  • TABLE 162 US: CAPNOGRAPHY EQUIPMENT MARKET, BY PRODUCT, 2022–2029 (USD MILLION)
  • TABLE 163 US: CAPNOGRAPHY EQUIPMENT MARKET, BY TYPE, 2023 (UNITS)
  • TABLE 164 US: CAPNOGRAPHY EQUIPMENT MARKET, BY TYPE, 2022–2029 (USD MILLION)
  • TABLE 165 US: MULTIPARAMETER CAPNOMETERS MARKET, BY TYPE, 2022–2029 (USD MILLION)
  • TABLE 166 US: STANDALONE CAPNOMETERS MARKET, BY TYPE, 2022–2029 (USD MILLION)
  • TABLE 167 US: CAPNOGRAPHY EQUIPMENT MARKET, BY TECHNOLOGY, 2022–2029 (USD MILLION)
  • TABLE 168 US: CAPNOGRAPHY EQUIPMENT MARKET, BY APPLICATION, 2022–2029 (USD MILLION)
  • TABLE 169 US: CAPNOGRAPHY EQUIPMENT MARKET, BY END USER, 2022–2029 (USD MILLION)
  • TABLE 170 CANADA: CAPNOGRAPHY EQUIPMENT MARKET, BY PRODUCT, 2022–2029 (USD MILLION)
  • TABLE 171 CANADA: CAPNOGRAPHY EQUIPMENT MARKET, BY TYPE, 2023 (UNITS)
  • TABLE 172 CANADA: CAPNOGRAPHY EQUIPMENT MARKET, BY TYPE, 2022–2029 (USD MILLION)
  • TABLE 173 CANADA: MULTIPARAMETER CAPNOMETERS MARKET, BY TYPE, 2022–2029 (USD MILLION)
  • TABLE 174 CANADA: STANDALONE CAPNOMETERS MARKET, BY TYPE, 2022–2029 (USD MILLION)
  • TABLE 175 : CANADA: CAPNOGRAPHY EQUIPMENT MARKET, BY TECHNOLOGY, 2022–2029 (USD MILLION)
  • TABLE 176 CANADA: CAPNOGRAPHY EQUIPMENT MARKET, BY APPLICATION, 2022–2029 (USD MILLION)
  • TABLE 177 CANADA: CAPNOGRAPHY EQUIPMENT MARKET, BY END USER, 2022–2029 (USD MILLION)
  • TABLE 178 EUROPE: CAPNOGRAPHY EQUIPMENT MARKET, BY COUNTRY, 2022–2029 (USD MILLION)
  • TABLE 179 EUROPE: CAPNOGRAPHY EQUIPMENT MARKET, BY PRODUCT, 2022–2029 (USD MILLION)
  • TABLE 180 EUROPE: CAPNOGRAPHY EQUIPMENT MARKET, BY TYPE, 2023 (UNITS)
  • TABLE 181 EUROPE: CAPNOGRAPHY EQUIPMENT MARKET, BY TYPE, 2022–2029 (USD MILLION)
  • TABLE 182 EUROPE: MULTIPARAMETER CAPNOMETERS MARKET, BY TYPE, 2022–2029 (USD MILLION)
  • TABLE 183 EUROPE: STANDALONE CAPNOMETERS MARKET, BY TYPE, 2022–2029 (USD MILLION)
  • TABLE 184 EUROPE: CAPNOGRAPHY EQUIPMENT MARKET, BY TECHNOLOGY, 2022–2029 (USD MILLION)
  • TABLE 185 EUROPE: CAPNOGRAPHY EQUIPMENT MARKET, BY APPLICATION, 2022–2029 (USD MILLION)
  • TABLE 186 EUROPE: CAPNOGRAPHY EQUIPMENT MARKET, BY END USER, 2022–2029 (USD MILLION)
  • TABLE 187 EUROPE: MACROECONOMIC INDICATORS
  • TABLE 188 GERMANY: CAPNOGRAPHY EQUIPMENT MARKET, BY PRODUCT, 2022–2029 (USD MILLION)
  • TABLE 189 GERMANY: CAPNOGRAPHY EQUIPMENT MARKET, BY TYPE, 2023 (UNITS)
  • TABLE 190 GERMANY: CAPNOGRAPHY EQUIPMENT MARKET, BY TYPE, 2022–2029 (USD MILLION)
  • TABLE 191 GERMANY: MULTIPARAMETER CAPNOMETERS MARKET, BY TYPE, 2022–2029 (USD MILLION)
  • TABLE 192 GERMANY: STANDALONE CAPNOMETERS MARKET, BY TYPE, 2022–2029 (USD MILLION)
  • TABLE 193 GERMANY: CAPNOGRAPHY EQUIPMENT MARKET, BY TECHNOLOGY, 2022–2029 (USD MILLION)
  • TABLE 194 GERMANY: CAPNOGRAPHY EQUIPMENT MARKET, BY APPLICATION, 2022–2029 (USD MILLION)
  • TABLE 195 GERMANY: CAPNOGRAPHY EQUIPMENT MARKET, BY END USER, 2022–2029 (USD MILLION)
  • TABLE 196 UK: CAPNOGRAPHY EQUIPMENT MARKET, BY PRODUCT, 2022–2029 (USD MILLION)
  • TABLE 197 UK: CAPNOGRAPHY EQUIPMENT MARKET, BY TYPE, 2023 (UNITS)
  • TABLE 198 UK: CAPNOGRAPHY EQUIPMENT MARKET, BY TYPE, 2022–2029 (USD MILLION)
  • TABLE 199 UK: MULTIPARAMETER CAPNOMETERS MARKET, BY TYPE, 2022–2029 (USD MILLION)
  • TABLE 200 UK: STANDALONE CAPNOMETERS MARKET, BY TYPE, 2022–2029 (USD MILLION)
  • TABLE 201 UK: CAPNOGRAPHY EQUIPMENT MARKET, BY TECHNOLOGY, 2022–2029 (USD MILLION)
  • TABLE 202 UK: CAPNOGRAPHY EQUIPMENT MARKET, BY APPLICATION, 2022–2029 (USD MILLION)
  • TABLE 203 UK: CAPNOGRAPHY EQUIPMENT MARKET, BY END USER, 2022–2029 (USD MILLION)
  • TABLE 204 FRANCE: CAPNOGRAPHY EQUIPMENT MARKET, BY PRODUCT, 2022–2029 (USD MILLION)
  • TABLE 205 FRANCE: CAPNOGRAPHY EQUIPMENT MARKET, BY TYPE, 2023 (UNITS)
  • TABLE 206 FRANCE: CAPNOGRAPHY EQUIPMENT MARKET, BY TYPE, 2022–2029 (USD MILLION)
  • TABLE 207 FRANCE: MULTIPARAMETER CAPNOMETERS MARKET, BY TYPE, 2022–2029 (USD MILLION)
  • TABLE 208 FRANCE: STANDALONE CAPNOMETERS MARKET, BY TYPE, 2022–2029 (USD MILLION)
  • TABLE 209 FRANCE: CAPNOGRAPHY EQUIPMENT MARKET, BY TECHNOLOGY, 2022–2029 (USD MILLION)
  • TABLE 210 FRANCE: CAPNOGRAPHY EQUIPMENT MARKET, BY APPLICATION, 2022–2029 (USD MILLION)
  • TABLE 211 FRANCE: CAPNOGRAPHY EQUIPMENT MARKET, BY END USER, 2022–2029 (USD MILLION)
  • TABLE 212 ITALY: CAPNOGRAPHY EQUIPMENT MARKET, BY PRODUCT, 2022–2029 (USD MILLION)
  • TABLE 213 ITALY: CAPNOGRAPHY EQUIPMENT MARKET, BY TYPE, 2023 (UNITS)
  • TABLE 214 ITALY: CAPNOGRAPHY EQUIPMENT MARKET, BY TYPE, 2022–2029 (USD MILLION)
  • TABLE 215 ITALY: MULTIPARAMETER CAPNOMETERS MARKET, BY TYPE, 2022–2029 (USD MILLION)
  • TABLE 216 ITALY: STANDALONE CAPNOMETERS MARKET, BY TYPE, 2022–2029 (USD MILLION)
  • TABLE 217 ITALY: CAPNOGRAPHY EQUIPMENT MARKET, BY TECHNOLOGY, 2022–2029 (USD MILLION)
  • TABLE 218 ITALY: CAPNOGRAPHY EQUIPMENT MARKET, BY APPLICATION, 2022–2029 (USD MILLION)
  • TABLE 219 ITALY: CAPNOGRAPHY EQUIPMENT MARKET, BY END USER, 2022–2029 (USD MILLION)
  • TABLE 220 SPAIN: CAPNOGRAPHY EQUIPMENT MARKET, BY PRODUCT, 2022–2029 (USD MILLION)
  • TABLE 221 SPAIN: CAPNOGRAPHY EQUIPMENT MARKET, BY TYPE, 2023 (UNITS)
  • TABLE 222 SPAIN: CAPNOGRAPHY EQUIPMENT MARKET, BY TYPE, 2022–2029 (USD MILLION)
  • TABLE 223 SPAIN: MULTIPARAMETER CAPNOMETERS MARKET, BY TYPE, 2022–2029 (USD MILLION)
  • TABLE 224 SPAIN: STANDALONE CAPNOMETERS MARKET, BY TYPE, 2022–2029 (USD MILLION)
  • TABLE 225 SPAIN: CAPNOGRAPHY EQUIPMENT MARKET, BY TECHNOLOGY, 2022–2029 (USD MILLION)
  • TABLE 226 SPAIN: CAPNOGRAPHY EQUIPMENT MARKET, BY APPLICATION, 2022–2029 (USD MILLION)
  • TABLE 227 SPAIN: CAPNOGRAPHY EQUIPMENT MARKET, BY END USER, 2022–2029 (USD MILLION)
  • TABLE 228 REST OF EUROPE: CAPNOGRAPHY EQUIPMENT MARKET, BY PRODUCT, 2022–2029 (USD MILLION)
  • TABLE 229 REST OF EUROPE: CAPNOGRAPHY EQUIPMENT MARKET, BY TYPE, 2023 (UNITS)
  • TABLE 230 REST OF EUROPE: CAPNOGRAPHY EQUIPMENT MARKET, BY TYPE, 2022–2029 (USD MILLION)
  • TABLE 231 REST OF EUROPE: MULTIPARAMETER CAPNOMETERS MARKET, BY TYPE, 2022–2029 (USD MILLION)
  • TABLE 232 REST OF EUROPE: STANDALONE CAPNOMETERS MARKET, BY TYPE, 2022–2029 (USD MILLION)
  • TABLE 233 REST OF EUROPE: CAPNOGRAPHY EQUIPMENT MARKET, BY TECHNOLOGY, 2022–2029 (USD MILLION)
  • TABLE 234 REST OF EUROPE: CAPNOGRAPHY EQUIPMENT MARKET, BY APPLICATION, 2022–2029 (USD MILLION)
  • TABLE 235 REST OF EUROPE: CAPNOGRAPHY EQUIPMENT MARKET, BY END USER, 2022–2029 (USD MILLION)
  • TABLE 236 ASIA PACIFIC: CAPNOGRAPHY EQUIPMENT MARKET, BY COUNTRY, 2022–2029 (USD MILLION)
  • TABLE 237 ASIA PACIFIC: CAPNOGRAPHY EQUIPMENT MARKET, BY PRODUCT, 2022–2029 (USD MILLION)
  • TABLE 238 ASIA PACIFIC: CAPNOGRAPHY EQUIPMENT MARKET, BY TYPE, 2023 (UNITS)
  • TABLE 239 ASIA PACIFIC: CAPNOGRAPHY EQUIPMENT MARKET, BY TYPE, 2022–2029 (USD MILLION)
  • TABLE 240 ASIA PACIFIC: MULTIPARAMETER CAPNOMETERS MARKET, BY TYPE, 2022–2029 (USD MILLION)
  • TABLE 241 ASIA PACIFIC: STANDALONE CAPNOMETERS MARKET, BY TYPE, 2022–2029 (USD MILLION)
  • TABLE 242 ASIA PACIFIC: CAPNOGRAPHY EQUIPMENT MARKET, BY TECHNOLOGY, 2022–2029 (USD MILLION)
  • TABLE 243 ASIA PACIFIC: CAPNOGRAPHY EQUIPMENT MARKET, BY APPLICATION, 2022–2029 (USD MILLION)
  • TABLE 244 ASIA PACIFIC: CAPNOGRAPHY EQUIPMENT MARKET, BY END USER, 2022–2029 (USD MILLION)
  • TABLE 245 ASIA PACIFIC: MACROECONOMIC INDICATORS
  • TABLE 246 JAPAN: CAPNOGRAPHY EQUIPMENT MARKET, BY PRODUCT, 2022–2029 (USD MILLION)
  • TABLE 247 JAPAN: CAPNOGRAPHY EQUIPMENT MARKET, BY TYPE, 2023 (UNITS)
  • TABLE 248 JAPAN: CAPNOGRAPHY EQUIPMENT MARKET, BY TYPE, 2022–2029 (USD MILLION)
  • TABLE 249 JAPAN: MULTIPARAMETER CAPNOMETERS MARKET, BY TYPE, 2022–2029 (USD MILLION)
  • TABLE 250 JAPAN: STANDALONE CAPNOMETERS MARKET, BY TYPE, 2022–2029 (USD MILLION)
  • TABLE 251 JAPAN: CAPNOGRAPHY EQUIPMENT MARKET, BY TECHNOLOGY, 2022–2029 (USD MILLION)
  • TABLE 252 JAPAN: CAPNOGRAPHY EQUIPMENT MARKET, BY APPLICATION, 2022–2029 (USD MILLION)
  • TABLE 253 JAPAN: CAPNOGRAPHY EQUIPMENT MARKET, BY END USER, 2022–2029 (USD MILLION)
  • TABLE 254 CHINA: CAPNOGRAPHY EQUIPMENT MARKET, BY PRODUCT, 2022–2029 (USD MILLION)
  • TABLE 255 CHINA: CAPNOGRAPHY EQUIPMENT MARKET, BY TYPE, 2023 (UNITS)
  • TABLE 256 CHINA: CAPNOGRAPHY EQUIPMENT MARKET, BY TYPE, 2022–2029 (USD MILLION)
  • TABLE 257 CHINA: MULTIPARAMETER CAPNOMETERS MARKET, BY TYPE, 2022–2029 (USD MILLION)
  • TABLE 258 CHINA: STANDALONE CAPNOMETERS MARKET, BY TYPE, 2022–2029 (USD MILLION)
  • TABLE 259 CHINA: CAPNOGRAPHY EQUIPMENT MARKET, BY TECHNOLOGY, 2022–2029 (USD MILLION)
  • TABLE 260 CHINA: CAPNOGRAPHY EQUIPMENT MARKET, BY APPLICATION, 2022–2029 (USD MILLION)
  • TABLE 261 CHINA: CAPNOGRAPHY EQUIPMENT MARKET, BY END USER, 2022–2029 (USD MILLION)
  • TABLE 262 INDIA: CAPNOGRAPHY EQUIPMENT MARKET, BY PRODUCT, 2022–2029 (USD MILLION)
  • TABLE 263 INDIA: CAPNOGRAPHY EQUIPMENT MARKET, BY TYPE, 2023 (UNITS)
  • TABLE 264 INDIA: CAPNOGRAPHY EQUIPMENT MARKET, BY TYPE, 2022–2029 (USD MILLION)
  • TABLE 265 INDIA: MULTIPARAMETER CAPNOMETERS MARKET, BY TYPE, 2022–2029 (USD MILLION)
  • TABLE 266 INDIA: STANDALONE CAPNOMETERS MARKET, BY TYPE, 2022–2029 (USD MILLION)
  • TABLE 267 INDIA: CAPNOGRAPHY EQUIPMENT MARKET, BY TECHNOLOGY, 2022–2029 (USD MILLION)
  • TABLE 268 INDIA: CAPNOGRAPHY EQUIPMENT MARKET, BY APPLICATION, 2022–2029 (USD MILLION)
  • TABLE 269 INDIA: CAPNOGRAPHY EQUIPMENT MARKET, BY END USER, 2022–2029 (USD MILLION)
  • TABLE 270 AUSTRALIA: CAPNOGRAPHY EQUIPMENT MARKET, BY PRODUCT, 2022–2029 (USD MILLION)
  • TABLE 271 AUSTRALIA: CAPNOGRAPHY EQUIPMENT MARKET, BY TYPE, 2023 (UNITS)
  • TABLE 272 AUSTRALIA: CAPNOGRAPHY EQUIPMENT MARKET, BY TYPE, 2022–2029 (USD MILLION)
  • TABLE 273 AUSTRALIA: MULTIPARAMETER CAPNOMETERS MARKET, BY TYPE, 2022–2029 (USD MILLION)
  • TABLE 274 AUSTRALIA: STANDALONE CAPNOMETERS MARKET, BY TYPE, 2022–2029 (USD MILLION)
  • TABLE 275 AUSTRALIA: CAPNOGRAPHY EQUIPMENT MARKET, BY TECHNOLOGY, 2022–2029 (USD MILLION)
  • TABLE 276 AUSTRALIA: CAPNOGRAPHY EQUIPMENT MARKET, BY APPLICATION, 2022–2029 (USD MILLION)
  • TABLE 277 AUSTRALIA: CAPNOGRAPHY EQUIPMENT MARKET, BY END USER, 2022–2029 (USD MILLION)
  • TABLE 278 SOUTH KOREA: CAPNOGRAPHY EQUIPMENT MARKET, BY PRODUCT, 2022–2029 (USD MILLION)
  • TABLE 279 SOUTH KOREA: CAPNOGRAPHY EQUIPMENT MARKET, BY TYPE, 2023 (UNITS)
  • TABLE 280 SOUTH KOREA: CAPNOGRAPHY EQUIPMENT MARKET, BY TYPE, 2022–2029 (USD MILLION)
  • TABLE 281 SOUTH KOREA: MULTIPARAMETER CAPNOMETERS MARKET, BY TYPE, 2022–2029 (USD MILLION)
  • TABLE 282 SOUTH KOREA: STANDALONE CAPNOMETERS MARKET, BY TYPE, 2022–2029 (USD MILLION)
  • TABLE 283 SOUTH KOREA: CAPNOGRAPHY EQUIPMENT MARKET, BY TECHNOLOGY, 2022–2029 (USD MILLION)
  • TABLE 284 SOUTH KOREA: CAPNOGRAPHY EQUIPMENT MARKET, BY APPLICATION, 2022–2029 (USD MILLION)
  • TABLE 285 SOUTH KOREA: CAPNOGRAPHY EQUIPMENT MARKET, BY END USER, 2022–2029 (USD MILLION)
  • TABLE 286 REST OF ASIA PACIFIC: CAPNOGRAPHY EQUIPMENT MARKET, BY PRODUCT, 2022–2029 (USD MILLION)
  • TABLE 287 REST OF ASIA PACIFIC: CAPNOGRAPHY EQUIPMENT MARKET, BY TYPE, 2023 (UNITS)
  • TABLE 288 REST OF ASIA PACIFIC: CAPNOGRAPHY EQUIPMENT MARKET, BY TYPE, 2022–2029 (USD MILLION)
  • TABLE 289 REST OF ASIA PACIFIC: MULTIPARAMETER CAPNOMETERS MARKET, BY TYPE, 2022–2029 (USD MILLION)
  • TABLE 290 REST OF ASIA PACIFIC: STANDALONE CAPNOMETERS MARKET, BY TYPE, 2022–2029 (USD MILLION)
  • TABLE 291 REST OF ASIA PACIFIC: CAPNOGRAPHY EQUIPMENT MARKET, BY TECHNOLOGY, 2022–2029 (USD MILLION)
  • TABLE 292 REST OF ASIA PACIFIC: CAPNOGRAPHY EQUIPMENT MARKET, BY APPLICATION, 2022–2029 (USD MILLION)
  • TABLE 293 REST OF ASIA PACIFIC: CAPNOGRAPHY EQUIPMENT MARKET, BY END USER, 2022–2029 (USD MILLION)
  • TABLE 294 LATIN AMERICA: CAPNOGRAPHY EQUIPMENT MARKET, BY COUNTRY, 2022–2029 (USD MILLION)
  • TABLE 295 LATIN AMERICA: CAPNOGRAPHY EQUIPMENT MARKET, BY PRODUCT, 2022–2029 (USD MILLION)
  • TABLE 296 LATIN AMERICA: CAPNOGRAPHY EQUIPMENT MARKET, BY TYPE, 2023 (UNITS)
  • TABLE 297 LATIN AMERICA: CAPNOGRAPHY EQUIPMENT MARKET, BY TYPE, 2022–2029 (USD MILLION)
  • TABLE 298 LATIN AMERICA: MULTIPARAMETER CAPNOMETERS MARKET, BY TYPE, 2022–2029 (USD MILLION)
  • TABLE 299 LATIN AMERICA: STANDALONE CAPNOMETERS MARKET, BY TYPE, 2022–2029 (USD MILLION)
  • TABLE 300 LATIN AMERICA: CAPNOGRAPHY EQUIPMENT MARKET, BY TECHNOLOGY, 2022–2029 (USD MILLION)
  • TABLE 301 LATIN AMERICA: CAPNOGRAPHY EQUIPMENT MARKET, BY APPLICATION, 2022–2029 (USD MILLION)
  • TABLE 302 LATIN AMERICA: CAPNOGRAPHY EQUIPMENT MARKET, BY END USER, 2022–2029 (USD MILLION)
  • TABLE 303 LATIN AMERICA: MACROECONOMIC INDICATORS
  • TABLE 304 BRAZIL: CAPNOGRAPHY EQUIPMENT MARKET, BY PRODUCT, 2022–2029 (USD MILLION)
  • TABLE 305 BRAZIL: CAPNOGRAPHY EQUIPMENT MARKET, BY TYPE, 2023 (UNITS)
  • TABLE 306 BRAZIL: CAPNOGRAPHY EQUIPMENT MARKET, BY TYPE, 2022–2029 (USD MILLION)
  • TABLE 307 BRAZIL: MULTIPARAMETER CAPNOMETERS MARKET, BY TYPE, 2022–2029 (USD MILLION)
  • TABLE 308 BRAZIL: STANDALONE CAPNOMETERS MARKET, BY TYPE, 2022–2029 (USD MILLION)
  • TABLE 309 BRAZIL: CAPNOGRAPHY EQUIPMENT MARKET, BY TECHNOLOGY, 2022–2029 (USD MILLION)
  • TABLE 310 BRAZIL: CAPNOGRAPHY EQUIPMENT MARKET, BY APPLICATION, 2022–2029 (USD MILLION)
  • TABLE 311 BRAZIL: CAPNOGRAPHY EQUIPMENT MARKET, BY END USER, 2022–2029 (USD MILLION)
  • TABLE 312 MEXICO: CAPNOGRAPHY EQUIPMENT MARKET, BY PRODUCT, 2022–2029 (USD MILLION)
  • TABLE 313 MEXICO: CAPNOGRAPHY EQUIPMENT MARKET, BY TYPE, 2023 (UNITS)
  • TABLE 314 MEXICO: CAPNOGRAPHY EQUIPMENT MARKET, BY TYPE, 2022–2029 (USD MILLION)
  • TABLE 315 MEXICO: MULTIPARAMETER CAPNOMETERS MARKET, BY TYPE, 2022–2029 (USD MILLION)
  • TABLE 316 MEXICO: STANDALONE CAPNOMETERS MARKET, BY TYPE, 2022–2029 (USD MILLION)
  • TABLE 317 MEXICO: CAPNOGRAPHY EQUIPMENT MARKET, BY TECHNOLOGY, 2022–2029 (USD MILLION)
  • TABLE 318 MEXICO: CAPNOGRAPHY EQUIPMENT MARKET, BY APPLICATION, 2022–2029 (USD MILLION)
  • TABLE 319 MEXICO: CAPNOGRAPHY EQUIPMENT MARKET, BY END USER, 2022–2029 (USD MILLION)
  • TABLE 320 REST OF LATIN AMERICA: CAPNOGRAPHY EQUIPMENT MARKET, BY PRODUCT, 2022–2029 (USD MILLION)
  • TABLE 321 REST OF LATIN AMERICA: CAPNOGRAPHY EQUIPMENT MARKET, BY TYPE, 2023 (UNITS)
  • TABLE 322 REST OF LATIN AMERICA: CAPNOGRAPHY EQUIPMENT MARKET, BY TYPE, 2022–2029 (USD MILLION)
  • TABLE 323 REST OF LATIN AMERICA: MULTIPARAMETER CAPNOMETERS MARKET, BY TYPE, 2022–2029 (USD MILLION)
  • TABLE 324 REST OF LATIN AMERICA: STANDALONE CAPNOMETERS MARKET, BY TYPE, 2022–2029 (USD MILLION)
  • TABLE 325 REST OF LATIN AMERICA: CAPNOGRAPHY EQUIPMENT MARKET, BY TECHNOLOGY, 2022–2029 (USD MILLION)
  • TABLE 326 REST OF LATIN AMERICA: CAPNOGRAPHY EQUIPMENT MARKET, BY APPLICATION, 2022–2029 (USD MILLION)
  • TABLE 327 REST OF LATIN AMERICA: CAPNOGRAPHY EQUIPMENT MARKET, BY END USER, 2022–2029 (USD MILLION)
  • TABLE 328 MIDDLE EAST & AFRICA: CAPNOGRAPHY EQUIPMENT MARKET, BY REGION, 2022–2029 (USD MILLION)
  • TABLE 329 MIDDLE EAST & AFRICA: CAPNOGRAPHY EQUIPMENT MARKET, BY PRODUCT, 2022–2029 (USD MILLION)
  • TABLE 330 MIDDLES EAST & AFRICA: CAPNOGRAPHY EQUIPMENT MARKET, BY TYPE, 2023 (UNITS)
  • TABLE 331 MIDDLE EAST & AFRICA: CAPNOGRAPHY EQUIPMENT MARKET, BY TYPE, 2022–2029 (USD MILLION)
  • TABLE 332 MIDDLE EAST & AFRICA: MULTIPARAMETER CAPNOMETERS MARKET, BY TYPE, 2022–2029 (USD MILLION)
  • TABLE 333 MIDDLE EAST & AFRICA: STANDALONE CAPNOMETERS MARKET, BY TYPE, 2022–2029 (USD MILLION)
  • TABLE 334 MIDDLE EAST & AFRICA: CAPNOGRAPHY EQUIPMENT MARKET, BY TECHNOLOGY, 2022–2029 (USD MILLION)
  • TABLE 335 MIDDLE EAST & AFRICA: CAPNOGRAPHY EQUIPMENT MARKET, BY APPLICATION, 2022–2029 (USD MILLION)
  • TABLE 336 MIDDLE EAST & AFRICA: CAPNOGRAPHY EQUIPMENT MARKET, BY END USER, 2022–2029 (USD MILLION)
  • TABLE 337 MIDDLE EAST & AFRICA: MACROECONOMIC INDICATORS
  • TABLE 338 GCC COUNTRIES: CAPNOGRAPHY EQUIPMENT MARKET, BY PRODUCT, 2022–2029 (USD MILLION)
  • TABLE 339 GCC COUNTRIES: CAPNOGRAPHY EQUIPMENT MARKET, BY TYPE, 2023 (UNITS)
  • TABLE 340 GCC COUNTRIES: CAPNOGRAPHY EQUIPMENT MARKET, BY TYPE, 2022–2029 (USD MILLION)
  • TABLE 341 GCC COUNTRIES: MULTIPARAMETER CAPNOMETERS MARKET, BY TYPE, 2022–2029 (USD MILLION)
  • TABLE 342 GCC COUNTRIES: STANDALONE CAPNOMETERS MARKET, BY TYPE, 2022–2029 (USD MILLION)
  • TABLE 343 GCC COUNTRIES: CAPNOGRAPHY EQUIPMENT MARKET, BY TECHNOLOGY, 2022–2029 (USD MILLION)
  • TABLE 344 GCC COUNTRIES: CAPNOGRAPHY EQUIPMENT MARKET, BY APPLICATION, 2022–2029 (USD MILLION)
  • TABLE 345 GCC COUNTRIES: CAPNOGRAPHY EQUIPMENT MARKET, BY END USER, 2022–2029 (USD MILLION)
  • TABLE 346 REST OF MIDDLES EAST & AFRICA: CAPNOGRAPHY EQUIPMENT MARKET, BY TYPE, 2023 (UNITS)
  • TABLE 347 REST OF MIDDLE EAST & AFRICA: CAPNOGRAPHY EQUIPMENT MARKET, BY PRODUCT, 2022–2029 (USD MILLION)
  • TABLE 348 REST OF MIDDLE EAST & AFRICA: CAPNOGRAPHY EQUIPMENT MARKET, BY TYPE, 2022–2029 (USD MILLION)
  • TABLE 349 REST OF MIDDLE EAST & AFRICA: MULTIPARAMETER CAPNOMETERS MARKET, BY TYPE, 2022–2029 (USD MILLION)
  • TABLE 350 REST OF MIDDLE EAST & AFRICA: STANDALONE CAPNOMETERS MARKET, BY TYPE, 2022–2029 (USD MILLION)
  • TABLE 351 REST OF MIDDLE EAST & AFRICA: CAPNOGRAPHY EQUIPMENT MARKET, BY TECHNOLOGY, 2022–2029 (USD MILLION)
  • TABLE 352 REST OF MIDDLE EAST & AFRICA: CAPNOGRAPHY EQUIPMENT MARKET, BY APPLICATION, 2022–2029 (USD MILLION)
  • TABLE 353 REST OF MIDDLE EAST & AFRICA: CAPNOGRAPHY EQUIPMENT MARKET, BY END USER, 2022–2029 (USD MILLION)
  • TABLE 354 OVERVIEW OF STRATEGIES DEPLOYED BY KEY COMPANIES IN CAPNOGRAPHY EQUIPMENT MARKET
  • TABLE 355 CAPNOGRAPHY EQUIPMENT MARKET: DEGREE OF COMPETITION
  • TABLE 356 CAPNOGRAPHY EQUIPMENT MARKET: PRODUCT FOOTPRINT
  • TABLE 357 CAPNOGRAPHY EQUIPMENT MARKET: TECHNOLOGY FOOTPRINT
  • TABLE 358 CAPNOGRAPHY EQUIPMENT MARKET: APPLICATION FOOTPRINT
  • TABLE 359 CAPNOGRAPHY EQUIPMENT MARKET: END-USER FOOTPRINT
  • TABLE 360 CAPNOGRAPHY EQUIPMENT MARKET: REGION FOOTPRINT
  • TABLE 361 CAPNOGRAPHY EQUIPMENT MARKET: COMPETITIVE BENCHMARKING OF KEY EMERGING PLAYERS/STARTUPS
  • TABLE 362 CAPNOGRAPHY EQUIPMENT MARKET: PRODUCT LAUNCHES AND APPROVALS, JANUARY 2021– OCTOBER 2024
  • TABLE 363 CAPNOGRAPHY EQUIPMENT MARKET: DEALS, JANUARY 2021–OCTOBER 2024
  • TABLE 364 BECTON, DICKINSON AND COMPANY: COMPANY OVERVIEW
  • TABLE 365 BECTON, DICKINSON AND COMPANY: PRODUCTS/SERVICES/SOLUTIONS OFFERED
  • TABLE 366 MEDTRONIC: COMPANY OVERVIEW
  • TABLE 367 MEDTRONIC: PRODUCTS/SERVICES/SOLUTIONS OFFERED
  • TABLE 368 MEDTRONIC: PRODUCT APPROVALS, JANUARY 2021–OCTOBER 2024
  • TABLE 369 MEDTRONIC: DEALS, JANUARY 2021–OCTOBER 2024
  • TABLE 370 KONINKLIJKE PHILIPS N.V.: COMPANY OVERVIEW
  • TABLE 371 KONINKLIJKE PHILIPS N.V.: PRODUCTS/SERVICES/SOLUTIONS OFFERED
  • TABLE 372 KONINKLIJKE PHILIPS N.V.: DEALS, JANUARY 2021–OCTOBER 2024
  • TABLE 373 GE HEALTHCARE: COMPANY OVERVIEW
  • TABLE 374 GE HEALTHCARE: PRODUCTS/SERVICES/SOLUTIONS OFFERED
  • TABLE 375 GE HEALTHCARE: DEALS, JANUARY 2021–OCTOBER 2024
  • TABLE 376 DRÄGERWERK AG & CO. KGAA: COMPANY OVERVIEW
  • TABLE 377 DRÄGERWERK AG & CO. KGAA: PRODUCTS/SERVICES/SOLUTIONS OFFERED
  • TABLE 378 NIHON KOHDEN CORPORATION: COMPANY OVERVIEW
  • TABLE 379 NIHON KOHDEN CORPORATION PRODUCTS/SERVICES/SOLUTIONS OFFERED
  • TABLE 380 NIHON KOHDEN CORPORATION: DEALS, JANUARY 2021–OCTOBER 2024
  • TABLE 381 ZOLL MEDICAL CORPORATION: COMPANY OVERVIEW
  • TABLE 382 ZOLL MEDICAL CORPORATION: PRODUCTS/SERVICES/SOLUTIONS OFFERED
  • TABLE 383 ZOLL MEDICAL CORPORATION: DEALS, JANUARY 2021–OCTOBER 2024
  • TABLE 384 EDAN INSTRUMENTS, INC.: COMPANY OVERVIEW
  • TABLE 385 EDAN INSTRUMENTS, INC.: PRODUCTS/SERVICES/SOLUTIONS OFFERED
  • TABLE 386 HAMILTON MEDICAL: COMPANY OVERVIEW
  • TABLE 387 HAMILTON MEDICAL: PRODUCTS/SERVICES/SOLUTIONS OFFERED
  • TABLE 388 HAMILTON MEDICAL: PRODUCT LAUNCHES, JANUARY 2021–OCTOBER 2024
  • TABLE 389 MASIMO: COMPANY OVERVIEW
  • TABLE 390 MASIMO: PRODUCTS/SERVICES/SOLUTIONS OFFERED
  • TABLE 391 MASIMO: PRODUCT APPROVALS, JANUARY 2021–OCTOBER 2024
  • TABLE 392 MINDRAY: COMPANY OVERVIEW
  • TABLE 393 MINDRAY: PRODUCTS/SERVICES/SOLUTIONS OFFERED
  • TABLE 394 MINDRAY: PRODUCT LAUNCHES, JANUARY 2021–OCTOBER 2024
  • TABLE 395 MINDRAY: DEALS, JANUARY 2021–OCTOBER 2024
  • TABLE 396 NONIN: COMPANY OVERVIEW
  • TABLE 397 NONIN: PRODUCTS/SERVICES/SOLUTIONS OFFERED
  • TABLE 398 NONIN: PRODUCT LAUNCHES, JANUARY 2021–OCTOBER 2024
  • TABLE 399 NONIN: DEALS, JANUARY 2021–OCTOBER 2024
  • TABLE 400 SCHILLER: COMPANY OVERVIEW
  • TABLE 401 SCHILLER: PRODUCTS/SERVICES/SOLUTIONS OFFERED
  • TABLE 402 AVANTE: COMPANY OVERVIEW
  • TABLE 403 AVANTE: PRODUCTS/SERVICES/SOLUTIONS OFFERED
  • TABLE 404 ICU MEDICAL, INC.: COMPANY OVERVIEW
  • TABLE 405 ICU MEDICAL, INC.: PRODUCTS/SERVICES/SOLUTIONS OFFERED
  • TABLE 406 ICU MEDICAL, INC.: DEALS, JANUARY 2021–OCTOBER 2024
  • TABLE 407 BIONICS CO., LTD.: COMPANY OVERVIEW
  • TABLE 408 BPL MEDICAL TECHNOLOGIES: COMPANY OVERVIEW
  • TABLE 409 BURTONS MEDICAL EQUIPMENT, LTD.: COMPANY OVERVIEW
  • TABLE 410 CRITICARE TECHNOLOGIES, INC.: COMPANY OVERVIEW
  • TABLE 411 DIAMEDICA (UK) LIMITED: COMPANY OVERVIEW
  • TABLE 412 INFINIUM MEDICAL: COMPANY OVERVIEW
  • TABLE 413 SPACELABS HEALTHCARE: COMPANY OVERVIEW
  • TABLE 414 NIDEK MEDICAL INDIA: COMPANY OVERVIEW
  • TABLE 415 RESMED: COMPANY OVERVIEW
  • TABLE 416 RECORDERS & MEDICARE SYSTEMS PVT. LTD.: COMPANY OVERVIEW
  • TABLE 417 SHENZHEN COMEN MEDICAL INSTRUMENTS CO., LTD.: COMPANY OVERVIEW
  • TABLE 418 SLE LTD.: COMPANY OVERVIEW
  • TABLE 419 ZOE MEDICAL: COMPANY OVERVIEW
  • TABLE 420 EMCO MEDITEK PVT. LTD.: COMPANY OVERVIEW
  • TABLE 421 MONARCH MEDITECH: COMPANY OVERVIEW
LIST OF FIGURES
 
  • FIGURE 1 CAPNOGRAPHY EQUIPMENT MARKET: SEGMENTS AND REGIONS CONSIDERED
  • FIGURE 2 CAPNOGRAPHY EQUIPMENT MARKET: YEARS CONSIDERED
  • FIGURE 3 CAPNOGRAPHY EQUIPMENT MARKET: RESEARCH METHODOLOGY
  • FIGURE 4 CAPNOGRAPHY EQUIPMENT MARKET: RESEARCH DESIGN
  • FIGURE 5 CAPNOGRAPHY EQUIPMENT MARKET: KEY DATA FROM SECONDARY SOURCES
  • FIGURE 6 CAPNOGRAPHY EQUIPMENT MARKET: KEY PRIMARY SOURCES
  • FIGURE 7 CAPNOGRAPHY EQUIPMENT MARKET: KEY INDUSTRY INSIGHTS
  • FIGURE 8 BREAKDOWN OF PRIMARY INTERVIEWS: BY COMPANY TYPE, DESIGNATION, AND REGION
  • FIGURE 9 BREAKDOWN OF PRIMARY INTERVIEWS: SUPPLY- AND DEMAND-SIDE PARTICIPANTS
  • FIGURE 10 RESEARCH METHODOLOGY: HYPOTHESIS BUILDING
  • FIGURE 11 CAPNOGRAPHY EQUIPMENT MARKET SIZE ESTIMATION: COMPANY REVENUE ESTIMATION
  • FIGURE 12 CAPNOGRAPHY EQUIPMENT MARKET SIZE ESTIMATION: BOTTOM-UP APPROACH
  • FIGURE 13 CAPNOGRAPHY EQUIPMENT MARKET: TOP-DOWN APPROACH
  • FIGURE 14 CAGR PROJECTIONS: SUPPLY-SIDE ANALYSIS
  • FIGURE 15 CAPNOGRAPHY EQUIPMENT MARKET: DATA TRIANGULATION
  • FIGURE 16 CAPNOGRAPHY EQUIPMENT MARKET, BY PRODUCT, 2024 VS. 2029 (USD MILLION)
  • FIGURE 17 CAPNOGRAPHY EQUIPMENT MARKET, BY TECHNOLOGY, 2024 VS. 2029 (USD MILLION)
  • FIGURE 18 CAPNOGRAPHY EQUIPMENT MARKET, BY APPLICATION, 2024 VS. 2029 (USD MILLION)
  • FIGURE 19 CAPNOGRAPHY EQUIPMENT MARKET, BY END USER, 2024 VS. 2029 (USD MILLION)
  • FIGURE 20 CAPNOGRAPHY EQUIPMENT MARKET: REGIONAL SNAPSHOT
  • FIGURE 21 INCREASING NUMBER OF CRITICAL SURGERIES AND GROWING FOCUS ON PATIENT SAFETY TO DRIVE MARKET
  • FIGURE 22 NORTH AMERICAN CAPNOGRAPHY EQUIPMENT MARKET TO REGISTER HIGHEST GROWTH RATE DURING STUDY PERIOD
  • FIGURE 23 US AND HOSPITALS SEGMENT TO ACCOUNT FOR LARGESTMARKET SHARE IN 2024
  • FIGURE 24 CHINA TO REGISTER HIGHEST CAGR FROM 2024 TO 2029
  • FIGURE 25 CAPNOGRAPHY EQUIPMENT MARKET: DRIVERS, RESTRAINTS, OPPORTUNITIES, AND CHALLENGES
  • FIGURE 26 CAPNOGRAPHY EQUIPMENT MARKET: VALUE CHAIN ANALYSIS
  • FIGURE 27 CAPNOGRAPHY EQUIPMENT MARKET: PORTER’S FIVE FORCES ANALYSIS
  • FIGURE 28 INFLUENCE OF STAKEHOLDERS ON BUYING PROCESS FOR TOP THREE END USERS
  • FIGURE 29 KEY BUYING CRITERIA FOR TOP THREE END USERS
  • FIGURE 30 PATENT ANALYSIS FOR CAPNOGRAPHY EQUIPMENT MARKET (JANUARY 2013– DECEMBER 2023)
  • FIGURE 31 CAPNOGRAPHY EQUIPMENT MARKET: ECOSYSTEM ANALYSIS
  • FIGURE 32 CAPNOGRAPHY EQUIPMENT MARKET: SUPPLY CHAIN ANALYSIS
  • FIGURE 33 IMPACT OF AI/GEN AI ON CAPNOGRAPHY EQUIPMENT MARKET
  • FIGURE 34 CAPNOGRAPHY EQUIPMENT MARKET: TRENDS/DISRUPTIONS IMPACTING CUSTOMER’S BUSINESS
  • FIGURE 35 CAPNOGRAPHY EQUIPMENT MARKET: FUNDING AND NUMBER OF DEALS, 2019–2023
  • FIGURE 36 NUMBER OF INVESTOR DEALS, BY KEY PLAYER, 2019–2023
  • FIGURE 37 VALUE OF INVESTOR DEALS, BY KEY PLAYER, 2019–2023 (USD MILLION)
  • FIGURE 38 AVERAGE SELLING PRICE OF CAPNOGRAPHY EQUIPMENT, BY REGION, 2021–2023 (USD THOUSAND)
  • FIGURE 39 AVERAGE SELLING PRICE TREND FOR TOP THREE APPLICATIONS, BY KEY PLAYER, 2023
  • FIGURE 40 NORTH AMERICA: CAPNOGRAPHY EQUIPMENT MARKET SNAPSHOT
  • FIGURE 41 ASIA PACIFIC: CAPNOGRAPHY EQUIPMENT MARKET SNAPSHOT
  • FIGURE 42 REVENUE ANALYSIS OF KEY PLAYERS IN CAPNOGRAPHY EQUIPMENT MARKET, 2019–2023 (USD BILLION)
  • FIGURE 43 MARKET SHARE ANALYSIS OF KEY PLAYERS IN CAPNOGRAPHY EQUIPMENT MARKET (2023)
  • FIGURE 44 RANKING OF KEY PLAYERS IN CAPNOGRAPHY EQUIPMENT MARKET, 2023
  • FIGURE 45 CAPNOGRAPHY EQUIPMENT MARKET: COMPANY EVALUATION MATRIX (KEY PLAYERS), 2023
  • FIGURE 46 CAPNOGRAPHY EQUIPMENT MARKET: COMPANY FOOTPRINT
  • FIGURE 47 CAPNOGRAPHY EQUIPMENT MARKET: COMPANY EVALUATION MATRIX (STARTUPS/SMES), 2023
  • FIGURE 48 EV/EBITDA OF KEY VENDORS
  • FIGURE 49 YEAR-TO-DATE (YTD) PRICE TOTAL RETURN AND 5-YEAR STOCK BETA OF KEY VENDORS
  • FIGURE 50 CAPNOGRAPHY EQUIPMENT MARKET: BRAND/PRODUCT COMPARATIVE ANALYSIS
  • FIGURE 51 BECTON, DICKINSON AND COMPANY: COMPANY SNAPSHOT
  • FIGURE 52 MEDTRONIC: COMPANY SNAPSHOT
  • FIGURE 53 KONINKLIJKE PHILIPS N.V.: COMPANY SNAPSHOT
  • FIGURE 54 GE HEALTHCARE: COMPANY SNAPSHOT
  • FIGURE 55 DRÄGERWERK AG & CO. KGAA: COMPANY SNAPSHOT
  • FIGURE 56 NIHON KOHDEN CORPORATION: COMPANY SNAPSHOT
  • FIGURE 57 MASIMO: COMPANY SNAPSHOT
  • FIGURE 58 MINDRAY: COMPANY SNAPSHOT
  • FIGURE 59 ICU MEDICAL, INC.: COMPANY SNAPSHOT


Methodology

The study used an extensive amount of both primary and secondary sources to conduct an all-around study of forces affecting the industry. This methodology included market segmentation analysis, industry trends, finding prominent players, competitive landscape analysis, key market dynamics, and the strategies used by the prominent companies.

Secondary Research

This secondary research used D&B Hoovers, Bloomberg Businessweek, Factiva, white papers, annual reports, company filings, investor presentations, and SEC filings to create a comprehensive database of the leading participants in the industry. The database combined key data from leading companies, market segmentation at multiple levels, industry trends by segment, major mergers and acquisition activity, and the role played by technology progressions in the capnography equipment market.

Primary Research

The primary research was a qualitative and quantitative investigation through comprehensive interviews with the participants in both the demand and supply sides of the market. Supply side involved high-level executives including CEOs, VPs, marketing and sales directors, regional sales managers, and even the technology and innovation directors in leading companies and organizations in the product therapy markets. Through interviews of professionals - clinicians, procurement managers, purchase managers, department heads and experts from hospitals, diagnostic centers, pharmaceutical and biotechnological firms, and research and academic institutes, the market segmentation, the key players and the related trends and dynamics that are encouraging the growth of this market can be understood.

A breakdown of the primary respondents is provided below:

Capnography Equipment Market

*Others include sales managers, marketing managers, business development managers, product managers, distributors, and suppliers.

Note: Companies are classified into tiers based on their total revenue. As of 2023, Tier 1 = >USD 1 billion, Tier 2 = < USD 500 million, and Tier 3 = < USD 100 million.

To know about the assumptions considered for the study, download the pdf brochure

Market Size Estimation

This report is a deep analysis of the market for the capnography equipment. It involves the identification of the main market players through a combination of primary and secondary research. The secondary research is conducted based on annual and financial reports from the leading market players, while the primary research is composed of extensive interviews with key opinion leaders who included CEOs, directors, and senior marketing executives.

  • To estimate the global market value, a segment-based methodology was adopted. This methodology involves gathering revenue data of major solution and service providers. The process includes: - Identification of key players in the global market for capnography equipment.
  • Charting their announced annual revenues, either from capnography equipment specifically or from their overall business unit/product.
Capnography Equipment Market

Data Triangulation

The research methodology undertaken included segmenting the global capnography equipment market into different categories and subcategories. The data triangulation and segmentation processes helped ensure that accurate data were available for the various market segments. Various analyses were done to understand all the factors and trends related to both the demand and supply sides of the market. The detailed integration between the top-down and bottom-up approaches provided a comprehensive overview of the capnography equipment market.

Market Definition

Capnography is defined as the medical monitoring technique that measures the amount of carbon dioxide (CO2) exhaled with every breath. The capnography equipment like a capnograph is applied for monitoring the patient's respiratory status, ventilation, and circulation. With its wide applicability in any field of health such as in hospitals, intensive care units, and operating rooms, capnography helps healthcare providers assess the effectiveness of ventilation, early detection of respiratory problems, and adjustment of treatment accordingly.

Stakeholders

  • Healthcare institutions (hospitals and Home care)
  • Healthcare institutions (hospitals)
  • Research institutions
  • Clinical research organizations
  • Academic medical centers and universities
  • Reference laboratories
  • Accountable Care Organizations (ACOs)
  • Research and consulting firms
  • Contract research organizations (CROs) and contract manufacturing organizations (CMOs)
  • Academic medical centers and universities
  • Market research and consulting firms
  • Group Purchasing Organizations (GPOs)
  • Medical Research Laboratories
  • Academic Medical Centers and Universities

Report Objectives

  • Market analysis can be made on various dimensions like product types, technologies, applications, end-users, and regional areas.
  • Explore any opportunity for stakeholders and carry out a fine scrutiny of the competitive landscape along with key players.
  • Provide in-depth insights into the key drivers influencing market growth.
  • Analyze the growth trend of the individual, their potential contribution to the micro-markets' overall market.
  • Competitive responses such as new product launches, approvals, agreements, partnerships, expansions, acquisitions, and collaborations in the capnography equipment market.


Personalize This Research

  • Triangulate with your Own Data
  • Get Data as per your Format and Definition
  • Gain a Deeper Dive on a Specific Application, Geography, Customer or Competitor
  • Any level of Personalization
Request A Free Customisation

Let Us Help You

  • What are the Known and Unknown Adjacencies Impacting the Capnography Equipment Market
  • What will your New Revenue Sources be?
  • Who will be your Top Customer; what will make them switch?
  • Defend your Market Share or Win Competitors
  • Get a Scorecard for Target Partners
Customized Workshop Request

Custom Market Research Services

We Will Customise The Research For You, In Case The Report Listed Above Does Not Meet With Your Requirements

Get 10% Free Customisation

Growth opportunities and latent adjacency in Capnography Equipment Market

DMCA.com Protection Status