Optometry Equipment Market by Type (OCT, Ophthalmoscope, Autorefractor, Tonometer, Slitlamps, Wavefront Analyzer), Application (General Examination, Cataract, Glaucoma, Macular Degeneration), End User (Clinics, Hospitals) & Region - Global Forecast to 2027
Revenue Growth Projections in the Global Optometry Equipment Market
The global optometry equipment market is estimated to be worth $4.0 billion in 2022 and is expected to grow at a CAGR of 6.4% from 2022 to 2027, reaching $5.4 billion.
The new research study consists of an industry trend analysis of the market. The new research study consists of industry trends, pricing analysis, patent analysis, conference and webinar materials, key stakeholders, and buying behaviour in the market. This edition also covers the product and geographical footprint of the key players in the competitive landscape chapter. Market growth is driven by the rising technological advancements in optometry equipment and the growing awareness of early disease diagnosis in developing countries.
To know about the assumptions considered for the study, Request for Free Sample Report
Optometry Equipment Market Dynamics
Driver: Increasing incidence of eye disorders
The global optometry equipment industry is driven by the increasing incidence of eye disorders, such as age-related macular degeneration, glaucoma, and cataracts, among others. The incidence of eye diseases is increasing due to the increasing geriatric population and changing lifestyle patterns, such as lack of physical activity, increased intake of unhealthy food, increased exposure to digital screens, and increased pollution levels, among others. The growing prevalence of eye disorders has prompted the need for early detection and treatment, thereby driving the demand for optometry equipment. Moreover, rising awareness regarding eye care and the availability of technologically advanced optometry equipment are expected to drive the market further over the forecast period.
Opportunity: Growth opportunities in emerging countries
The optometry equipment market is expected to witness significant growth in the coming years, driven by the increasing prevalence of eye diseases and the growing awareness about vision care. According to the World Health Organization (WHO), an estimated 2.2 billion people suffer from vision impairment or blindness, with an estimated 1 billion having uncorrected refractive error. This is expected to create significant opportunities for providers of optometry equipment in the market. The rising prevalence of vision-related issues, coupled with the growing awareness of vision care, is likely to fuel the growth of the optometry equipment industry. Moreover, the rising demand for advanced optometry equipment, such as laser scanners, fundus cameras, and optical coherence tomography (OCT) machines, is expected to propel the market further. Additionally, the increasing demand for optometry equipment in emerging countries, such as India, China, and Brazil, is expected to create substantial growth opportunities for market players over the forecast period. The growth of the optometry equipment market in these countries is being driven by the rising awareness about eye health, increasing disposable incomes, and the presence of a large patient population. Furthermore, governments in these countries are taking initiatives to provide better access to eye care services, which is expected to further drive the growth of the optometry equipment market in the coming years.
Restraint: High cost and adoption of refurbished optometry equipment
The high cost of optometry equipment is one of the major restraints of the optometry equipment industry. Optometry equipment can be extremely expensive and this cost is not easily accessible to many healthcare providers. Additionally, many healthcare providers are opting to use refurbished optometry equipment in order to save money and reduce costs. Refurbished equipment is typically cheaper than new equipment and can offer similar performance and features. This trend of using refurbished equipment is further driving down the sales of new optometry equipment, thus limiting the growth of the optometry equipment industry.
Challenge: Low awareness & limited accessibility to eye care in low-income economies
The challenge of low awareness and limited accessibility to eye care in low-income economies is a major challenge to the optometry equipment industry. In such economies, access to basic eye care services and equipment is often very limited. This lack of access can lead to a lack of knowledge about the importance of regular eye exams and the dangers of vision loss. This can lead to increased rates of vision-related disabilities as well as a lack of access to the necessary optometry equipment to diagnose and treat vision-related problems. In order to address this challenge, organizations and governments must work to increase awareness about the importance of eye care, as well as provide access to necessary optometry equipment. This could include providing free or low-cost eye exams as well as ensuring that optometry equipment is available in remote and rural areas. Additionally, initiatives must be taken to promote the availability of optometry equipment in low-income countries in order to ensure that individuals have access to the necessary equipment to diagnose and treat vision-related problems.
The retina and glaucoma examination products segment accounted for the largest share of the optometry equipment industry, by type.
The optometry equipment market is divided into three types: retina and glaucoma examination products, general examination products, and cornea and cataract examination products. The growing numbers of glaucoma and retinal diseases and the rising diabetes and hypertension populations are the key contributors to the market growth of this segment.
The general examination segment accounted for the largest share in the optometry equipment industry, by application.
The optometry equipment market is divided into applications such as general examinations, cataract, glaucoma, age-related macular degeneration, and others. The major share of this segment is contributed by the rise in awareness of ocular care, the increasing prevalence of eye diseases, and the growing geriatric population.
The clinics segment accounted for the largest share of the optometry equipment industry by end user.
The optometry equipment market is divided into clinics, hospitals, and other end users. The increasing prevalence of eye disorders among the geriatric population, the huge number of patients treated in clinics, and the growing number of private clinics in developing countries all contribute to the large share of this segment in the market.
North America accounted for the largest share of the optometry equipment industry.
The optometry equipment market is segmented into five major regions, namely, North America, Europe, the Asia Pacific, Latin America, and the Middle East and Africa. North America held the biggest market share of the global market. The substantial share of this regional market is due to a number of factors, including the rising prevalence of chronic eye diseases, rising healthcare costs, and the existence of numerous top manufacturers.
To know about the assumptions considered for the study, download the pdf brochure
The optometry equipment market is dominated by players such as Carl Zeiss Meditec AG (Germany), EssilorLuxottica (France), Alcon (Switzerland), Topcon Corporation (Japan), and Bausch Health Companies Inc. (Canada).
Scope of the Optometry Equipment Industry
Report Metric |
Details |
Market Revenue in 2022 |
$4.0 billion |
Projected Revenue by 2027 |
$5.4 billion |
Revenue Rate |
Poised to grow at a CAGR of 6.4% |
Market Driver |
Increasing incidence of eye disorders |
Market Opportunity |
Growth opportunities in emerging countries |
This research report categorizes the optometry equipment market to forecast revenue and analyze trends in each of the following submarkets
By Type
-
Retina and Glaucoma Examination Products
- OCT Scanners
- Fundus Cameras
- Perimeters/Visual Field Analyzers
- Ophthalmoscopes
- Retinoscopes
- General Examination Products
- Autorefractors and Keratometry
- Ophthalmic Ultrasound Systems
- Tonometer
- Slit Lamps
- Lens meters
-
Chart Projectors
- Cornea and Cataract Examination Products
- Wave front Aberrometers/Analyzer
- Optical Biometry System
- Corneal Topographical System
- Specular Microscopes
By Application
- General Examination
- Cataract
- Glaucoma
- Age-related Macular Degeneration(AMD)
- Other Applications
By End User
- Clinics
- Hospitals
- Other End Users
By Region
-
North America
- US
- Canada
-
Europe
- Germany
- UK
- France
- Italy
- Russia
- Spain
- Rest of Europe
-
Asia Pacific
- China
- Japan
- India
- Rest of Asia Pacific
- Latin America
- Middle East & Africa
Recent Developments of Optometry Equipment Industry
- Johnson & Johnson Vision's Acquisition of TearScience In January 2021, Johnson & Johnson Vision announced that it had acquired privately held TearScience, a company that develops and markets ocular surface health diagnostics and therapeutic solutions for dry eye disease. The acquisition will help Johnson & Johnson Vision expand its portfolio and increase its presence in the optometry market.
- EssilorLuxottica Acquisition of GrandVision: In March 2021, EssilorLuxottica announced that it had acquired GrandVision, one of the world’s leading optical retail companies. The acquisition will help Essilor Luxottica to further expand its presence in the optical retail market and strengthen its position as a global leader in the eyecare industry.
- CooperVision Acquisition of Acuvue: In April 2021, CooperVision announced that it had acquired Acuvue, a world leader in contact lenses and related products. The acquisition will help CooperVision expand its presence in the contact lens market and strengthen its leadership in the eyecare industry.
- HOYA Group Acquisition of Pentax Medical: In May 2021, the HOYA Group announced that it had acquired Pentax Medical, a global leader in medical equipment and related technologies. The acquisition will help the HOYA Group expand its presence in the healthcare sector and further strengthen its position as a leader in the optometry market.
Frequently Asked Questions (FAQ):
What is the projected market revenue value of the global optometry equipment market?
The global optometry equipment market boasts a total revenue value of $5.4 billion by 2027.
What is the estimated growth rate (CAGR) of the global optometry equipment market?
The global optometry equipment market has an estimated compound annual growth rate (CAGR) of 6.4% and a revenue size in the region of $4.0 billion in 2022.
To speak to our analyst for a discussion on the above findings, click Speak to Analyst
TABLE OF CONTENTS
1 INTRODUCTION (Page No. - 30)
1.1 STUDY OBJECTIVES
1.2 OPTOMETRY EQUIPMENT INDUSTRY DEFINITION
1.2.1 INCLUSIONS AND EXCLUSIONS
1.3 MARKET SCOPE
1.3.1 MARKETS COVERED
FIGURE 1 OPTOMETRY EQUIPMENT MARKET SEGMENTATION
FIGURE 2 GLOBAL MARKET, BY REGION
1.3.2 YEARS CONSIDERED
1.4 CURRENCY
1.5 LIMITATIONS
1.6 STAKEHOLDERS
1.7 SUMMARY OF CHANGES
2 RESEARCH METHODOLOGY (Page No. - 35)
2.1 RESEARCH DATA
2.2 RESEARCH APPROACH
FIGURE 3 OPTOMETRY EQUIPMENT MARKET: RESEARCH DESIGN METHODOLOGY
2.2.1 SECONDARY DATA
2.2.1.1 Key data from secondary sources
2.2.2 PRIMARY DATA
2.2.2.1 Primary sources
2.2.2.2 Key data from primary sources
2.2.2.3 Key industry insights
2.2.2.4 Breakdown of primary interviews
FIGURE 4 BREAKDOWN OF PRIMARY INTERVIEWS: SUPPLY-SIDE AND DEMAND-SIDE PARTICIPANTS
FIGURE 5 BREAKDOWN OF PRIMARY INTERVIEWS: BY COMPANY TYPE, DESIGNATION, AND REGION
2.3 MARKET SIZE ESTIMATION
2.3.1 BOTTOM-UP APPROACH
2.3.1.1 Approach 1: Company revenue estimation approach
FIGURE 6 BOTTOM-UP APPROACH: COMPANY REVENUE ESTIMATION APPROACH
2.3.1.2 Approach 2: Presentations of companies and primary interviews
2.3.1.3 Growth forecast
2.3.1.4 CAGR projections
FIGURE 7 CAGR PROJECTIONS: SUPPLY-SIDE ANALYSIS
2.3.2 TOP-DOWN APPROACH
FIGURE 8 GLOBAL MARKET: TOP-DOWN APPROACH
2.4 MARKET BREAKDOWN AND DATA TRIANGULATION
FIGURE 9 DATA TRIANGULATION METHODOLOGY
2.5 MARKET SHARE
2.6 ASSUMPTIONS
2.7 LIMITATIONS
2.8 RISK ASSESSMENT
2.9 GROWTH RATE ASSUMPTIONS
3 EXECUTIVE SUMMARY (Page No. - 47)
FIGURE 10 OPTOMETRY EQUIPMENT MARKET, BY TYPE, 2022 VS. 2027 (USD MILLION)
FIGURE 11 GLOBAL OPTOMETRY EQUIPMENT INDUSTRY, BY APPLICATION, 2022 VS. 2027 (USD MILLION)
FIGURE 12 GLOBAL OPTOMETRY EQUIPMENT INDUSTRY, BY END USER, 2022 VS. 2027 (USD MILLION)
FIGURE 13 GLOBAL OPTOMETRY EQUIPMENT INDUSTRY, BY REGION, 2022 VS. 2027 (USD MILLION)
4 PREMIUM INSIGHTS (Page No. - 50)
4.1 OPTOMETRY EQUIPMENT MARKET OVERVIEW
FIGURE 14 INCREASING INCIDENCE OF EYE DISORDERS AND RISING TECHNOLOGICAL ADVANCEMENTS IN OPHTHALMIC DEVICES DRIVE MARKET GROWTH
4.2 GLOBAL MARKET SHARE, BY TYPE, 2022 VS. 2027
FIGURE 15 RETINA & GLAUCOMA EXAMINATION PRODUCTS SEGMENT TO DOMINATE MARKET DURING FORECAST PERIOD
4.3 GLOBAL MARKET SHARE, BY APPLICATION, 2022 VS. 2027
FIGURE 16 GENERAL EXAMINATION SEGMENT TO DOMINATE MARKET DURING FORECAST PERIOD
4.4 GLOBAL MARKET SHARE, BY END USER, 2022 VS. 2027
FIGURE 17 CLINICS SEGMENT TO DOMINATE MARKET DURING FORECAST PERIOD
4.5 GLOBAL MARKET: GEOGRAPHIC GROWTH OPPORTUNITIES
FIGURE 18 ASIA PACIFIC TO REGISTER HIGHEST GROWTH RATE DURING FORECAST PERIOD
5 MARKET OVERVIEW (Page No. - 53)
5.1 INTRODUCTION
5.2 MARKET DYNAMICS
FIGURE 19 OPTOMETRY EQUIPMENT MARKET: DRIVERS, RESTRAINTS, OPPORTUNITIES, AND CHALLENGES
5.2.1 DRIVERS
5.2.1.1 Increasing incidence of eye disorders
5.2.1.2 Technological advancements in ophthalmic devices
5.2.1.3 Rising government initiatives to control visual impairment
5.2.1.4 Increasing healthcare expenditure
5.2.2 RESTRAINTS
5.2.2.1 High cost of optometry equipment
5.2.2.2 Growing adoption of refurbished optometry equipment
5.2.3 OPPORTUNITIES
5.2.3.1 Emerging markets
5.2.4 CHALLENGES
5.2.4.1 Low awareness & limited accessibility to eye care in low-income economies
5.3 PRICING ANALYSIS
5.3.1 INDICATIVE PRICING MODEL ANALYSIS
TABLE 1 AVERAGE SELLING PRICE OF OPTOMETRY EQUIPMENT PRODUCTS (2022)
5.4 PATENT ANALYSIS
FIGURE 20 PATENT ANALYSIS FOR OPTOMETRY EQUIPMENT DEVICES
5.4.1 LIST OF KEY PATENTS
5.5 VALUE CHAIN ANALYSIS
FIGURE 21 VALUE CHAIN ANALYSIS: MAJOR VALUE ADDED DURING MANUFACTURING AND DISTRIBUTION PHASES
5.6 SUPPLY CHAIN ANALYSIS
FIGURE 22 GLOBAL MARKET: SUPPLY-CHAIN ANALYSIS
5.7 ECOSYSTEM MAP ANALYSIS
FIGURE 23 GLOBAL MARKET: ECOSYSTEM MAP
5.7.1 GLOBAL MARKET: ROLE IN ECOSYSTEM
5.8 PORTER’S FIVE FORCES ANALYSIS
TABLE 2 GLOBAL MARKET: PORTER’S FIVE FORCES ANALYSIS
5.8.1 THREAT OF NEW ENTRANTS
5.8.2 THREAT OF SUBSTITUTES
5.8.3 BARGAINING POWER OF BUYERS
5.8.4 BARGAINING POWER OF SUPPLIERS
5.8.5 DEGREE OF COMPETITION
5.9 PESTLE ANALYSIS
5.10 REGULATORY LANDSCAPE
5.10.1 REGULATORY BODIES, GOVERNMENT AGENCIES, AND OTHER ORGANIZATIONS
TABLE 3 NORTH AMERICA: LIST OF REGULATORY BODIES, GOVERNMENT AGENCIES, AND OTHER ORGANIZATIONS
TABLE 4 EUROPE: LIST OF REGULATORY BODIES, GOVERNMENT AGENCIES, AND OTHER ORGANIZATIONS
TABLE 5 ASIA PACIFIC: LIST OF REGULATORY BODIES, GOVERNMENT AGENCIES, AND OTHER ORGANIZATIONS
TABLE 6 LATIN AMERICA: LIST OF REGULATORY BODIES, GOVERNMENT AGENCIES, AND OTHER ORGANIZATIONS
TABLE 7 REST OF THE WORLD: LIST OF REGULATORY BODIES, GOVERNMENT AGENCIES, AND OTHER ORGANIZATIONS
5.10.2 NORTH AMERICA
5.10.2.1 US
5.10.2.2 Canada
5.10.3 EUROPE
5.10.4 ASIA PACIFIC
5.10.4.1 China
5.10.4.2 Japan
5.10.4.3 India
5.10.5 LATIN AMERICA
5.10.5.1 Brazil
5.10.5.2 Mexico
5.10.6 MIDDLE EAST
5.10.7 AFRICA
5.11 TRADE ANALYSIS
5.11.1 TRADE ANALYSIS FOR OPTOMETRY EQUIPMENT PRODUCTS
TABLE 8 IMPORT DATA FOR OPTOMETRY EQUIPMENT PRODUCTS, BY COUNTRY, 2017–2021 (USD MILLION)
TABLE 9 EXPORT DATA FOR OPTOMETRY EQUIPMENT PRODUCTS, BY COUNTRY, 2017–2021 (USD MILLION)
5.12 TECHNOLOGY ANALYSIS
5.13 KEY CONFERENCES AND EVENTS IN 2022–2023
TABLE 10 GLOBAL MARKET: DETAILED LIST OF CONFERENCES AND EVENTS
5.14 TRENDS/DISRUPTIONS IMPACTING CUSTOMERS’ BUSINESSES
5.14.1 REVENUE SOURCES TO SHIFT TOWARD TECHNOLOGICALLY ADVANCED OPTOMETRY EQUIPMENT DUE TO COVID-19
FIGURE 24 REVENUE SHIFT IN GLOBAL MARKET
5.15 KEY STAKEHOLDERS AND BUYING CRITERIA
5.15.1 KEY STAKEHOLDERS IN BUYING PROCESS
FIGURE 25 INFLUENCE OF STAKEHOLDERS IN BUYING PROCESS OF OPTOMETRY EQUIPMENT PRODUCTS
TABLE 11 INFLUENCE OF STAKEHOLDERS IN BUYING PROCESS OF OPTOMETRY EQUIPMENT PRODUCTS
5.15.2 BUYING CRITERIA
FIGURE 26 KEY BUYING CRITERIA FOR OPTOMETRY EQUIPMENT PRODUCTS
TABLE 12 KEY BUYING CRITERIA FOR OPTOMETRY EQUIPMENT PRODUCTS
5.16 CASE STUDIES
6 OPTOMETRY EQUIPMENT MARKET, BY TYPE (Page No. - 79)
6.1 INTRODUCTION
TABLE 13 GLOBAL OPTOMETRY EQUIPMENT INDUSTRY, BY TYPE, 2020–2027 (USD MILLION)
6.2 RETINA & GLAUCOMA EXAMINATION PRODUCTS
TABLE 14 KEY PRODUCTS AVAILABLE FOR RETINA & GLAUCOMA EXAMINATION
TABLE 15 RETINA & GLAUCOMA EXAMINATION PRODUCTS MARKET, BY TYPE, 2020–2027 (USD MILLION)
TABLE 16 RETINA & GLAUCOMA EXAMINATION PRODUCTS MARKET, BY REGION, 2020–2027 (USD MILLION)
6.2.1 OCT SCANNERS
6.2.1.1 OCT scanners provide high-depth image analysis in real-time
TABLE 17 OCT SCANNERS MARKET, BY REGION, 2020–2027 (USD MILLION)
6.2.2 FUNDUS CAMERAS
6.2.2.1 Rising prevalence of age-related disorders leading to fundus damage drives growth
TABLE 18 FUNDUS CAMERAS MARKET, BY REGION, 2020–2027 (USD MILLION)
6.2.3 PERIMETERS/VISUAL FIELD ANALYZERS
6.2.3.1 Growing incidence of glaucoma and AMD drive demand for perimeters
TABLE 19 PERIMETERS/VISUAL FIELD ANALYZERS MARKET, BY REGION, 2020–2027 (USD MILLION)
6.2.4 OPHTHALMOSCOPES
6.2.4.1 Rising technological advancements to drive growth of this segment
TABLE 20 OPHTHALMOSCOPES MARKET, BY REGION, 2020–2027 (USD MILLION)
6.2.5 RETINOSCOPES
6.2.5.1 Rising prevalence of myopia worldwide boosts adoption of retinoscopes
TABLE 21 RETINOSCOPES MARKET, BY REGION, 2020–2027 (USD MILLION)
6.3 GENERAL EXAMINATION PRODUCTS
TABLE 22 KEY PRODUCTS AVAILABLE FOR GENERAL EXAMINATION
TABLE 23 GENERAL EXAMINATION PRODUCTS MARKET, BY TYPE, 2020–2027 (USD MILLION)
TABLE 24 GENERAL EXAMINATION PRODUCTS MARKET, BY REGION, 2020–2027 (USD MILLION)
6.3.1 AUTOREFRACTORS AND KERATOMETERS
6.3.1.1 Autorefractors and keratometers are useful diagnostic tools to screen contact lens complications
TABLE 25 AUTOREFRACTORS AND KERATOMETERS MARKET, BY REGION, 2020–2027 (USD MILLION)
6.3.2 OPHTHALMIC ULTRASOUND SYSTEMS
6.3.2.1 Growing demand for advanced ophthalmic imaging technologies to drive segment growth
TABLE 26 OPHTHALMIC ULTRASOUND SYSTEMS MARKET, BY REGION, 2020–2027 (USD MILLION)
6.3.3 TONOMETERS
6.3.3.1 Tonometry is principally used to test for glaucoma
TABLE 27 TONOMETERS MARKET, BY REGION, 2020–2027 (USD MILLION)
6.3.4 SLIT LAMPS
6.3.4.1 Slit lamps are used to treat a diverse range of ocular conditions
TABLE 28 SLIT LAMPS MARKET, BY REGION, 2020–2027 (USD MILLION)
6.3.5 LENSMETERS
6.3.5.1 Rising prevalence of myopia & hyperopia drive market growth for lensmeters
TABLE 29 LENSMETERS MARKET, BY REGION, 2020–2027 (USD MILLION)
6.3.6 CHART PROJECTORS
6.3.6.1 Eye chart projectors give practitioners access to different chart types in one device
TABLE 30 CHART PROJECTORS MARKET, BY REGION, 2020–2027 (USD MILLION)
6.4 CORNEA & CATARACT EXAMINATION PRODUCTS
TABLE 31 KEY PRODUCTS AVAILABLE FOR CORNEA & CATARACT EXAMINATION
TABLE 32 CORNEA & CATARACT EXAMINATION PRODUCTS MARKET, BY TYPE, 2020–2027 (USD MILLION)
TABLE 33 CORNEA & CATARACT EXAMINATION PRODUCTS MARKET, BY REGION, 2020–2027 (USD MILLION)
6.4.1 WAVEFRONT ABERROMETERS/ANALYZERS
6.4.1.1 Aberrometers are highly effective in measuring refractive aberrations
TABLE 34 WAVEFRONT ABERROMETERS/ANALYZERS MARKET, BY REGION, 2020–2027 (USD MILLION)
6.4.2 OPTICAL BIOMETRY SYSTEMS
6.4.2.1 Advantages of optical biometry systems have boosted their adoption in diagnostics
TABLE 35 OPTICAL BIOMETRY SYSTEMS MARKET, BY REGION, 2020–2027 (USD MILLION)
6.4.3 CORNEAL TOPOGRAPHICAL SYSTEMS
6.4.3.1 Increasing number of LASIK procedures has driven demand for corneal topography systems
TABLE 36 CORNEAL TOPOGRAPHICAL SYSTEMS MARKET, BY REGION, 2020–2027 (USD MILLION)
6.4.4 SPECULAR MICROSCOPES
6.4.4.1 Rising cases of diabetic retinopathy to support market growth
TABLE 37 SPECULAR MICROSCOPES MARKET, BY REGION, 2020–2027 (USD MILLION)
7 OPTOMETRY EQUIPMENT MARKET, BY APPLICATION (Page No. - 100)
7.1 INTRODUCTION
TABLE 38 GLOBAL OPTOMETRY EQUIPMENT INDUSTRY, BY APPLICATION, 2020–2027 (USD MILLION)
7.2 GENERAL EXAMINATION
7.2.1 RISING PREVALENCE OF EYE DISORDERS BOOSTS SEGMENT GROWTH
TABLE 39 GLOBAL MARKET FOR GENERAL EXAMINATION, BY REGION, 2020–2027 (USD MILLION)
7.3 CATARACTS
7.3.1 RISING INCIDENCE OF CATARACTS SUPPORTS SEGMENT GROWTH
TABLE 40 GLOBAL MARKET FOR CATARACTS, BY REGION, 2020–2027 (USD MILLION)
7.4 GLAUCOMA
7.4.1 INCREASED INTRAOCULAR PRESSURE DUE TO STRESS SUPPORTS MARKET GROWTH
TABLE 41 GLOBAL MARKET FOR GLAUCOMA, BY REGION, 2020–2027 (USD MILLION)
7.5 AGE-RELATED MACULAR DEGENERATION
7.5.1 ELDERLY PEOPLE ARE MORE SUSCEPTIBLE TO MACULAR DEGENERATION- A KEY FACTOR DRIVING SEGMENT GROWTH
TABLE 42 GLOBAL MARKET FOR AGE-RELATED MACULAR DEGENERATION, BY REGION, 2020–2027 (USD MILLION)
7.6 OTHER APPLICATIONS
TABLE 43 GLOBAL MARKET FOR OTHER APPLICATIONS, BY REGION, 2020–2027 (USD MILLION)
8 OPTOMETRY EQUIPMENT MARKET, BY END USER (Page No. - 106)
8.1 INTRODUCTION
TABLE 44 GLOBAL OPTOMETRY EQUIPMENT INDUSTRY, BY END USER, 2020–2027 (USD MILLION)
8.2 CLINICS
8.2.1 CLINICS TO DOMINATE END-USER MARKET DURING FORECAST PERIOD
TABLE 45 GLOBAL MARKET FOR CLINICS, BY REGION, 2020–2027 (USD MILLION)
8.3 HOSPITALS
8.3.1 HIGH PURCHASING POWER OF HOSPITALS TO BUY ADVANCED INSTRUMENTS DRIVES GROWTH
TABLE 46 GLOBAL MARKET FOR HOSPITALS, BY REGION, 2020–2027 (USD MILLION)
8.4 OTHER END USERS
TABLE 47 GLOBAL MARKET FOR OTHER END USERS, BY REGION, 2020–2027 (USD MILLION)
9 OPTOMETRY EQUIPMENT MARKET, BY SPECIALTY (Page No. - 110)
9.1 INTRODUCTION
FIGURE 27 GLOBAL OPTOMETRY EQUIPMENT INDUSTRY, BY SPECIALTY TYPE (2021)
9.2 OPHTHALMOLOGISTS
9.3 OPTOMETRISTS
9.4 OPTICIANS
10 OPTOMETRY EQUIPMENT MARKET, BY REGION (Page No. - 112)
10.1 INTRODUCTION
TABLE 48 GLOBAL MARKET, BY REGION, 2020–2027 (USD MILLION)
10.2 NORTH AMERICA
FIGURE 28 NORTH AMERICA: OPTOMETRY EQUIPMENT MARKET SNAPSHOT
TABLE 49 NORTH AMERICA: MARKET, BY COUNTRY, 2020–2027 (USD MILLION)
TABLE 50 NORTH AMERICA: MARKET, BY TYPE, 2020–2027 (USD MILLION)
TABLE 51 NORTH AMERICA: MARKET FOR RETINA AND GLAUCOMA EXAMINATION PRODUCTS, BY TYPE, 2020–2027 (USD MILLION)
TABLE 52 NORTH AMERICA: MARKET FOR GENERAL EXAMINATION PRODUCTS, BY TYPE, 2020–2027 (USD MILLION)
TABLE 53 NORTH AMERICA: MARKET FOR CORNEA AND CATARACT EXAMINATION PRODUCTS, BY TYPE, 2020–2027 (USD MILLION)
TABLE 54 NORTH AMERICA: MARKET, BY APPLICATION, 2020–2027 (USD MILLION)
TABLE 55 NORTH AMERICA: MARKET, BY END USER, 2020–2027 (USD MILLION)
10.2.1 US
10.2.1.1 Rising geriatric population and high healthcare expenditure to drive market growth
TABLE 56 US: MARKET, BY TYPE, 2020–2027 (USD MILLION)
TABLE 57 US: MARKET FOR RETINA AND GLAUCOMA EXAMINATION PRODUCTS, BY TYPE, 2020–2027 (USD MILLION)
TABLE 58 US: MARKET FOR GENERAL EXAMINATION PRODUCTS, BY TYPE, 2020–2027 (USD MILLION)
TABLE 59 US: MARKET FOR CORNEA AND CATARACT EXAMINATION PRODUCTS, BY TYPE, 2020–2027 (USD MILLION)
TABLE 60 US: MARKET, BY APPLICATION, 2020–2027 (USD MILLION)
TABLE 61 US: OPTOMETRY EQUIPMENT INDUSTRY, BY END USER, 2020–2027 (USD MILLION)
10.2.2 CANADA
10.2.2.1 Increasing awareness of eye care and rising incidence of ocular diseases to drive market growth
TABLE 62 CANADA: OPTOMETRY EQUIPMENT MARKET, BY TYPE, 2020–2027 (USD MILLION)
TABLE 63 CANADA: MARKET FOR RETINA AND GLAUCOMA EXAMINATION PRODUCTS, BY TYPE, 2020–2027 (USD MILLION)
TABLE 64 CANADA: MARKET FOR GENERAL EXAMINATION PRODUCTS, BY TYPE, 2020–2027 (USD MILLION)
TABLE 65 CANADA: MARKET FOR CORNEA AND CATARACT EXAMINATION PRODUCTS, BY TYPE, 2020–2027 (USD MILLION)
TABLE 66 CANADA: MARKET, BY APPLICATION, 2020–2027 (USD MILLION)
TABLE 67 CANADA: MARKET, BY END USER, 2020–2027 (USD MILLION)
10.3 EUROPE
TABLE 68 EUROPE: MARKET, BY COUNTRY, 2020–2027 (USD MILLION)
TABLE 69 EUROPE: MARKET, BY TYPE, 2020–2027 (USD MILLION)
TABLE 70 EUROPE: MARKET FOR RETINA AND GLAUCOMA EXAMINATION PRODUCTS, BY TYPE, 2020–2027 (USD MILLION)
TABLE 71 EUROPE: MARKET FOR GENERAL EXAMINATION PRODUCTS, BY TYPE, 2020–2027 (USD MILLION)
TABLE 72 EUROPE: MARKET FOR CORNEA AND CATARACT EXAMINATION PRODUCTS, BY TYPE, 2020–2027 (USD MILLION)
TABLE 73 EUROPE: MARKET, BY APPLICATION, 2020–2027 (USD MILLION)
TABLE 74 EUROPE: OPTOMETRY EQUIPMENT INDUSTRY, BY END USER, 2020–2027 (USD MILLION)
10.3.1 GERMANY
10.3.1.1 Increasing healthcare expenditure in Germany to boost adoption of optometry equipment
TABLE 75 GERMANY: OPTOMETRY EQUIPMENT MARKET, BY TYPE, 2020–2027 (USD MILLION)
TABLE 76 GERMANY: MARKET FOR RETINA AND GLAUCOMA EXAMINATION PRODUCTS, BY TYPE, 2020–2027 (USD MILLION)
TABLE 77 GERMANY: MARKET FOR GENERAL EXAMINATION PRODUCTS, BY TYPE, 2020–2027 (USD MILLION)
TABLE 78 GERMANY: MARKET FOR CORNEA AND CATARACT EXAMINATION PRODUCTS, BY TYPE, 2020–2027 (USD MILLION)
TABLE 79 GERMANY: MARKET, BY APPLICATION, 2020–2027 (USD MILLION)
TABLE 80 GERMANY: MARKET, BY END USER, 2020–2027 (USD MILLION)
10.3.2 UK
10.3.2.1 Rising prevalence of diabetes-related eye diseases to drive market growth
TABLE 81 UK: MARKET, BY TYPE, 2020–2027 (USD MILLION)
TABLE 82 UK: MARKET FOR RETINA AND GLAUCOMA EXAMINATION PRODUCTS, BY TYPE, 2020–2027 (USD MILLION)
TABLE 83 UK: MARKET FOR GENERAL EXAMINATION PRODUCTS, BY TYPE, 2020–2027 (USD MILLION)
TABLE 84 UK: MARKET FOR CORNEA AND CATARACT EXAMINATION PRODUCTS, BY TYPE, 2020–2027 (USD MILLION)
TABLE 85 UK: MARKET, BY APPLICATION, 2020–2027 (USD MILLION)
TABLE 86 UK: OPTOMETRY EQUIPMENT INDUSTRY, BY END USER, 2020–2027 (USD MILLION)
10.3.3 FRANCE
10.3.3.1 Medical tourism in France drives demand for advanced optometry devices
TABLE 87 FRANCE: OPTOMETRY EQUIPMENT MARKET, BY TYPE, 2020–2027 (USD MILLION)
TABLE 88 FRANCE: MARKET FOR RETINA AND GLAUCOMA EXAMINATION PRODUCTS, BY TYPE, 2020–2027 (USD MILLION)
TABLE 89 FRANCE: MARKET FOR GENERAL EXAMINATION PRODUCTS, BY TYPE, 2020–2027 (USD MILLION)
TABLE 90 FRANCE: MARKET FOR CORNEA AND CATARACT EXAMINATION PRODUCTS, BY TYPE, 2020–2027 (USD MILLION)
TABLE 91 FRANCE: MARKET, BY APPLICATION, 2020–2027 (USD MILLION)
TABLE 92 FRANCE: MARKET, BY END USER, 2020–2027 (USD MILLION)
10.3.4 ITALY
10.3.4.1 Rising prevalence of eye diseases to drive market growth
TABLE 93 ITALY: MARKET, BY TYPE, 2020–2027 (USD MILLION)
TABLE 94 ITALY: MARKET FOR RETINA AND GLAUCOMA EXAMINATION PRODUCTS, BY TYPE, 2020–2027 (USD MILLION)
TABLE 95 ITALY: MARKET FOR GENERAL EXAMINATION PRODUCTS, BY TYPE, 2020–2027 (USD MILLION)
TABLE 96 ITALY: MARKET FOR CORNEA AND CATARACT EXAMINATION PRODUCTS, BY TYPE, 2020–2027 (USD MILLION)
TABLE 97 ITALY: MARKET, BY APPLICATION, 2020–2027 (USD MILLION)
TABLE 98 ITALY: OPTOMETRY EQUIPMENT INDUSTRY, BY END USER, 2020–2027 (USD MILLION)
10.3.5 SPAIN
10.3.5.1 Growing number of ophthalmic surgical procedures to drive market growth
TABLE 99 SPAIN: OPTOMETRY EQUIPMENT MARKET, BY TYPE, 2020–2027 (USD MILLION)
TABLE 100 SPAIN: MARKET FOR RETINA AND GLAUCOMA EXAMINATION PRODUCTS, BY TYPE, 2020–2027 (USD MILLION)
TABLE 101 SPAIN: MARKET FOR GENERAL EXAMINATION PRODUCTS, BY TYPE, 2020–2027 (USD MILLION)
TABLE 102 SPAIN: MARKET FOR CORNEA AND CATARACT EXAMINATION PRODUCTS, BY TYPE, 2020–2027 (USD MILLION)
TABLE 103 SPAIN: MARKET, BY APPLICATION, 2020–2027 (USD MILLION)
TABLE 104 SPAIN: MARKET, BY END USER, 2020–2027 (USD MILLION)
10.3.6 REST OF EUROPE
TABLE 105 ROE: MARKET, BY TYPE, 2020–2027 (USD MILLION)
TABLE 106 ROE: MARKET FOR RETINA AND GLAUCOMA EXAMINATION PRODUCTS, BY TYPE, 2020–2027 (USD MILLION)
TABLE 107 ROE: MARKET FOR GENERAL EXAMINATION PRODUCTS, BY TYPE, 2020–2027 (USD MILLION)
TABLE 108 ROE: MARKET FOR CORNEA AND CATARACT EXAMINATION PRODUCTS, BY TYPE, 2020–2027 (USD MILLION)
TABLE 109 ROE: MARKET, BY APPLICATION, 2020–2027 (USD MILLION)
TABLE 110 ROE: OPTOMETRY EQUIPMENT INDUSTRY, BY END USER, 2020–2027 (USD MILLION)
10.4 ASIA PACIFIC
FIGURE 29 ASIA PACIFIC: OPTOMETRY EQUIPMENT MARKET SNAPSHOT
TABLE 111 ASIA PACIFIC: MARKET, BY COUNTRY, 2020–2027 (USD MILLION)
TABLE 112 ASIA PACIFIC: MARKET, BY TYPE, 2020–2027 (USD MILLION)
TABLE 113 ASIA PACIFIC: MARKET FOR RETINA AND GLAUCOMA EXAMINATION PRODUCTS, BY TYPE, 2020–2027 (USD MILLION)
TABLE 114 ASIA PACIFIC: MARKET FOR GENERAL EXAMINATION PRODUCTS, BY TYPE, 2020–2027 (USD MILLION)
TABLE 115 ASIA PACIFIC: MARKET FOR CORNEA AND CATARACT EXAMINATION PRODUCTS, BY TYPE, 2020–2027 (USD MILLION)
TABLE 116 ASIA PACIFIC: MARKET, BY APPLICATION, 2020–2027 (USD MILLION)
TABLE 117 ASIA PACIFIC: MARKET, BY END USER, 2020–2027 (USD MILLION)
10.4.1 CHINA
10.4.1.1 Rising prevalence of cataracts and blindness to drive adoption of optometry equipment
TABLE 118 CHINA: MARKET, BY TYPE, 2020–2027 (USD MILLION)
TABLE 119 CHINA: MARKET FOR RETINA AND GLAUCOMA EXAMINATION PRODUCTS, BY TYPE, 2020–2027 (USD MILLION)
TABLE 120 CHINA: MARKET FOR GENERAL EXAMINATION PRODUCTS, BY TYPE, 2020–2027 (USD MILLION)
TABLE 121 CHINA: MARKET FOR CORNEA AND CATARACT EXAMINATION PRODUCTS, BY TYPE, 2020–2027 (USD MILLION)
TABLE 122 CHINA: MARKET, BY APPLICATION, 2020–2027 (USD MILLION)
TABLE 123 CHINA: OPTOMETRY EQUIPMENT INDUSTRY, BY END USER, 2020–2027 (USD MILLION)
10.4.2 JAPAN
10.4.2.1 Presence of key ophthalmic manufacturers to drive market growth in Japan
TABLE 124 JAPAN: OPTOMETRY EQUIPMENT MARKET, BY TYPE, 2020–2027 (USD MILLION)
TABLE 125 JAPAN: MARKET FOR RETINA AND GLAUCOMA EXAMINATION PRODUCTS, BY TYPE, 2020–2027 (USD MILLION)
TABLE 126 JAPAN: MARKET FOR GENERAL EXAMINATION PRODUCTS, BY TYPE, 2020–2027 (USD MILLION)
TABLE 127 JAPAN: MARKET FOR CORNEA AND CATARACT EXAMINATION PRODUCTS, BY TYPE, 2020–2027 (USD MILLION)
TABLE 128 JAPAN: MARKET, BY APPLICATION, 2020–2027 (USD MILLION)
TABLE 129 JAPAN: MARKET, BY END USER, 2020–2027 (USD MILLION)
10.4.3 INDIA
10.4.3.1 Rising aging population and increasing prevalence of eye disorders to support market growth
TABLE 130 INDIA: MARKET, BY TYPE, 2020–2027 (USD MILLION)
TABLE 131 INDIA: MARKET FOR RETINA AND GLAUCOMA EXAMINATION PRODUCTS, BY TYPE, 2020–2027 (USD MILLION)
TABLE 132 INDIA: MARKET FOR GENERAL EXAMINATION PRODUCTS, BY TYPE, 2020–2027 (USD MILLION)
TABLE 133 INDIA: MARKET FOR CORNEA AND CATARACT EXAMINATION PRODUCTS, BY TYPE, 2020–2027 (USD MILLION)
TABLE 134 INDIA: MARKET, BY APPLICATION, 2020–2027 (USD MILLION)
TABLE 135 INDIA: OPTOMETRY EQUIPMENT INDUSTRY, BY END USER, 2020–2027 (USD MILLION)
10.4.4 REST OF ASIA PACIFIC
TABLE 136 ROAPAC: OPTOMETRY EQUIPMENT MARKET, BY TYPE, 2020–2027 (USD MILLION)
TABLE 137 ROAPAC: MARKET FOR RETINA AND GLAUCOMA EXAMINATION PRODUCTS, BY TYPE, 2020–2027 (USD MILLION)
TABLE 138 ROAPAC: MARKET FOR GENERAL EXAMINATION PRODUCTS, BY TYPE, 2020–2027 (USD MILLION)
TABLE 139 ROAPAC: MARKET FOR CORNEA AND CATARACT EXAMINATION PRODUCTS, BY TYPE, 2020–2027 (USD MILLION)
TABLE 140 ROAPAC: MARKET, BY APPLICATION, 2020–2027 (USD MILLION)
TABLE 141 ROAPAC: MARKET, BY END USER, 2020–2027 (USD MILLION)
10.5 LATIN AMERICA
10.5.1 GROWING GOVERNMENT INITIATIVES AWARENESS TO SUPPORT MARKET GROWTH
TABLE 142 LATAM: MARKET, BY TYPE, 2020–2027 (USD MILLION)
TABLE 143 LATAM: MARKET FOR RETINA AND GLAUCOMA EXAMINATION PRODUCTS, BY TYPE, 2020–2027 (USD MILLION)
TABLE 144 LATAM: MARKET FOR GENERAL EXAMINATION PRODUCTS, BY TYPE, 2020–2027 (USD MILLION)
TABLE 145 LATAM: MARKET FOR CORNEA AND CATARACT EXAMINATION PRODUCTS, BY TYPE, 2020–2027 (USD MILLION)
TABLE 146 LATAM: MARKET, BY APPLICATION, 2020–2027 (USD MILLION)
TABLE 147 LATAM: OPTOMETRY EQUIPMENT INDUSTRY, BY END USER, 2020–2027 (USD MILLION)
10.6 MIDDLE EAST AND AFRICA
10.6.1 IMPROVING HEALTHCARE EXPENDITURE TO DRIVE MARKET GROWTH
TABLE 148 MIDDLE EAST & AFRICA: OPTOMETRY EQUIPMENT MARKET, BY TYPE, 2020–2027 (USD MILLION)
TABLE 149 MIDDLE EAST & AFRICA: MARKET FOR RETINA AND GLAUCOMA EXAMINATION PRODUCTS, BY TYPE, 2020–2027 (USD MILLION)
TABLE 150 MIDDLE EAST & AFRICA: MARKET FOR GENERAL EXAMINATION PRODUCTS, BY TYPE, 2020–2027 (USD MILLION)
TABLE 151 MIDDLE EAST & AFRICA: MARKET FOR CORNEA AND CATARACT EXAMINATION PRODUCTS, BY TYPE, 2020–2027 (USD MILLION)
TABLE 152 MIDDLE EAST & AFRICA: MARKET, BY APPLICATION, 2020–2027 (USD MILLION)
TABLE 153 MIDDLE EAST & AFRICA: MARKET, BY END USER, 2020–2027 (USD MILLION)
11 COMPETITIVE LANDSCAPE (Page No. - 168)
11.1 OVERVIEW
11.2 KEY PLAYER STRATEGIES/RIGHT TO WIN
11.2.1 OVERVIEW OF STRATEGIES DEPLOYED BY PLAYERS IN OPTOMETRY EQUIPMENT MARKET
TABLE 154 OVERVIEW OF STRATEGIES DEPLOYED BY KEY OPTOMETRY EQUIPMENT MANUFACTURING COMPANIES
11.3 REVENUE SHARE ANALYSIS OF TOP MARKET PLAYERS
FIGURE 30 REVENUE SHARE ANALYSIS OF TOP PLAYERS IN GLOBAL MARKET
11.4 MARKET SHARE ANALYSIS
11.4.1 GLOBAL OPTOMETRY EQUIPMENT INDUSTRY
FIGURE 31 GLOBAL MARKET SHARE, BY KEY PLAYER (2021)
TABLE 155 GLOBAL MARKET: DEGREE OF COMPETITION
11.5 COMPANY EVALUATION QUADRANT
11.5.1 LIST OF EVALUATED VENDORS
11.5.2 STARS
11.5.3 EMERGING LEADERS
11.5.4 PERVASIVE PLAYERS
11.5.5 PARTICIPANTS
FIGURE 32 COMPANY EVALUATION QUADRANT, 2021
11.6 COMPETITIVE LEADERSHIP MAPPING FOR START-UPS/ SMES (2021)
11.6.1 PROGRESSIVE COMPANIES
11.6.2 STARTING BLOCKS
11.6.3 RESPONSIVE COMPANIES
11.6.4 DYNAMIC COMPANIES
FIGURE 33 GLOBAL MARKET: COMPETITIVE LEADERSHIP MAPPING FOR START-UPS/SMES, 2021
11.7 COMPETITIVE BENCHMARKING
11.7.1 PRODUCT AND GEOGRAPHIC FOOTPRINT ANALYSIS
FIGURE 34 PRODUCT AND GEOGRAPHIC FOOTPRINT ANALYSIS OF TOP PLAYERS
TABLE 156 GLOBAL MARKET: COMPETITIVE BENCHMARKING OF KEY PLAYERS
TABLE 157 COMPANY PRODUCT & SERVICE FOOTPRINT
TABLE 158 COMPANY REGIONAL FOOTPRINT
TABLE 159 OPTOMETRY EQUIPMENT MARKET: DETAILED LIST OF KEY START-UPS/SMES
11.8 COMPETITIVE SCENARIO
11.8.1 PRODUCT LAUNCHES
TABLE 160 KEY PRODUCT LAUNCHES
TABLE 161 DEALS
12 COMPANY PROFILES (Page No. - 179)
12.1 KEY PLAYERS
(Business Overview, Products Offered, Recent Developments, and MnM View (Key strengths/Right to Win, Strategic Choices Made, and Weaknesses and Competitive Threats))*
12.1.1 CARL ZEISS MEDITEC AG
TABLE 162 CARL ZEISS MEDITEC AG: BUSINESS OVERVIEW
FIGURE 35 CARL ZEISS MEDITEC AG: COMPANY SNAPSHOT (2021)
12.1.2 ALCON
TABLE 163 ALCON: BUSINESS OVERVIEW
FIGURE 36 ALCON: COMPANY SNAPSHOT (2021)
12.1.3 ESSILORLUXOTTICA
TABLE 164 ESSILORLUXOTTICA SA: BUSINESS OVERVIEW
FIGURE 37 ESSILORLUXOTTICA SA: COMPANY SNAPSHOT (2021)
12.1.4 TOPCON CORPORATION
TABLE 165 TOPCON CORPORATION: BUSINESS OVERVIEW
FIGURE 38 TOPCON CORPORATION: COMPANY SNAPSHOT (2021)
12.1.5 BAUSCH HEALTH COMPANIES INC.
TABLE 166 BAUSCH HEALTH COMPANIES INC: BUSINESS OVERVIEW
FIGURE 39 BAUSCH HEALTH COMPANIES INC: COMPANY SNAPSHOT (2021)
12.1.6 NIDEK CO. LTD.
TABLE 167 NIDEK CO. LTD: BUSINESS OVERVIEW
12.1.7 CANON INC.
TABLE 168 CANON INC: BUSINESS OVERVIEW
FIGURE 40 CANON INC.: COMPANY SNAPSHOT (2021)
12.1.8 JOHNSON & JOHNSON
TABLE 169 JOHNSON & JOHNSON: BUSINESS OVERVIEW
FIGURE 41 JOHNSON & JOHNSON.: COMPANY SNAPSHOT (2021)
12.1.9 HEINE OPTOTECHNIK
TABLE 170 HEINE OPTOTECHNIK: BUSINESS OVERVIEW
12.1.10 REVENIO GROUP
TABLE 171 REVENIO GROUP.: BUSINESS OVERVIEW
FIGURE 42 REVENIO GROUP: COMPANY SNAPSHOT (2021)
12.1.11 SONOMED ESCALON
TABLE 172 SONOMED ESCALON: BUSINESS OVERVIEW
FIGURE 43 SONOMED ESCALON: COMPANY SNAPSHOT (2021)
12.1.12 HAAG-STREIT GROUP
TABLE 173 HAAG-STREIT GROUP: BUSINESS OVERVIEW
12.1.13 HEIDELBERG ENGINEERING GMBH
TABLE 174 HEIDELBERG ENGINEERING: BUSINESS OVERVIEW
12.2 OTHER PLAYERS
12.2.1 REICHERT TECHNOLOGIES
TABLE 175 REICHERT TECHNOLOGIES.: COMPANY OVERVIEW
12.2.2 KEELER LTD.
TABLE 176 KEELER LTD: COMPANY OVERVIEW
12.2.3 ZIEMER OPHTHALMIC SYSTEMS
TABLE 177 ZIEMER OPHTHALMIC SYSTEMS: COMPANY OVERVIEW
12.2.4 HUVITZ
TABLE 178 HUVITZ: COMPANY OVERVIEW
12.2.5 REXXAM CO. LTD.
TABLE 179 REXXAM CO. LTD: COMPANY OVERVIEW
12.2.6 OCULUS INC.
TABLE 180 OCULUS INC: COMPANY OVERVIEW
12.2.7 KOWA AMERICAN CORPORATION
TABLE 181 KOWA AMERICAN CORPORATION: COMPANY OVERVIEW
12.2.8 RUDOLF RIESTER GMBH
TABLE 182 RUDOLF RIESTER GMBH: COMPANY OVERVIEW
12.2.9 FREY
TABLE 183 FREY: COMPANY OVERVIEW
12.2.10 LUNEAU TECHNOLOGY
TABLE 184 LUNEAU TECHNOLOGY: COMPANY OVERVIEW
12.2.11 YEASN
TABLE 185 YEASN: COMPANY OVERVIEW
12.2.12 NEITZ INSTRUMENTS CO. LTD.
TABLE 186 NEITZ INSTRUMENTS CO. LTD: COMPANY OVERVIEW
*Details on Business Overview, Products Offered, Recent Developments, and MnM View (Key strengths/Right to Win, Strategic Choices Made, and Weaknesses and Competitive Threats) might not be captured in case of unlisted companies.
13 APPENDIX (Page No. - 226)
13.1 DISCUSSION GUIDE
13.2 KNOWLEDGESTORE: MARKETSANDMARKETS’ SUBSCRIPTION PORTAL
13.3 AVAILABLE CUSTOMIZATION OPTIONS
13.4 RELATED REPORTS
13.5 AUTHOR DETAILS
This study involved four major activities in estimating the current size of the optometry equipment market. Exhaustive secondary research was carried out to collect information on the market, its peer markets, and its parent market. The next step was to validate these findings, assumptions, and sizing with industry experts across the value chain through primary research. Both top-down and bottom-up approaches were employed to estimate the complete market size. After that, market breakdown and data triangulation procedures were used to estimate segments and subsegments' market size.
Secondary Research
In the secondary research process, various secondary sources such as annual reports, press releases & investor presentations of companies, white papers, certified publications, articles by recognized authors, gold-standard & silver-standard websites, regulatory bodies, and databases (such as D&B Hoovers, Bloomberg Business, and Factiva) were referred to identify and collect information for this study.
Primary Research
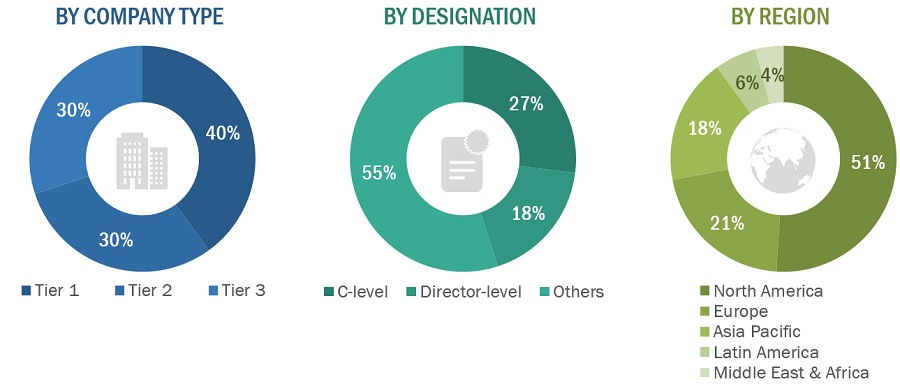
In the primary research process, various sources from both the supply and demand sides were interviewed to obtain qualitative and quantitative information for this report. Primary sources were mainly industry experts from the core and related industries and preferred suppliers, manufacturers, distributors, service providers, technology developers, and organizations related to all segments of this industry’s value chain. In-depth interviews were conducted with various primary respondents, including key industry participants, subject-matter experts, C-level executives of key market players, and industry consultants, to obtain and verify the critical qualitative and quantitative information as well as assess future prospects.
The following is a breakdown of the primary respondents:
To know about the assumptions considered for the study, download the pdf brochure
Market Size Estimation
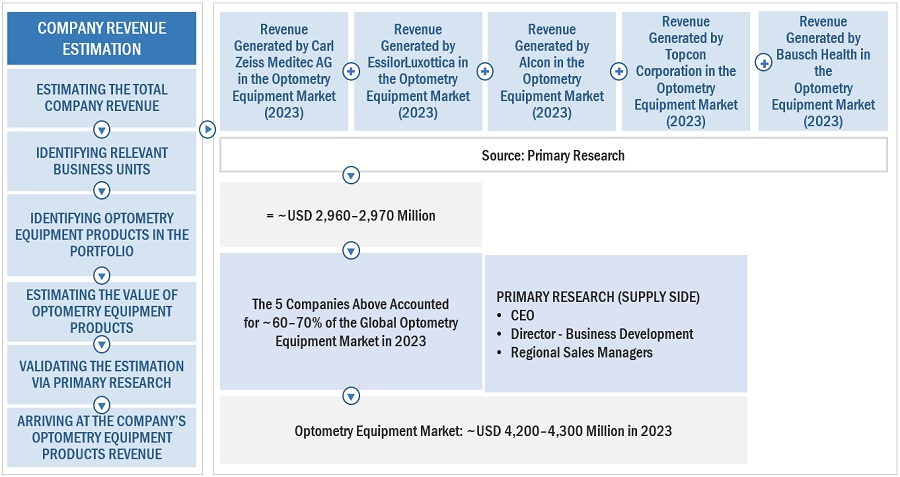
Both top-down and bottom-up approaches were used to estimate and validate the optometry equipment market's total size. These methods were also used extensively to estimate the size of various subsegments in the market. The research methodology used to estimate the market size includes the following:
- The key players in the industry have been identified through extensive secondary research
- The revenues generated by leading players operating in the optometry equipment market have been determined through primary and secondary research
- All percentage shares, splits, and breakdowns have been determined using secondary sources and verified through primary sources
Market Size: Top-Down Approach
To know about the assumptions considered for the study, Request for Free Sample Report
Data Triangulation
After arriving at the overall market size applying the process mentioned above, the total market was split into several segments and subsegments. To complete the overall market engineering process and arrive at the exact statistics for all segments and subsegments, data triangulation and market breakdown procedures were employed, wherever applicable. The data was triangulated by studying various factors and trends from both the demand and supply sides.
Report Objectives
- To define, describe, segment, and forecast the global optometry equipment market, by type, application, end user, and region
- To provide detailed information regarding the major factors influencing the market growth (such as drivers, restraints, opportunities, and challenges)
- To analyze the micromarkets with respect to individual growth trends, prospects, and contributions to the overall optometry equipment market
- To analyze market opportunities for stakeholders and provide details of the competitive landscape for key players
- To forecast the size of the market segments with respect to five regions, namely, North America, Europe, the Asia Pacific, Latin America, and the Middle East & Africa
- To profile the key players and comprehensively analyze their product portfolios, market positions, and core competencies
- To track and analyze company developments such as product launches & approvals, partnerships, acquisitions, agreements, and other developments
- To benchmark players within the market using the proprietary Competitive Leadership Mapping framework, which analyzes market players on various parameters within the broad categories of business and product excellence
Available Customizations
With the given market data, MarketsandMarkets offers customizations as per the company’s specific needs. The following customization options are available for this report:
Country Information
Optometry equipment market size and growth rate estimates for countries in the Rest of Europe, the Rest of Asia Pacific, Latin America, and Middle East & Africa
Company profiles
Additional five company profiles of players operating in the optometry equipment market.
Growth opportunities and latent adjacency in Optometry Equipment Market