Extensive secondary sources, directories, and databases such as Hoovers, Bloomberg BusinessWeek, Factiva, and OneSource have been used to identify and collect information for this technical, market-oriented, and commercial study of the organic peroxide market. In-depth interviews were conducted with various primary respondents, which included key industry participants, subject matter experts (SMEs), C-level executives of key industry players, and industry consultants, among other experts, to obtain and verify critical qualitative and quantitative information and to assess prospects.
Secondary Research
In the secondary research process, various secondary sources have been referred to for identifying and collecting information for this study. Secondary sources included annual reports, press releases, and investor presentations of companies; white papers; publications from recognized websites; and databases. Secondary research has mainly been used to obtain key information about the supply chain of the industry, the total pool of key players, market classification & segmentation according to the industry trends to the bottom-most level, regional markets, and key developments from both market- and technology-oriented perspectives.
The market size of organic peroxide has been estimated based on secondary data available through paid and unpaid sources and by analyzing the product portfolios of key companies. This data has been further validated through various primary sources.
Primary Research
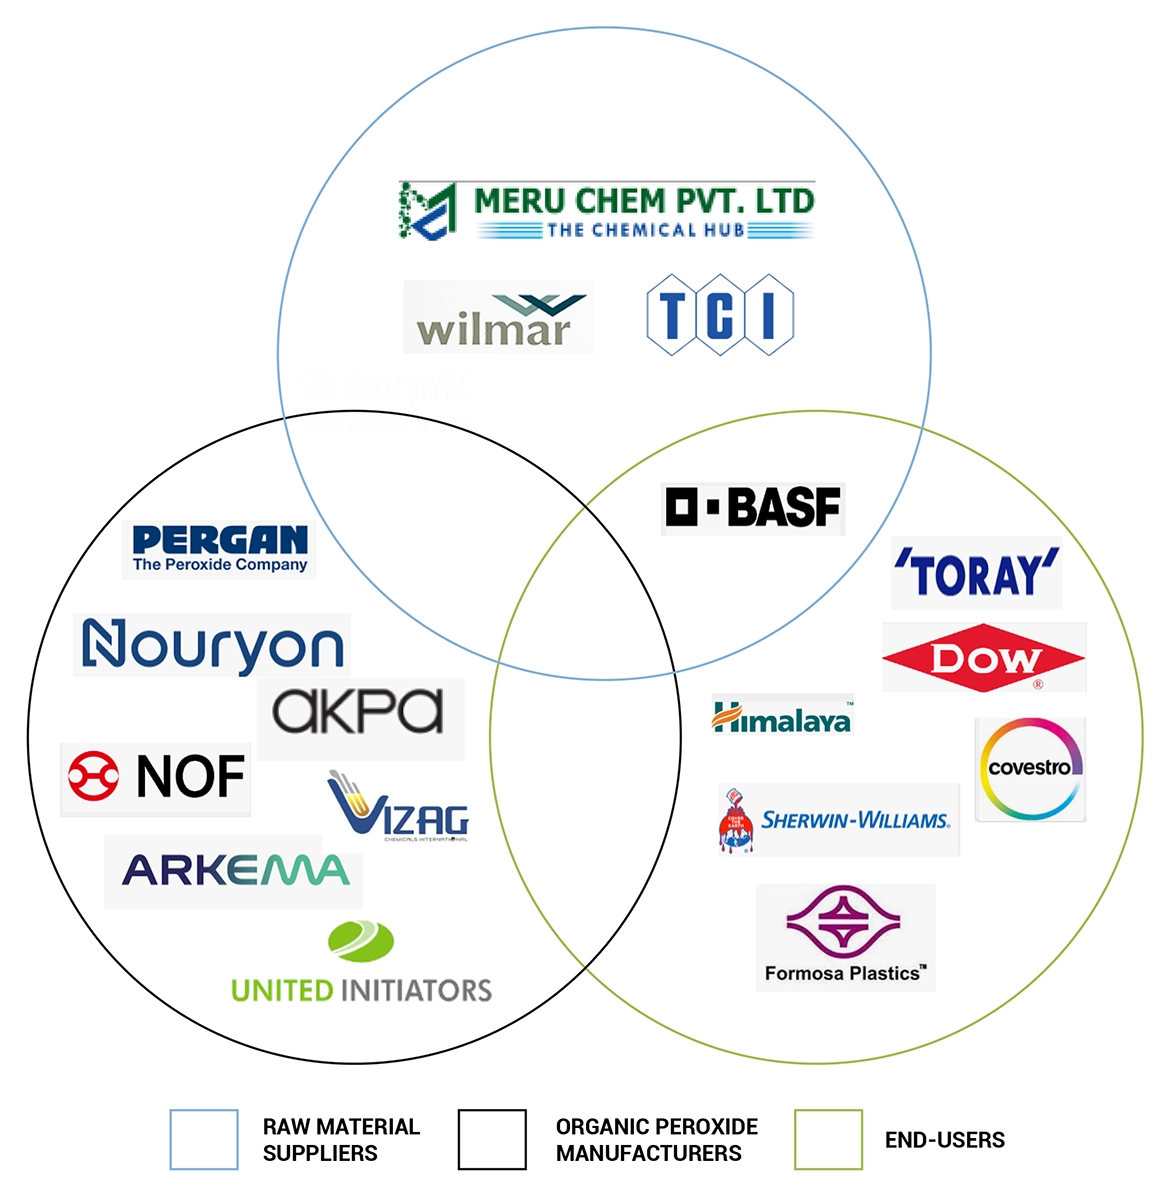
The organic peroxide market comprises various stakeholders in the supply chain and includes suppliers, manufacturers, and end-users. Various primary sources from the supply and demand sides of the organic peroxide market have been interviewed to obtain qualitative and quantitative information. Primary participants from the supply side include key opinion leaders, executives, vice presidents, and CEOs of companies in the market. Primary sources from the demand side include experts from end-use industries, associations and institutions involved in the market, and key opinion leaders.
Following is the breakdown of primary respondents

Notes: *Others include sales, marketing, and product managers.
Tier 1: >USD 5 Billion; Tier 2: USD 1 Billion– USD 5 Billion; and Tier 3: <USD 1 Billion.
To know about the assumptions considered for the study, download the pdf brochure
Market Size Estimation
Both top-down and bottom-up approaches were used to estimate and validate the total size of the global organic peroxide market. These approaches were also used extensively to estimate the size of various dependent sub-segments in the market. The research methodology used to estimate the market size includes the following details:
-
The key players in the industry and markets have been identified through extensive secondary research.
-
The industry’s supply chain and market size, in terms of value, have been determined through primary and secondary research processes.
-
All percentage shares, splits, and breakdowns have been determined using secondary sources and verified through primary sources.
-
All possible parameters that affect the markets covered in this research study have been accounted for, viewed in extensive detail, verified through primary research, and analyzed to obtain the final quantitative and qualitative data.
-
The research included the study of reports, reviews, and newsletters of top market players, along with extensive interviews for opinions from leaders such as directors and marketing executives.
Top-Down Approach

To know about the assumptions considered for the study, Request for Free Sample Report
Bottom-Up Approach

Data Triangulation
After arriving at the overall market size, the total market has been split into several segments. Where applicable, the data triangulation procedure has been employed to complete the market estimation process and arrive at the exact statistics for all segments. The data has been triangulated by studying various factors and trends from both the demand and supply sides. The market size has been validated using both the top-down and bottom-up approaches.
Market Definition
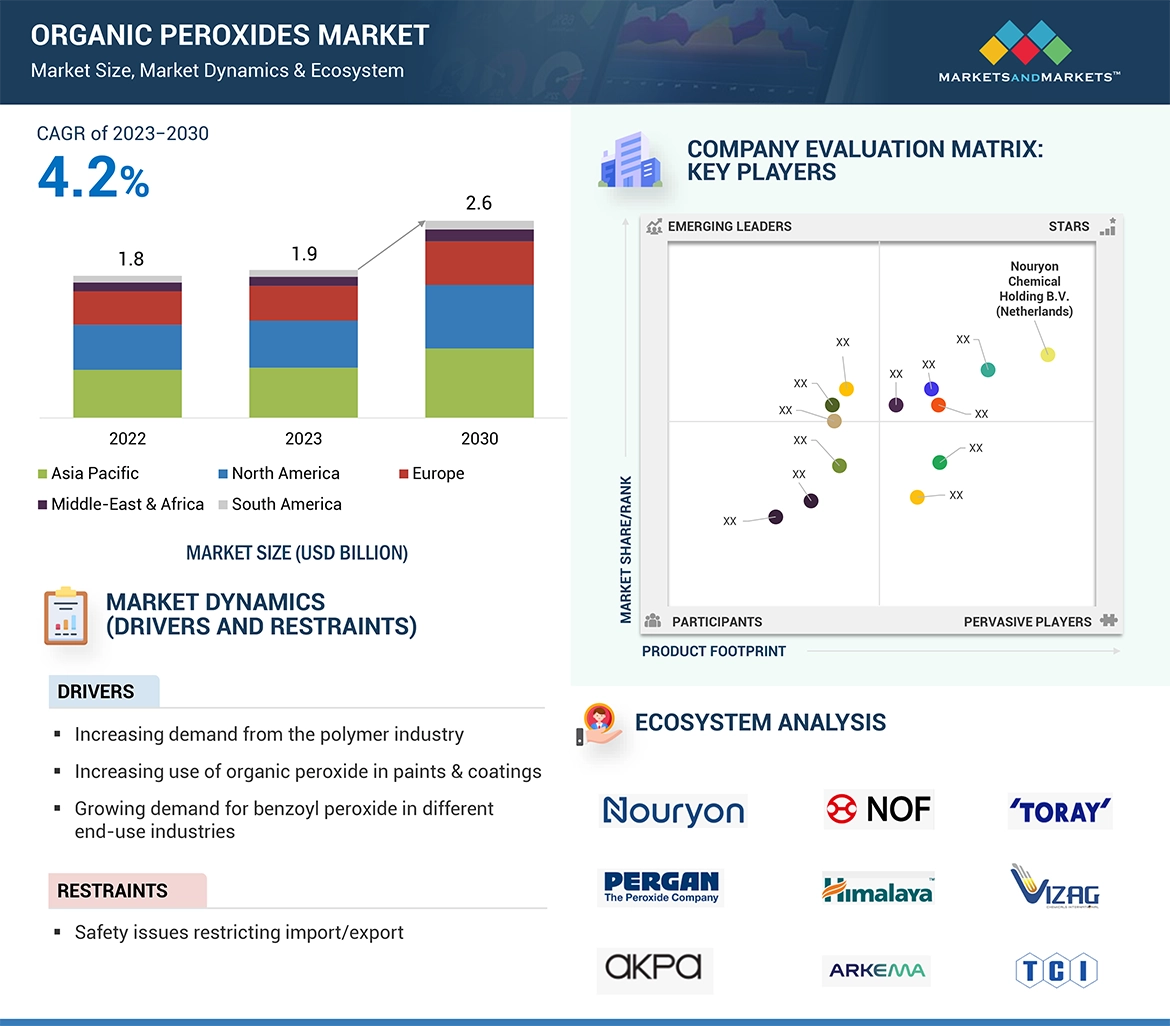
As per The Australian Dangerous Goods Code, Organic peroxide are chemical compound having the bivalent -O-O- structure. These compounds can be considered as derivatives of hydrogen peroxide where one or both hydrogen atoms have been replaced by organic radicals. These substances are thermally unstable, prone to exothermic self-accelerating decomposition. Additionally, they may exhibit hazardous properties, including explosive decomposition, rapid combustion, sensitivity to impact or friction, dangerous reactivity with other substances, and the potential to cause damage to the eyes. Due to these characteristics, careful handling and storage measures are crucial to prevent accidents and ensure safety.
Key stakeholders
-
Raw material suppliers and producers
-
Organic peroxide manufacturers, dealers, and suppliers
-
Regulatory bodies
-
Organic peroxide distributors/suppliers
-
Local government
-
Industry associations
-
Investment banks
-
Consulting companies/Consultants in Organic peroxide Sectors
-
Raw material providers
Report Objectives
-
To estimate and forecast the organic peroxide market, in terms of value and volume
-
To elaborate drivers, restraints, opportunities, and challenges in the market
-
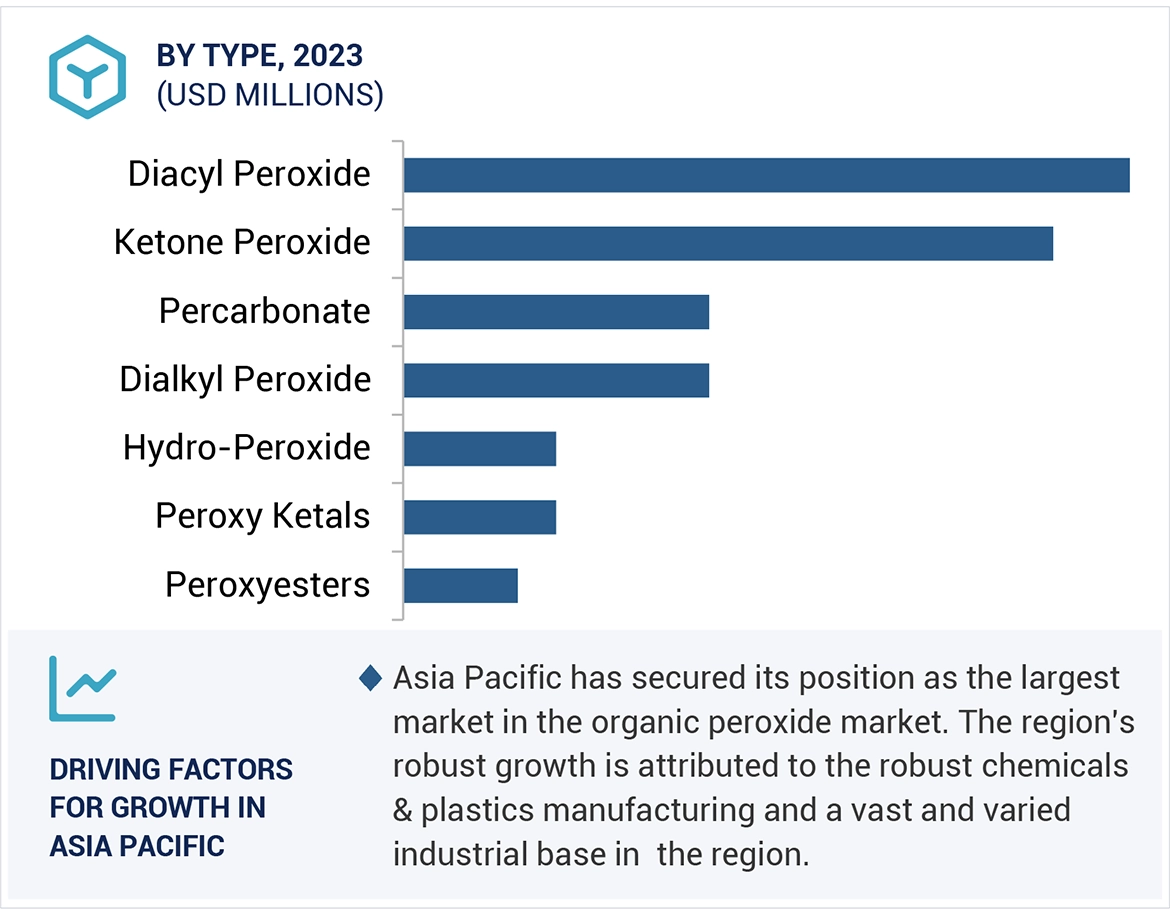
To define, describe, and forecast the market size, based on type, application, and region
-
To forecast the market size along with segments and submarkets, in key regions: North America, Europe, Asia Pacific, Middle East & Africa, and South America with their key countries
-
To analyze growth opportunities in the market for stakeholders and provide details on the competitive landscape for market leaders
-
To strategically profile key players and comprehensively analyze their market shares and core competencies
-
To analyze competitive developments, such as merger & acquisition, expansion & investment, agreement, partnership & joint venture, and new product development in the organic peroxide market
Available Customizations:
Along with the given market data, MarketsandMarkets offers customizations as per the specific needs of the companies. The following customization options are available for the report:
Product Analysis:
-
Product Matrix, which gives a detailed comparison of the product portfolio of each company
Regional Analysis:
-
Further breakdown of the Rest of the Asia Pacific, organic peroxide market
-
Further breakdown of the Rest of Europe, organic peroxide market
-
Further breakdown of the Rest of South America, organic peroxide market
-
Further breakdown of the Rest of Middle East & Africa, organic peroxide market
Company Information:
-
Detailed analysis and profiling of additional market players (up to 5)


HANIEH
Oct, 2015
Require suppliers of raw material for chemical acids and fertiliser to Iran. .
Paul
Feb, 2019
Information on the use in plastics, PE and PP .