Pet Food Packaging Market

Pet Food Packaging Market by Material (Paper & Paperboard, Plastic, Metal), Product (Pouches, Folding Cartons, Metal Cans, Bags), Food (Dry Food, Wet Food, Pet Treats), Animal (Dog, Cat, Fish), and Region - Global Forecast to 2028

Report Code: PK 3474 Nov, 2023, by marketsandmarkets.com

The pet food packaging market is projected to grow from USD 11.1 billion in 2023 to USD 14.9 billion by 2028, at a CAGR of 5.9% during the forecast period. The pet food packaging market is driven by the growing pet ownership and the subsequent rise in demand for pet food products, leading to increased packaging needs. Consumer preferences for convenient and sustainable packaging options, such as resealable and eco-friendly materials, further fuel market growth. However, cost constraints and fluctuating raw material prices pose challenges to the industry. Stringent regulations regarding pet food packaging safety and labeling, as well as the need to address concerns related to pet food freshness and contamination, serve as key restraints.

Attractive Opportunities in the Pet Food Packaging Market

Pet Food Packaging Market

To know about the assumptions considered for the study, Request for Free Sample Report

Pet Food Packaging Market

Pet Food Packaging Market Dynamics

Driver: Rising pet ownership to drive the demand for pet food packaging

The growing trend of rising pet ownership serves as a potent driver for the pet food packaging market. As more households across the globe welcome pets into their lives, the demand for pet food products has surged, and this necessitates efficient, attractive, and safe packaging solutions. Pet owners are increasingly discerning, seeking not only quality nutrition for their furry companions but also packaging that ensures freshness, convenience, and easy storage. As a result, pet food packaging manufacturers are compelled to create innovative, user-friendly, and visually appealing packaging options, capitalizing on the pet-humanization trend that places pets at the center of family life. This trend is transforming the pet food packaging industry, emphasizing the need for creative and functional packaging designs to meet the evolving expectations of pet owners.

Restraint: Stringent pet food quality and safety regulations

Stringent pet food quality and safety regulations serve as a significant restraint in the pet food packaging market. Regulatory bodies worldwide impose rigorous standards and requirements to ensure the safety and nutritional value of pet food products. While these regulations are essential to safeguard the health of pets, they also place a burden on pet food manufacturers to comply with complex labeling, packaging, and handling regulations, which can be both time-consuming and costly. Packaging materials and designs must meet strict hygiene and safety standards, limiting the flexibility and creativity in packaging solutions. The need to navigate these regulatory complexities adds an extra layer of challenges to the industry, making it imperative for pet food packaging manufacturers to strike a delicate balance between compliance and innovation to thrive in this highly regulated market.

Opportunities: E-commerce focused solutions.

An emerging opportunity in the pet food packaging market lies in e-commerce-focused solutions. With the rapid growth of online pet food sales, there's a burgeoning demand for packaging that's not only visually appealing and informative but also optimized for shipping and e-commerce. Pet food manufacturers and packaging companies can tap into this opportunity by developing packaging designs that prioritize durability, ease of handling, and space efficiency to reduce shipping costs. Additionally, innovative packaging solutions that enhance the unboxing experience can set brands apart in the online marketplace, making e-commerce-focused packaging a promising avenue for growth and differentiation in the pet food packaging industry.

Challenges: Balancing sustainability with performance and durability

One of the primary challenges in the pet food packaging market is finding the delicate balance between sustainability, performance, and durability. With increasing environmental consciousness, there's a growing demand for eco-friendly and recyclable packaging materials, which can conflict with the necessity for packaging that maintains the freshness and safety of pet food products over time. Striking this equilibrium is a challenge, as pet food packaging must meet rigorous quality and safety standards while also minimizing its environmental footprint. Manufacturers face the task of innovating and adopting sustainable materials and designs without compromising the essential functionality, convenience, and longevity expected by both pet owners and regulatory bodies. This sustainability-performance-durability trifecta presents a complex challenge for the industry that necessitates creative solutions and a commitment to eco-conscious practices.

ECOSYSTEM

Pet Food Packaging Market Ecosystem

By Material, Paper & paper board accounted for the highest CAGR during the forecast period.

Paper and paperboard have emerged as a standout segment in the pet food packaging market, boasting the highest CAGR during the forecasted period. This remarkable growth is primarily attributed to the increasing demand for sustainable and eco-friendly packaging solutions, driven by environmental concerns and shifting consumer preferences. The paper and paperboard packaging options not only align with these eco-conscious trends but also provide cost-effective, lightweight, and customizable alternatives that meet the demands for both convenience and freshness in pet food packaging. As a result, this segment is witnessing accelerated adoption as manufacturers and consumers alike prioritize sustainability, making it a standout performer in the evolving pet food packaging landscape.

By Product, Metal cans accounted for the highest CAGR during the forecast period.

Among various product types in the pet food packaging market, metal cans have demonstrated the highest CAGR during the forecasted period. This notable growth can be attributed to the enduring popularity of metal cans for their exceptional durability and ability to preserve the quality and freshness of pet food products. These cans provide an effective barrier against external factors that could compromise the food's integrity, making them a preferred choice for both wet and dry pet food.

By Food, Pet treats accounted for the highest CAGR during the forecast period.

Among various food types in the pet food packaging market, pet treats have displayed the highest CAGR during the forecasted period. This notable growth underscores the increasing pet owners' inclination toward indulgent and specialized treats for their furry companions. Pet treats often come in various shapes, sizes, and flavors, driving the need for versatile and visually appealing packaging solutions. Manufacturers and packaging companies are capitalizing on this trend by innovating packaging designs that not only preserve the treats' freshness but also enhance their attractiveness and convenience, contributing to the robust CAGR observed in the pet treat segment.

By Animal, Cat food accounted for the highest CAGR during the forecast period.

The cat food packaging is experiencing significant growth due to a rising demand for specialized and premium cat food products. More cat owners are placing a greater emphasis on their feline companions' nutrition and well-being, driving a need for packaging solutions that ensure product freshness and safety while also appealing to discerning consumers. Innovative packaging designs that enhance product presentation and convenience have emerged to cater to these evolving consumer preferences, contributing to the substantial growth in this market segment. This growth is a reflection of the unique dietary and lifestyle requirements of cats, as well as the growing market for high-quality cat food.

Asia Pacific is projected to account for the highest CAGR in the pet food packaging market during the forecast period .

Region's rising pet ownership, growing middle-class population, and increased urbanization, all of this led to an upsurge in demand for pet food and its corresponding packaging. As more households welcome pets into their lives, the need for convenient, visually appealing, and efficient packaging solutions has surged. The expanding middle-class population, with higher disposable incomes, has fueled a preference for premium pet food products that often come with advanced packaging features. Additionally, as e-commerce and online retail continue to gain traction in the region, the demand for e-commerce-friendly pet food packaging has also contributed to this accelerated growth.

Pet Food Packaging Market by Region

To know about the assumptions considered for the study, download the pdf brochure

Key Market Players

The pet food packaging market comprises key players such as Amcor plc (Switzerland), Mondi plc (UK), Sonoco Products Company (US), Berry Global Group, Inc. (US), Huhtamäki Oyj (Finland), Constantia Flexibles International GmbH (Austria), Crown Holdings, Inc. (US), Smurfit Kappa Group plc (Ireland), Ardagh Group S.A. (Luxembourg), Transcontinental, Inc. (Canada), Silgan Holdings, Inc. (US), Winpak Ltd. (Canada), Sealed Air Corporation (US) and others. Expansions, acquisitions, joint ventures, and new product developments are some of the major strategies adopted by these key players to enhance their positions in the pet food packaging market.

Get online access to the report on the World's First Market Intelligence Cloud

  • Easy to Download Historical Data & Forecast Numbers
  • Company Analysis Dashboard for high growth potential opportunities
  • Research Analyst Access for customization & queries
  • Competitor Analysis with Interactive dashboard
  • Latest News, Updates & Trend analysis
Request Sample

Scope of the Report

Report Metric

Details

Market size available for years

2018–2028

Base year considered

2022

Forecast period

2023–2028

Forecast units

Value (USD Million) and Volume (Kiloton)

Segments Covered

Product type, Material type, Food type, Animal type, and Region

Geographies covered

North America, APAC, Europe, South America, and the Middle East & Africa

Companies covered

Amcor Plc (Australia),  Mondi Plc (South Africa), Sonoco Products Company (US), Constantia Flexibles (Austria), Huhtamaki OYJ (Finland), Berry Global Group Inc. (US), Smurfit Kappa (Ireland),  Ardagh Group S.A (Luxembourg).AptarGroup,Inc(US), Goglio S.p.A (Italy),    Transcontinental Inc. (Canada),  Coveris Holdings S.A (Austria), ProAmpac Holdings, Inc. (US), Silgan Holdings, Inc (US), and Winpak Ltd. (Canada)
21 manufacturers are covered in the pet food packaging market.

This research report categorizes the pet food packaging market based on product type, material type, food type, animal type, and region.

Based on material type
Based on product type
  • Pouches
  • Folding Carton
  • Metal cans
  • Bags
  • Other Products Type
Based on animal :
  • Dog food
  • Cat Food
  • Fish food
  • Others (guinea pigs, rabbit, tortoise, and reptiles)
Based on food type:
  • Dry food
  • Wet food
  • Pet treats
  • Others (Chilled, Frozen and Freeze dried)
Based on the region:
  • North America
  • Europe
  • APAC
  • Middle East & Africa
  • South America

Recent Developments

  • In August 2023, Mondi plc and Fressnapf Tiernahrungs GmbH (Germany), Europe’s market leader for pet supplies, made the move to recyclable mono-material packaging for a dry pet food range.
  • In June 2023, Mondi plc and Syntegon (Germany) teamed up to develop new recyclable paper-based packaging for dry food products.
  • In November 2022, Sonoco Products Company announced entering into a definitive agreement to purchase the remaining equity interest in RTS Packaging, LLC (RTS) from joint venture partner WestRock Company (WestRock) and one WestRock paper mill in Chattanooga, Tennessee.
  • In May 2023, Berry Global Group, Inc., Peel Plastic Products Ltd. (Canada), and ExxonMobil (US) collaborated to incorporate International Sustainability and Carbon Certificate (ISCC) PLUS certified-circular plastics into pet food packaging.
  • In October 2022, Berry Global Group, Inc. announced its collaboration with film converter and manufacturer, Printpack (US), leveraging their independent strengths in film manufacturing and conversion to create packaging solutions that support increased customer demand for more sustainable packaging.

Frequently Asked Questions (FAQ):

To speak to our analyst for a discussion on the above findings, click Speak to Analyst

TABLE OF CONTENTS
 
1 INTRODUCTION (Page No. - 27)
    1.1 STUDY OBJECTIVES 
    1.2 MARKET DEFINITION 
           1.2.1 INCLUSIONS AND EXCLUSIONS
    1.3 STUDY SCOPE 
           1.3.1 YEARS CONSIDERED
           1.3.2 REGIONS COVERED
    1.4 CURRENCY CONSIDERED 
    1.5 UNITS CONSIDERED 
    1.6 LIMITATIONS 
    1.7 STAKEHOLDERS 
    1.8 SUMMARY OF CHANGES 
 
2 RESEARCH METHODOLOGY (Page No. - 32)
    2.1 RESEARCH DATA 
           2.1.1 SECONDARY DATA
                    2.1.1.1 Key data from secondary sources
           2.1.2 PRIMARY DATA
                    2.1.2.1 Key data from primary sources
                    2.1.2.2 Breakdown of primary interviews
    2.2 BASE NUMBER CALCULATION 
           2.2.1 SUPPLY-SIDE APPROACH
           2.2.2 DEMAND-SIDE APPROACH
    2.3 MARKET SIZE ESTIMATION 
           2.3.1 BOTTOM-UP APPROACH
           2.3.2 TOP-DOWN APPROACH
    2.4 DATA TRIANGULATION 
    2.5 ASSUMPTIONS 
    2.6 RECESSION IMPACT 
 
3 EXECUTIVE SUMMARY (Page No. - 41)
 
4 PREMIUM INSIGHTS (Page No. - 45)
    4.1 ATTRACTIVE OPPORTUNITIES FOR PLAYERS IN PET FOOD PACKAGING MARKET 
    4.2 ASIA PACIFIC: PET FOOD PACKAGING MARKET, BY ANIMAL AND COUNTRY 
    4.3 PET FOOD PACKAGING MARKET, BY MATERIAL 
    4.4 PET FOOD PACKAGING MARKET, BY PRODUCT 
    4.5 PET FOOD PACKAGING MARKET, BY FOOD 
    4.6 PET FOOD PACKAGING MARKET, BY ANIMAL 
    4.7 PET FOOD PACKAGING MARKET, BY KEY COUNTRY 
 
5 MARKET OVERVIEW (Page No. - 49)
    5.1 INTRODUCTION 
    5.2 MARKET DYNAMICS 
           5.2.1 DRIVERS
                    5.2.1.1 Rising pet ownership
                    5.2.1.2 Humanization of pets
           5.2.2 RESTRAINTS
                    5.2.2.1 Stringent pet food quality and safety regulations
                    5.2.2.2 Supply chain disruptions and fluctuating raw material costs
           5.2.3 OPPORTUNITIES
                    5.2.3.1 E-commerce-focused solutions
                    5.2.3.2 Developing economies as emerging markets
           5.2.4 CHALLENGES
                    5.2.4.1 Balancing sustainability with performance and durability
                    5.2.4.2 Obstacles in package designing
    5.3 PORTER’S FIVE FORCES ANALYSIS 
           5.3.1 THREAT OF NEW ENTRANTS
           5.3.2 THREAT OF SUBSTITUTES
           5.3.3 BARGAINING POWER OF SUPPLIERS
           5.3.4 BARGAINING POWER OF BUYERS
           5.3.5 INTENSITY OF COMPETITIVE RIVALRY
    5.4 VALUE/SUPPLY CHAIN ANALYSIS 
    5.5 TRENDS AND DISRUPTIONS IMPACTING CUSTOMER BUSINESS 
    5.6 TARIFF AND REGULATORY LANDSCAPE 
           5.6.1 ISO 22000 (FOOD SAFETY MANAGEMENT SYSTEMS)
           5.6.2 FOOD CONTACT SUBSTANCE (FCS)
           5.6.3 REGULATORY BODIES, GOVERNMENT AGENCIES, AND OTHER ORGANIZATIONS
    5.7 TECHNOLOGY ANALYSIS 
           5.7.1 INTERNET OF PACKAGING
           5.7.2 EMULSION POLYMERS AS BARRIER COATINGS
    5.8 SUSTAINABILITY TRENDS 
    5.9 ECOSYSTEM MAPPING 
    5.10 KEY STAKEHOLDERS AND BUYING CRITERIA 
           5.10.1 KEY STAKEHOLDERS IN BUYING PROCESS
           5.10.2 BUYING CRITERIA
    5.11 KEY CONFERENCES AND EVENTS, 2023–2025 
    5.12 TRADE ANALYSIS 
           5.12.1 EXPORT SCENARIO
                    5.12.1.1 Export scenario for HS Code: 3923
                    5.12.1.2 Export scenario for HS Code: 481910
                    5.12.1.3 Export scenario for HS Code: 761290
           5.12.2 IMPORT SCENARIO
                    5.12.2.1 Import scenario for HS Code: 3923
                    5.12.2.2 Import scenario for HS Code: 481910
                    5.12.2.3 Import scenario for HS Code: 761290
    5.13 PATENT ANALYSIS 
           5.13.1 DOCUMENT ANALYSIS
           5.13.2 JURISDICTION ANALYSIS
           5.13.3 TOP APPLICANTS
    5.14 CASE STUDY ANALYSIS 
           5.14.1 ENHANCING PET FOOD SACKS WITH EXXONMOBIL PE POLYMERS
                    5.14.1.1 Challenge
                    5.14.1.2 Solution
                    5.14.1.3 Result
           5.14.2 INNOVATIVE PACKAGING SOLUTION FOR HUG PET FOOD
                    5.14.2.1 Objective
                    5.14.2.2 Solution
                    5.14.2.3 Result
           5.14.3 INCREASING SHELF LIFE WITH INNOVATIVE PACKAGING TECHNOLOGY
                    5.14.3.1 Challenge
                    5.14.3.2 Solution
                    5.14.3.3 Result
    5.15 MACROECONOMIC INDICATORS 
           5.15.1 GLOBAL GDP OUTLOOK
    5.16 PRICING ANALYSIS 
           5.16.1 AVERAGE SELLING PRICE, BY REGION
           5.16.2 AVERAGE SELLING PRICE, BY MATERIAL
    5.17 RECESSION IMPACT: REALISTIC, OPTIMISTIC, AND PESSIMISTIC SCENARIOS 
 
6 PET FOOD PACKAGING MARKET, BY MATERIAL (Page No. - 83)
    6.1 INTRODUCTION 
    6.2 PLASTIC 
           6.2.1 VERSATILITY AND SUPERIOR BARRIER PROPERTIES TO DRIVE GROWTH
    6.3 PAPER & PAPERBOARD 
           6.3.1 ECO-FRIENDLINESS AND BIODEGRADABILITY TO DRIVE MARKET
    6.4 METAL 
           6.4.1 DURABILITY AND STRENGTH OF METAL CONTAINERS TO DRIVE MARKET
 
7 PET FOOD PACKAGING MARKET, BY PRODUCT (Page No. - 87)
    7.1 INTRODUCTION 
    7.2 BAGS 
           7.2.1 RISING DEMAND FOR PAPER & PAPERBOARD PACKAGING TO DRIVE MARKET
    7.3 METAL CANS 
           7.3.1 GROWING WET FOOD MARKET TO DRIVE SEGMENT
    7.4 POUCHES 
           7.4.1 INCREASING USE OF REUSABLE PLASTIC AND SUSTAINABLE PACKAGING TO DRIVE MARKET
    7.5 FOLDING CARTONS 
           7.5.1 GROWING DEMAND FOR CHEAPER AND SUSTAINABLE PACKAGING TO BOOST MARKET
    7.6 OTHER PRODUCTS 
 
8 PET FOOD PACKAGING MARKET, BY FOOD (Page No. - 93)
    8.1 INTRODUCTION 
    8.2 DRY FOOD 
           8.2.1 EXTENDED SHELF LIFE OF DRY PET FOOD TO PROPEL MARKET
    8.3 WET FOOD 
           8.3.1 RISING TREND OF HEALTHIER AND CUSTOMIZED DIETS FOR PETS TO DRIVE MARKET
    8.4 PET TREATS 
           8.4.1 GROWING TREND OF PET HUMANIZATION TO BOOST MARKET
    8.5 OTHER FOODS 
 
9 PET FOOD PACKAGING MARKET, BY ANIMAL (Page No. - 98)
    9.1 INTRODUCTION 
    9.2 DOG FOOD 
           9.2.1 DEMAND FOR CUSTOMIZED FOOD PACKETS TO PROPEL MARKET
    9.3 CAT FOOD 
           9.3.1 DEMAND FOR SMALL PORTION SIZES TO DRIVE MARKET
    9.4 FISH FOOD 
           9.4.1 RISING DEMAND FOR DECORATIVE PETS TO BOOST MARKET
    9.5 OTHER ANIMALS 
 
10 PET FOOD PACKAGING MARKET, BY REGION (Page No. - 103)
     10.1 INTRODUCTION 
     10.2 NORTH AMERICA 
             10.2.1 RECESSION IMPACT ON NORTH AMERICA
             10.2.2 US
                        10.2.2.1 Large consumer base to drive growth
             10.2.3 CANADA
                        10.2.3.1 Increase in pet spending to drive growth
             10.2.4 MEXICO
                        10.2.4.1 Rapid urbanization and economic growth to drive market
     10.3 ASIA PACIFIC 
             10.3.1 RECESSION IMPACT ON ASIA PACIFIC
             10.3.2 CHINA
                        10.3.2.1 E-commerce growth and consumer preferences to drive market
             10.3.3 JAPAN
                        10.3.3.1 Increasing demand for domestic products to fuel market
             10.3.4 INDIA
                        10.3.4.1 Rising per capita disposable income to drive market
             10.3.5 SOUTH KOREA
                        10.3.5.1 Increasing preference for smaller breeds to drive demand for specific pet food
             10.3.6 REST OF ASIA PACIFIC
     10.4 EUROPE 
             10.4.1 RECESSION IMPACT ON EUROPE
             10.4.2 UK
                        10.4.2.1 Increased adoption of feline pets to drive market
             10.4.3 GERMANY
                        10.4.3.1 Strong pet ownership culture to drive growth
             10.4.4 FRANCE
                        10.4.4.1 Affinity for feline companions to drive market
             10.4.5 ITALY
                        10.4.5.1 Demand for specialized pet food to drive growth
             10.4.6 RUSSIA
                        10.4.6.1 Demand for domestic production of pet food to drive growth
             10.4.7 POLAND
                        10.4.7.1 Expansion of pet food business to drive market
             10.4.8 REST OF EUROPE
     10.5 MIDDLE EAST & AFRICA 
             10.5.1 RECESSION IMPACT ON MIDDLE EAST & AFRICA
             10.5.2 TURKEY
                        10.5.2.1 Increase in Turkish product exports to boost market
             10.5.3 UAE
                        10.5.3.1 Rising pet expenditure by millennials to boost market
             10.5.4 SAUDI ARABIA
                        10.5.4.1 Emergence of new pet food factories to propel growth
             10.5.5 SOUTH AFRICA
                        10.5.5.1 Well-established manufacturing sector to propel market
             10.5.6 REST OF MIDDLE EAST & AFRICA
     10.6 SOUTH AMERICA 
             10.6.1 RECESSION IMPACT ON SOUTH AMERICA
             10.6.2 BRAZIL
                        10.6.2.1 Growth of pet industry to drive market
             10.6.3 ARGENTINA
                        10.6.3.1 Stable raw material supply and food production to drive market
             10.6.4 REST OF SOUTH AMERICA
 
11 COMPETITIVE LANDSCAPE (Page No. - 201)
     11.1 KEY PLAYER STRATEGIES/RIGHT TO WIN 
     11.2 REVENUE ANALYSIS 
     11.3 MARKET SHARE ANALYSIS 
     11.4 COMPANY EVALUATION MATRIX 
             11.4.1 STARS
             11.4.2 EMERGING LEADERS
             11.4.3 PERVASIVE PLAYERS
             11.4.4 PARTICIPANTS
             11.4.5 COMPANY FOOTPRINT
     11.5 STARTUP/SME EVALUATION MATRIX 
             11.5.1 PROGRESSIVE COMPANIES
             11.5.2 DYNAMIC COMPANIES
             11.5.3 RESPONSIVE COMPANIES
             11.5.4 STARTING BLOCKS
     11.6 COMPETITIVE BENCHMARKING 
             11.6.1 PRODUCT/SERVICE LAUNCHES
             11.6.2 DEALS
             11.6.3 OTHERS
 
12 COMPANY PROFILES (Page No. - 214)
     12.1 KEY PLAYERS 
             12.1.1 AMCOR PLC
                        12.1.1.1 Business overview
                        12.1.1.2 Products/Solutions/Services offered
                        12.1.1.3 Recent developments
                        12.1.1.4 MnM view
                                     12.1.1.4.1 Right to win
                                     12.1.1.4.2 Strategic choices
                                     12.1.1.4.3 Weaknesses & competitive threats
             12.1.2 MONDI PLC
                        12.1.2.1 Business overview
                        12.1.2.2 Products/Solutions/Services offered
                        12.1.2.3 Recent developments
                        12.1.2.4 MnM view
                                     12.1.2.4.1 Right to win
                                     12.1.2.4.2 Strategic choices
                                     12.1.2.4.3 Weaknesses & competitive threats
             12.1.3 SONOCO PRODUCTS COMPANY
                        12.1.3.1 Business overview
                        12.1.3.2 Products/Solutions/Services offered
                        12.1.3.3 Recent developments
                        12.1.3.4 MnM view
                                     12.1.3.4.1 Right to win
                                     12.1.3.4.2 Strategic choices
                                     12.1.3.4.3 Weaknesses & competitive threats
             12.1.4 HUHTAMÄKI OYJ
                        12.1.4.1 Business overview
                        12.1.4.2 Products/Solutions/Services offered
                        12.1.4.3 Recent developments
                        12.1.4.4 MnM view
                                     12.1.4.4.1 Right to win
                                     12.1.4.4.2 Strategic choices
                                     12.1.4.4.3 Weaknesses & competitive threats
             12.1.5 BERRY GLOBAL GROUP, INC.
                        12.1.5.1 Business overview
                        12.1.5.2 Products/Solutions/Services offered
                        12.1.5.3 Recent developments
                        12.1.5.4 MnM view
                                     12.1.5.4.1 Right to win
                                     12.1.5.4.2 Strategic choices
                                     12.1.5.4.3 Weaknesses & competitive threats
             12.1.6 CONSTANTIA FLEXIBLES INTERNATIONAL GMBH
                        12.1.6.1 Business overview
                        12.1.6.2 Products/Solutions/Services offered
                        12.1.6.3 Recent developments
                        12.1.6.4 MnM view
                                     12.1.6.4.1 Right to win
                                     12.1.6.4.2 Strategic choices
                                     12.1.6.4.3 Weaknesses & competitive threats
             12.1.7 CROWN HOLDINGS, INC.
                        12.1.7.1 Business overview
                        12.1.7.2 Products/Solutions/Services offered
                        12.1.7.3 Recent developments
             12.1.8 SMURFIT KAPPA GROUP PLC
                        12.1.8.1 Business overview
                        12.1.8.2 Products/Solutions/Services offered
                        12.1.8.3 Recent developments
             12.1.9 ARDAGH GROUP S.A.
                        12.1.9.1 Business overview
                        12.1.9.2 Products/Solutions/Services offered
                        12.1.9.3 Recent developments
             12.1.10 TRANSCONTINENTAL INC.
                        12.1.10.1 Business overview
                        12.1.10.2 Products/Solutions/Services offered
                        12.1.10.3 Recent developments
             12.1.11 WINPAK LTD.
                        12.1.11.1 Business overview
                        12.1.11.2 Products/Solutions/Services offered
             12.1.12 SILGAN HOLDINGS INC.
                        12.1.12.1 Business overview
                        12.1.12.2 Products/Solutions/Services offered
                        12.1.12.3 Recent developments
             12.1.13 SEALED AIR CORPORATION
                        12.1.13.1 Business overview
                        12.1.13.2 Products/Solutions/Services offered
                        12.1.13.3 Recent developments
     12.2 OTHER PLAYERS 
             12.2.1 AMERICAN PACKAGING CORPORATION
             12.2.2 BERLIN PACKAGING L.L.C.
             12.2.3 PRINTPACK, INC.
             12.2.4 WESTROCK COMPANY
             12.2.5 GREIF, INC.
             12.2.6 PROAMPAC HOLDINGS, INC.
             12.2.7 COVERIS MANAGEMENT GMBH
             12.2.8 JUPITER LAMINATORS PVT. LTD.
             12.2.9 EPAC HOLDINGS, LLC.
             12.2.10 EMMERSON PACKAGING
             12.2.11 KM PACKAGING SERVICES LTD.
             12.2.12 LD PACKAGING CO., LTD.
 
13 ADJACENT & RELATED MARKETS (Page No. - 268)
     13.1 INTRODUCTION 
     13.2 LIMITATIONS 
     13.3 E-COMMERCE PACKAGING MARKET 
             13.3.1 MARKET DEFINITION
             13.3.2 MARKET OVERVIEW
     13.4 E-COMMERCE PACKAGING MARKET, BY PRODUCT TYPE 
     13.5 E-COMMERCE PACKAGING MARKET, BY MATERIAL 
     13.6 E-COMMERCE PACKAGING MARKET, BY APPLICATION 
     13.7 E-COMMERCE PACKAGING MARKET, BY REGION 
 
14 APPENDIX (Page No. - 274)
     14.1 DISCUSSION GUIDE 
     14.2 KNOWLEDGESTORE: MARKETSANDMARKETS’ SUBSCRIPTION PORTAL 
     14.3 AVAILABLE CUSTOMIZATIONS 
     14.4 RELATED REPORTS 
     14.5 AUTHORS DETAILS 
 
 
LIST OF TABLES (389 TABLE)
 
TABLE 1 CONVERSION RATES, 2019–2022
TABLE 2 PORTER’S FIVE FORCE ANALYSIS
TABLE 3 REGULATORY BODIES, GOVERNMENT AGENCIES, AND OTHER ORGANIZATIONS
TABLE 4 PET FOOD PACKAGING MARKET ECOSYSTEM MAPPING
TABLE 5 INFLUENCE OF STAKEHOLDERS ON BUYING PROCESS OF PET FOOD PACKAGING PRODUCTS (%)
TABLE 6 KEY BUYING CRITERIA FOR PET FOOD PACKAGING PRODUCTS
TABLE 7 KEY CONFERENCES AND EVENTS, 2023–2025
TABLE 8 EXPORT SCENARIO FOR HS CODE: 3923, BY COUNTRY, 2022 (USD BILLION)
TABLE 9 EXPORT SCENARIO FOR HS CODE: 481910, BY COUNTRY, 2022 (USD BILLION)
TABLE 10 EXPORT SCENARIO FOR HS CODE: 761290, BY COUNTRY, 2022 (USD BILLION)
TABLE 11 IMPORT SCENARIO FOR HS CODE: 3923, BY COUNTRY, 2022 (USD BILLION)
TABLE 12 IMPORT SCENARIO FOR HS CODE: 481910, BY COUNTRY, 2022 (USD BILLION)
TABLE 13 IMPORT SCENARIO FOR HS CODE: 761290, BY COUNTRY, 2022 (USD BILLION)
TABLE 14 PATENTS BY UNICHARM CORPORATION
TABLE 15 PATENTS BY TAILSCO LTD.
TABLE 16 PATENTS BY BIG HEART PET INC.
TABLE 17 US: TOP PATENT OWNERS, 2013–2022
TABLE 18 GLOBAL GDP GROWTH PROJECTION, 2021–2028 (USD TRILLION)
TABLE 19 AVERAGE SELLING PRICE, BY MATERIAL (USD/KG)
TABLE 20 PET FOOD PACKAGING MARKET, BY MATERIAL, 2018–2021 (USD MILLION)
TABLE 21 PET FOOD PACKAGING MARKET, BY MATERIAL, 2022–2028 (USD MILLION)
TABLE 22 PET FOOD PACKAGING MARKET, BY MATERIAL, 2018–2021 (MILLION KG)
TABLE 23 PET FOOD PACKAGING MARKET, BY MATERIAL, 2022–2028 (MILLION KG)
TABLE 24 PET FOOD PACKAGING MARKET, BY PRODUCT, 2018–2021 (USD MILLION)
TABLE 25 PET FOOD PACKAGING MARKET, BY PRODUCT, 2022–2028 (USD MILLION)
TABLE 26 PET FOOD PACKAGING MARKET, BY PRODUCT, 2018–2021 (MILLION KG)
TABLE 27 PET FOOD PACKAGING MARKET, BY PRODUCT, 2022–2028 (MILLION KG)
TABLE 28 PET FOOD PACKAGING MARKET, BY FOOD, 2018–2021 (USD MILLION)
TABLE 29 PET FOOD PACKAGING MARKET, BY FOOD, 2022–2028 (USD MILLION)
TABLE 30 PET FOOD PACKAGING MARKET, BY FOOD, 2018–2021 (MILLION KG)
TABLE 31 PET FOOD PACKAGING MARKET, BY FOOD, 2022–2028 (MILLION KG)
TABLE 32 PET FOOD PACKAGING MARKET, BY ANIMAL, 2018–2021 (USD MILLION)
TABLE 33 PET FOOD PACKAGING MARKET, BY ANIMAL, 2022–2028 (USD MILLION)
TABLE 34 PET FOOD PACKAGING MARKET, BY ANIMAL, 2018–2021 (MILLION KG)
TABLE 35 PET FOOD PACKAGING MARKET, BY ANIMAL, 2022–2028 (MILLION KG)
TABLE 36 PET FOOD PACKAGING MARKET, BY REGION, 2018–2021 (USD MILLION)
TABLE 37 PET FOOD PACKAGING MARKET, BY REGION, 2022–2028 (USD MILLION)
TABLE 38 PET FOOD PACKAGING MARKET, BY REGION, 2018–2021 (MILLION KG)
TABLE 39 PET FOOD PACKAGING MARKET, BY REGION, 2022–2028 (USD MILLION KG)
TABLE 40 NORTH AMERICA: PET FOOD PACKAGING MARKET, BY COUNTRY, 2018–2021 (USD MILLION)
TABLE 41 NORTH AMERICA: PET FOOD PACKAGING MARKET, BY COUNTRY, 2022–2028 (USD MILLION)
TABLE 42 NORTH AMERICA: PET FOOD PACKAGING MARKET, BY COUNTRY, 2018–2021 (MILLION KG)
TABLE 43 NORTH AMERICA: PET FOOD PACKAGING MARKET, BY COUNTRY, 2022–2028 (MILLION KG)
TABLE 44 NORTH AMERICA: PET FOOD PACKAGING MARKET, BY MATERIAL, 2018–2021 (USD MILLION)
TABLE 45 NORTH AMERICA: PET FOOD PACKAGING MARKET, BY MATERIAL, 2022–2028 (USD MILLION)
TABLE 46 NORTH AMERICA: PET FOOD PACKAGING MARKET, BY MATERIAL, 2018–2021 (MILLION KG)
TABLE 47 NORTH AMERICA: PET FOOD PACKAGING MARKET, BY MATERIAL, 2022–2028 (MILLION KG)
TABLE 48 NORTH AMERICA: PET FOOD PACKAGING MARKET, BY PRODUCT, 2018–2021 (USD MILLION)
TABLE 49 NORTH AMERICA: PET FOOD PACKAGING MARKET, BY PRODUCT, 2022–2028 (USD MILLION)
TABLE 50 NORTH AMERICA: PET FOOD PACKAGING MARKET, BY PRODUCT, 2018–2021 (MILLION KG)
TABLE 51 NORTH AMERICA: PET FOOD PACKAGING MARKET, BY PRODUCT, 2022–2028 (MILLION KG)
TABLE 52 NORTH AMERICA: PET FOOD PACKAGING MARKET, BY FOOD, 2018–2021 (USD MILLION)
TABLE 53 NORTH AMERICA: PET FOOD PACKAGING MARKET, BY FOOD, 2022–2028 (USD MILLION)
TABLE 54 NORTH AMERICA: PET FOOD PACKAGING MARKET, BY FOOD, 2018–2021 (MILLION KG)
TABLE 55 NORTH AMERICA: PET FOOD PACKAGING MARKET, BY FOOD, 2022–2028 (MILLION KG)
TABLE 56 NORTH AMERICA: PET FOOD PACKAGING MARKET, BY ANIMAL, 2018–2021 (USD MILLION)
TABLE 57 NORTH AMERICA: PET FOOD PACKAGING MARKET, BY ANIMAL, 2022–2028 (USD MILLION)
TABLE 58 NORTH AMERICA: PET FOOD PACKAGING MARKET, BY ANIMAL, 2018–2021 (MILLION KG)
TABLE 59 NORTH AMERICA: PET FOOD PACKAGING MARKET, BY ANIMAL, 2022–2028 (MILLION KG)
TABLE 60 US: PET FOOD PACKAGING MARKET, BY PRODUCT, 2018–2021 (USD MILLION)
TABLE 61 US: PET FOOD PACKAGING MARKET, BY PRODUCT, 2022–2028 (USD MILLION)
TABLE 62 US: PET FOOD PACKAGING MARKET, BY PRODUCT, 2018–2021 (MILLION KG)
TABLE 63 US: PET FOOD PACKAGING MARKET, BY PRODUCT, 2022–2028 (MILLION KG)
TABLE 64 US: PET FOOD PACKAGING MARKET, BY FOOD, 2018–2021 (USD MILLION)
TABLE 65 US: PET FOOD PACKAGING MARKET, BY FOOD, 2022–2028 (USD MILLION)
TABLE 66 US: PET FOOD PACKAGING MARKET, BY FOOD, 2018–2021 (MILLION KG)
TABLE 67 US: PET FOOD PACKAGING MARKET, BY FOOD, 2022–2028 (MILLION KG)
TABLE 68 CANADA: PET FOOD PACKAGING MARKET, BY PRODUCT, 2018–2021 (USD MILLION)
TABLE 69 CANADA: PET FOOD PACKAGING MARKET, BY PRODUCT, 2022–2028 (USD MILLION)
TABLE 70 CANADA: PET FOOD PACKAGING MARKET, BY PRODUCT, 2018–2021 (MILLION KG)
TABLE 71 CANADA: PET FOOD PACKAGING MARKET, BY PRODUCT, 2022–2028 (MILLION KG)
TABLE 72 CANADA: PET FOOD PACKAGING MARKET, BY FOOD, 2018–2021 (USD MILLION)
TABLE 73 CANADA: PET FOOD PACKAGING MARKET, BY FOOD, 2022–2028 (USD MILLION)
TABLE 74 CANADA: PET FOOD PACKAGING MARKET, BY FOOD, 2018–2021 (MILLION KG)
TABLE 75 CANADA: PET FOOD PACKAGING MARKET, BY FOOD, 2022–2028 (MILLION KG)
TABLE 76 MEXICO: PET FOOD PACKAGING MARKET, BY PRODUCT, 2018–2021 (USD MILLION)
TABLE 77 MEXICO: PET FOOD PACKAGING MARKET, BY PRODUCT, 2022–2028 (USD MILLION)
TABLE 78 MEXICO: PET FOOD PACKAGING MARKET, BY PRODUCT, 2018–2021 (MILLION KG)
TABLE 79 MEXICO: PET FOOD PACKAGING MARKET, BY PRODUCT, 2022–2028 (MILLION KG)
TABLE 80 MEXICO: PET FOOD PACKAGING MARKET, BY FOOD, 2018–2021 (USD MILLION)
TABLE 81 MEXICO: PET FOOD PACKAGING MARKET, BY FOOD, 2022–2028 (USD MILLION)
TABLE 82 MEXICO: PET FOOD PACKAGING MARKET, BY FOOD, 2018–2021 (MILLION KG)
TABLE 83 MEXICO: PET FOOD PACKAGING MARKET, BY FOOD, 2022–2028 (MILLION KG)
TABLE 84 ASIA PACIFIC: PET FOOD PACKAGING MARKET, BY COUNTRY, 2018–2021 (USD MILLION)
TABLE 85 ASIA PACIFIC: PET FOOD PACKAGING MARKET, BY COUNTRY, 2022–2028 (USD MILLION)
TABLE 86 ASIA PACIFIC: PET FOOD PACKAGING MARKET, BY COUNTRY, 2018–2021 (MILLION KG)
TABLE 87 ASIA PACIFIC: PET FOOD PACKAGING MARKET, BY COUNTRY, 2022–2028 (MILLION KG)
TABLE 88 ASIA PACIFIC: PET FOOD PACKAGING MARKET, BY MATERIAL, 2018–2021 (USD MILLION)
TABLE 89 ASIA PACIFIC: PET FOOD PACKAGING MARKET, BY MATERIAL, 2022–2028 (USD MILLION)
TABLE 90 ASIA PACIFIC: PET FOOD PACKAGING MARKET, BY MATERIAL, 2018–2021 (MILLION KG)
TABLE 91 ASIA PACIFIC: PET FOOD PACKAGING MARKET, BY MATERIAL, 2022–2028 (MILLION KG)
TABLE 92 ASIA PACIFIC: PET FOOD PACKAGING MARKET, BY PRODUCT, 2018–2021 (USD MILLION)
TABLE 93 ASIA PACIFIC: PET FOOD PACKAGING MARKET, BY PRODUCT, 2022–2028 (USD MILLION)
TABLE 94 ASIA PACIFIC: PET FOOD PACKAGING MARKET, BY PRODUCT, 2018–2021 (MILLION KG)
TABLE 95 ASIA PACIFIC: PET FOOD PACKAGING MARKET, BY PRODUCT, 2022–2028 (MILLION KG)
TABLE 96 ASIA PACIFIC: PET FOOD PACKAGING MARKET, BY FOOD, 2018–2021 (USD MILLION)
TABLE 97 ASIA PACIFIC: PET FOOD PACKAGING MARKET, BY FOOD, 2022–2028 (USD MILLION)
TABLE 98 ASIA PACIFIC: PET FOOD PACKAGING MARKET, BY FOOD, 2018–2021 (MILLION KG)
TABLE 99 ASIA PACIFIC: PET FOOD PACKAGING MARKET, BY FOOD, 2022–2028 (MILLION KG)
TABLE 100 ASIA PACIFIC: PET FOOD PACKAGING MARKET, BY ANIMAL, 2018–2021 (USD MILLION)
TABLE 101 ASIA PACIFIC: PET FOOD PACKAGING MARKET, BY ANIMAL, 2022–2028 (USD MILLION)
TABLE 102 ASIA PACIFIC: PET FOOD PACKAGING MARKET, BY ANIMAL, 2018–2021 (MILLION KG)
TABLE 103 ASIA PACIFIC: PET FOOD PACKAGING MARKET, BY ANIMAL, 2022–2028 (MILLION KG)
TABLE 104 CHINA: PET FOOD PACKAGING MARKET, BY PRODUCT, 2018–2021 (USD MILLION)
TABLE 105 CHINA: PET FOOD PACKAGING MARKET, BY PRODUCT, 2022–2028 (USD MILLION)
TABLE 106 CHINA: PET FOOD PACKAGING MARKET, BY PRODUCT, 2018–2021 (MILLION KG)
TABLE 107 CHINA: PET FOOD PACKAGING MARKET, BY PRODUCT, 2022–2028 (MILLION KG)
TABLE 108 CHINA: PET FOOD PACKAGING MARKET, BY FOOD, 2018–2021 (USD MILLION)
TABLE 109 CHINA: PET FOOD PACKAGING MARKET, BY FOOD, 2022–2028 (USD MILLION)
TABLE 110 CHINA: PET FOOD PACKAGING MARKET, BY FOOD, 2018–2021 (MILLION KG)
TABLE 111 CHINA: PET FOOD PACKAGING MARKET, BY FOOD, 2022–2028 (MILLION KG)
TABLE 112 JAPAN: PET FOOD PACKAGING MARKET, BY PRODUCT, 2018–2021 (USD MILLION)
TABLE 113 JAPAN: PET FOOD PACKAGING MARKET, BY PRODUCT, 2022–2028 (USD MILLION)
TABLE 114 JAPAN: PET FOOD PACKAGING MARKET, BY PRODUCT, 2018–2021 (MILLION KG)
TABLE 115 JAPAN: PET FOOD PACKAGING MARKET, BY PRODUCT, 2022–2028 (MILLION KG)
TABLE 116 JAPAN: PET FOOD PACKAGING MARKET, BY FOOD, 2018–2021 (USD MILLION)
TABLE 117 JAPAN: PET FOOD PACKAGING MARKET, BY FOOD, 2022–2028 (USD MILLION)
TABLE 118 JAPAN: PET FOOD PACKAGING MARKET, BY FOOD, 2018–2021 (MILLION KG)
TABLE 119 JAPAN: PET FOOD PACKAGING MARKET, BY FOOD, 2022–2028 (MILLION KG)
TABLE 120 INDIA: PET FOOD PACKAGING MARKET, BY PRODUCT, 2018–2021 (USD MILLION)
TABLE 121 INDIA: PET FOOD PACKAGING MARKET, BY PRODUCT, 2022–2028 (USD MILLION)
TABLE 122 INDIA: PET FOOD PACKAGING MARKET, BY PRODUCT, 2018–2021 (MILLION KG)
TABLE 123 INDIA: PET FOOD PACKAGING MARKET, BY PRODUCT, 2022–2028 (MILLION KG)
TABLE 124 INDIA: PET FOOD PACKAGING MARKET, BY FOOD, 2018–2021 (USD MILLION)
TABLE 125 INDIA: PET FOOD PACKAGING MARKET, BY FOOD, 2022–2028 (USD MILLION)
TABLE 126 INDIA: PET FOOD PACKAGING MARKET, BY FOOD, 2018–2021 (MILLION KG)
TABLE 127 INDIA: PET FOOD PACKAGING MARKET, BY FOOD, 2022–2028 (MILLION KG)
TABLE 128 SOUTH KOREA: PET FOOD PACKAGING MARKET, BY PRODUCT, 2018–2021 (USD MILLION)
TABLE 129 SOUTH KOREA: PET FOOD PACKAGING MARKET, BY PRODUCT, 2022–2028 (USD MILLION)
TABLE 130 SOUTH KOREA: PET FOOD PACKAGING MARKET, BY PRODUCT, 2018–2021 (MILLION KG)
TABLE 131 SOUTH KOREA: PET FOOD PACKAGING MARKET, BY PRODUCT, 2022–2028 (MILLION KG)
TABLE 132 SOUTH KOREA: PET FOOD PACKAGING MARKET, BY FOOD, 2018–2021 (USD MILLION)
TABLE 133 SOUTH KOREA: PET FOOD PACKAGING MARKET, BY FOOD, 2022–2028 (USD MILLION)
TABLE 134 SOUTH KOREA: PET FOOD PACKAGING MARKET, BY FOOD, 2018–2021 (MILLION KG)
TABLE 135 SOUTH KOREA: PET FOOD PACKAGING MARKET, BY FOOD, 2022–2028 (MILLION KG)
TABLE 136 REST OF ASIA PACIFIC: PET FOOD PACKAGING MARKET, BY PRODUCT, 2018–2021 (USD MILLION)
TABLE 137 REST OF ASIA PACIFIC: PET FOOD PACKAGING MARKET, BY PRODUCT, 2022–2028 (USD MILLION)
TABLE 138 REST OF ASIA PACIFIC: PET FOOD PACKAGING MARKET, BY PRODUCT, 2018–2021 (MILLION KG)
TABLE 139 REST OF ASIA PACIFIC: PET FOOD PACKAGING MARKET, BY PRODUCT, 2022–2028 (MILLION KG)
TABLE 140 REST OF ASIA PACIFIC: PET FOOD PACKAGING MARKET, BY FOOD, 2018–2021 (USD MILLION)
TABLE 141 REST OF ASIA PACIFIC: PET FOOD PACKAGING MARKET, BY FOOD, 2022–2028 (USD MILLION)
TABLE 142 REST OF ASIA PACIFIC: PET FOOD PACKAGING MARKET, BY FOOD, 2018–2021 (MILLION KG)
TABLE 143 REST OF ASIA PACIFIC: PET FOOD PACKAGING MARKET, BY FOOD, 2022–2028 (MILLION KG)
TABLE 144 EUROPE: PET FOOD PACKAGING MARKET, BY COUNTRY, 2018–2021 (USD MILLION)
TABLE 145 EUROPE: PET FOOD PACKAGING MARKET, BY COUNTRY, 2022–2028 (USD MILLION)
TABLE 146 EUROPE: PET FOOD PACKAGING MARKET, BY COUNTRY, 2018–2021 (MILLION KG)
TABLE 147 EUROPE: PET FOOD PACKAGING MARKET, BY COUNTRY, 2022–2028 (MILLION KG)
TABLE 148 EUROPE: PET FOOD PACKAGING MARKET, BY MATERIAL, 2018–2021 (USD MILLION)
TABLE 149 EUROPE: PET FOOD PACKAGING MARKET, BY MATERIAL, 2022–2028 (USD MILLION)
TABLE 150 EUROPE: PET FOOD PACKAGING MARKET, BY MATERIAL, 2018–2021 (MILLION KG)
TABLE 151 EUROPE: PET FOOD PACKAGING MARKET, BY MATERIAL, 2022–2028 (MILLION KG)
TABLE 152 EUROPE: PET FOOD PACKAGING MARKET, BY PRODUCT, 2018–2021 (USD MILLION)
TABLE 153 EUROPE: PET FOOD PACKAGING MARKET, BY PRODUCT, 2022–2028 (USD MILLION)
TABLE 154 EUROPE: PET FOOD PACKAGING MARKET, BY PRODUCT, 2018–2021 (MILLION KG)
TABLE 155 EUROPE: PET FOOD PACKAGING MARKET, BY PRODUCT, 2022–2028 (MILLION KG)
TABLE 156 EUROPE: PET FOOD PACKAGING MARKET, BY FOOD, 2018–2021 (USD MILLION)
TABLE 157 EUROPE: PET FOOD PACKAGING MARKET, BY FOOD, 2022–2028 (USD MILLION)
TABLE 158 EUROPE: PET FOOD PACKAGING MARKET, BY FOOD, 2018–2021 (MILLION KG)
TABLE 159 EUROPE: PET FOOD PACKAGING MARKET, BY FOOD, 2022–2028 (MILLION KG)
TABLE 160 EUROPE: PET FOOD PACKAGING MARKET, BY ANIMAL, 2018–2021 (USD MILLION)
TABLE 161 EUROPE: PET FOOD PACKAGING MARKET, BY ANIMAL, 2022–2028 (USD MILLION)
TABLE 162 EUROPE: PET FOOD PACKAGING MARKET, BY ANIMAL, 2018–2021 (MILLION KG)
TABLE 163 EUROPE: PET FOOD PACKAGING MARKET, BY ANIMAL, 2022–2028 (MILLION KG)
TABLE 164 UK: PET FOOD PACKAGING MARKET, BY PRODUCT, 2018–2021 (USD MILLION)
TABLE 165 UK: PET FOOD PACKAGING MARKET, BY PRODUCT, 2022–2028 (USD MILLION)
TABLE 166 UK: PET FOOD PACKAGING MARKET, BY PRODUCT, 2018–2021 (MILLION KG)
TABLE 167 UK: PET FOOD PACKAGING MARKET, BY PRODUCT, 2022–2028 (MILLION KG)
TABLE 168 UK: PET FOOD PACKAGING MARKET, BY FOOD, 2018–2021 (USD MILLION)
TABLE 169 UK: PET FOOD PACKAGING MARKET, BY FOOD, 2022–2028 (USD MILLION)
TABLE 170 UK: PET FOOD PACKAGING MARKET, BY FOOD, 2018–2021 (MILLION KG)
TABLE 171 UK: PET FOOD PACKAGING MARKET, BY FOOD, 2022–2028 (MILLION KG)
TABLE 172 GERMANY: PET FOOD PACKAGING MARKET, BY PRODUCT, 2018–2021 (USD MILLION)
TABLE 173 GERMANY: PET FOOD PACKAGING MARKET, BY PRODUCT, 2022–2028 (USD MILLION)
TABLE 174 GERMANY: PET FOOD PACKAGING MARKET, BY PRODUCT, 2018–2021 (MILLION KG)
TABLE 175 GERMANY: PET FOOD PACKAGING MARKET, BY PRODUCT, 2022–2028 (MILLION KG)
TABLE 176 GERMANY: PET FOOD PACKAGING MARKET, BY FOOD, 2018–2021 (USD MILLION)
TABLE 177 GERMANY: PET FOOD PACKAGING MARKET, BY FOOD, 2022–2028 (USD MILLION)
TABLE 178 GERMANY: PET FOOD PACKAGING MARKET, BY FOOD, 2018–2021 (MILLION KG)
TABLE 179 GERMANY: PET FOOD PACKAGING MARKET, BY FOOD, 2022–2028 (MILLION KG)
TABLE 180 FRANCE: PET FOOD PACKAGING MARKET, BY PRODUCT, 2018–2021 (USD MILLION)
TABLE 181 FRANCE: PET FOOD PACKAGING MARKET, BY PRODUCT, 2022–2028 (USD MILLION)
TABLE 182 FRANCE: PET FOOD PACKAGING MARKET, BY PRODUCT, 2018–2021 (MILLION KG)
TABLE 183 FRANCE: PET FOOD PACKAGING MARKET, BY PRODUCT, 2022–2028 (MILLION KG)
TABLE 184 FRANCE: PET FOOD PACKAGING MARKET, BY FOOD, 2018–2021 (USD MILLION)
TABLE 185 FRANCE: PET FOOD PACKAGING MARKET, BY FOOD, 2022–2028 (USD MILLION)
TABLE 186 FRANCE: PET FOOD PACKAGING MARKET, BY FOOD, 2018–2021 (MILLION KG)
TABLE 187 FRANCE: PET FOOD PACKAGING MARKET, BY FOOD, 2022–2028 (MILLION KG)
TABLE 188 ITALY: PET FOOD PACKAGING MARKET, BY PRODUCT, 2018–2021 (USD MILLION)
TABLE 189 ITALY: PET FOOD PACKAGING MARKET, BY PRODUCT, 2022–2028 (USD MILLION)
TABLE 190 ITALY: PET FOOD PACKAGING MARKET, BY PRODUCT, 2018–2021 (MILLION KG)
TABLE 191 ITALY: PET FOOD PACKAGING MARKET, BY PRODUCT, 2022–2028 (MILLION KG)
TABLE 192 ITALY: PET FOOD PACKAGING MARKET, BY FOOD, 2018–2021 (USD MILLION)
TABLE 193 ITALY: PET FOOD PACKAGING MARKET, BY FOOD, 2022–2028 (USD MILLION)
TABLE 194 ITALY: PET FOOD PACKAGING MARKET, BY FOOD, 2018–2021 (MILLION KG)
TABLE 195 ITALY: PET FOOD PACKAGING MARKET, BY FOOD, 2022–2028 (MILLION KG)
TABLE 196 RUSSIA: PET FOOD PACKAGING MARKET, BY PRODUCT, 2018–2021 (USD MILLION)
TABLE 197 RUSSIA: PET FOOD PACKAGING MARKET, BY PRODUCT, 2022–2028 (USD MILLION)
TABLE 198 RUSSIA: PET FOOD PACKAGING MARKET, BY PRODUCT, 2018–2021 (MILLION KG)
TABLE 199 RUSSIA: PET FOOD PACKAGING MARKET, BY PRODUCT, 2022–2028 (MILLION KG)
TABLE 200 RUSSIA: PET FOOD PACKAGING MARKET, BY FOOD, 2018–2021 (USD MILLION)
TABLE 201 RUSSIA: PET FOOD PACKAGING MARKET, BY FOOD, 2022–2028 (USD MILLION)
TABLE 202 RUSSIA: PET FOOD PACKAGING MARKET, BY FOOD, 2018–2021 (MILLION KG)
TABLE 203 RUSSIA: PET FOOD PACKAGING MARKET, BY FOOD, 2022–2028 (MILLION KG)
TABLE 204 POLAND: PET FOOD PACKAGING MARKET, BY PRODUCT, 2018–2021 (USD MILLION)
TABLE 205 POLAND: PET FOOD PACKAGING MARKET, BY PRODUCT, 2022–2028 (USD MILLION)
TABLE 206 POLAND: PET FOOD PACKAGING MARKET, BY PRODUCT, 2018–2021 (MILLION KG)
TABLE 207 POLAND: PET FOOD PACKAGING MARKET, BY PRODUCT, 2022–2028 (MILLION KG)
TABLE 208 POLAND: PET FOOD PACKAGING MARKET, BY FOOD, 2018–2021 (USD MILLION)
TABLE 209 POLAND: PET FOOD PACKAGING MARKET, BY FOOD, 2022–2028 (USD MILLION)
TABLE 210 POLAND: PET FOOD PACKAGING MARKET, BY FOOD, 2018–2021 (MILLION KG)
TABLE 211 POLAND: PET FOOD PACKAGING MARKET, BY FOOD, 2022–2028 (MILLION KG)
TABLE 212 REST OF EUROPE: PET FOOD PACKAGING MARKET, BY PRODUCT, 2018–2021 (USD MILLION)
TABLE 213 REST OF EUROPE: PET FOOD PACKAGING MARKET, BY PRODUCT, 2022–2028 (USD MILLION)
TABLE 214 REST OF EUROPE: PET FOOD PACKAGING MARKET, BY PRODUCT, 2018–2021 (MILLION KG)
TABLE 215 REST OF EUROPE: PET FOOD PACKAGING MARKET, BY PRODUCT, 2022–2028 (MILLION KG)
TABLE 216 REST OF EUROPE: PET FOOD PACKAGING MARKET, BY FOOD, 2018–2021 (USD MILLION)
TABLE 217 REST OF EUROPE: PET FOOD PACKAGING MARKET, BY FOOD, 2022–2028 (USD MILLION)
TABLE 218 REST OF EUROPE: PET FOOD PACKAGING MARKET, BY FOOD, 2018–2021 (MILLION KG)
TABLE 219 REST OF EUROPE: PET FOOD PACKAGING MARKET, BY FOOD, 2022–2028 (MILLION KG)
TABLE 220 MIDDLE EAST & AFRICA: PET FOOD PACKAGING MARKET, BY COUNTRY, 2018–2021 (USD MILLION)
TABLE 221 MIDDLE EAST & AFRICA: PET FOOD PACKAGING MARKET, BY COUNTRY, 2022–2028 (USD MILLION)
TABLE 222 MIDDLE EAST & AFRICA: PET FOOD PACKAGING MARKET, BY COUNTRY, 2018–2021 (MILLION KG)
TABLE 223 MIDDLE EAST & AFRICA: PET FOOD PACKAGING MARKET, BY COUNTRY, 2022–2028 (MILLION KG)
TABLE 224 MIDDLE EAST & AFRICA: PET FOOD PACKAGING MARKET, BY MATERIAL, 2018–2021 (USD MILLION)
TABLE 225 MIDDLE EAST & AFRICA: PET FOOD PACKAGING MARKET, BY MATERIAL, 2022–2028 (USD MILLION)
TABLE 226 MIDDLE EAST & AFRICA: PET FOOD PACKAGING MARKET, BY MATERIAL, 2018–2021 (MILLION KG)
TABLE 227 MIDDLE EAST & AFRICA: PET FOOD PACKAGING MARKET, BY MATERIAL, 2022–2028 (MILLION KG)
TABLE 228 MIDDLE EAST & AFRICA: PET FOOD PACKAGING MARKET, BY PRODUCT, 2018–2021 (USD MILLION)
TABLE 229 MIDDLE EAST & AFRICA: PET FOOD PACKAGING MARKET, BY PRODUCT, 2022–2028 (USD MILLION)
TABLE 230 MIDDLE EAST & AFRICA: PET FOOD PACKAGING MARKET, BY PRODUCT, 2018–2021 (MILLION KG)
TABLE 231 MIDDLE EAST & AFRICA: PET FOOD PACKAGING MARKET, BY PRODUCT, 2022–2028 (MILLION KG)
TABLE 232 MIDDLE EAST & AFRICA: PET FOOD PACKAGING MARKET, BY FOOD, 2018–2021 (USD MILLION)
TABLE 233 MIDDLE EAST & AFRICA: PET FOOD PACKAGING MARKET, BY FOOD, 2022–2028 (USD MILLION)
TABLE 234 MIDDLE EAST & AFRICA: PET FOOD PACKAGING MARKET, BY FOOD, 2018–2021 (MILLION KG)
TABLE 235 MIDDLE EAST & AFRICA: PET FOOD PACKAGING MARKET, BY FOOD, 2022–2028 (MILLION KG)
TABLE 236 MIDDLE EAST & AFRICA: PET FOOD PACKAGING MARKET, BY ANIMAL, 2018–2021 (USD MILLION)
TABLE 237 MIDDLE EAST & AFRICA: PET FOOD PACKAGING MARKET, BY ANIMAL, 2022–2028 (USD MILLION)
TABLE 238 MIDDLE EAST & AFRICA: PET FOOD PACKAGING MARKET, BY ANIMAL, 2018–2021 (MILLION KG)
TABLE 239 MIDDLE EAST & AFRICA: PET FOOD PACKAGING MARKET, BY ANIMAL, 2022–2028 (MILLION KG)
TABLE 240 TURKEY: PET FOOD PACKAGING MARKET, BY PRODUCT, 2018–2021 (USD MILLION)
TABLE 241 TURKEY: PET FOOD PACKAGING MARKET, BY PRODUCT, 2022–2028 (USD MILLION)
TABLE 242 TURKEY: PET FOOD PACKAGING MARKET, BY PRODUCT, 2018–2021 (MILLION KG)
TABLE 243 TURKEY: PET FOOD PACKAGING MARKET, BY PRODUCT, 2022–2028 (MILLION KG)
TABLE 244 TURKEY: PET FOOD PACKAGING MARKET, BY FOOD, 2018–2021 (USD MILLION)
TABLE 245 TURKEY: PET FOOD PACKAGING MARKET, BY FOOD, 2022–2028 (USD MILLION)
TABLE 246 TURKEY: PET FOOD PACKAGING MARKET, BY FOOD, 2018–2021 (MILLION KG)
TABLE 247 TURKEY: PET FOOD PACKAGING MARKET, BY FOOD, 2022–2028 (MILLION KG)
TABLE 248 UAE: PET FOOD PACKAGING MARKET, BY PRODUCT, 2018–2021 (USD MILLION)
TABLE 249 UAE: PET FOOD PACKAGING MARKET, BY PRODUCT, 2022–2028 (USD MILLION)
TABLE 250 UAE: PET FOOD PACKAGING MARKET, BY PRODUCT, 2018–2021 (MILLION KG)
TABLE 251 UAE: PET FOOD PACKAGING MARKET, BY PRODUCT, 2022–2028 (MILLION KG)
TABLE 252 UAE: PET FOOD PACKAGING MARKET, BY FOOD, 2018–2021 (USD MILLION)
TABLE 253 UAE: PET FOOD PACKAGING MARKET, BY FOOD, 2022–2028 (USD MILLION)
TABLE 254 UAE: PET FOOD PACKAGING MARKET, BY FOOD, 2018–2021 (MILLION KG)
TABLE 255 UAE: PET FOOD PACKAGING MARKET, BY FOOD, 2022–2028 (MILLION KG)
TABLE 256 SAUDI ARABIA: PET FOOD PACKAGING MARKET, BY PRODUCT, 2018–2021 (USD MILLION)
TABLE 257 SAUDI ARABIA: PET FOOD PACKAGING MARKET, BY PRODUCT, 2022–2028 (USD MILLION)
TABLE 258 SAUDI ARABIA: PET FOOD PACKAGING MARKET, BY PRODUCT, 2018–2021 (MILLION KG)
TABLE 259 SAUDI ARABIA: PET FOOD PACKAGING MARKET, BY PRODUCT, 2022–2028 (MILLION KG)
TABLE 260 SAUDI ARABIA: PET FOOD PACKAGING MARKET, BY FOOD, 2018–2021 (USD MILLION)
TABLE 261 SAUDI ARABIA: PET FOOD PACKAGING MARKET, BY FOOD, 2022–2028 (USD MILLION)
TABLE 262 SAUDI ARABIA: PET FOOD PACKAGING MARKET, BY FOOD, 2018–2021 (MILLION KG)
TABLE 263 SAUDI ARABIA: PET FOOD PACKAGING MARKET, BY FOOD, 2022–2028 (MILLION KG)
TABLE 264 SOUTH AFRICA: PET FOOD PACKAGING MARKET, BY PRODUCT, 2018–2021 (USD MILLION)
TABLE 265 SOUTH AFRICA: PET FOOD PACKAGING MARKET, BY PRODUCT, 2022–2028 (USD MILLION)
TABLE 266 SOUTH AFRICA: PET FOOD PACKAGING MARKET, BY PRODUCT, 2018–2021 (MILLION KG)
TABLE 267 SOUTH AFRICA: PET FOOD PACKAGING MARKET, BY PRODUCT, 2022–2028 (MILLION KG)
TABLE 268 SOUTH AFRICA: PET FOOD PACKAGING MARKET, BY FOOD, 2018–2021 (USD MILLION)
TABLE 269 SOUTH AFRICA: PET FOOD PACKAGING MARKET, BY FOOD, 2022–2028 (USD MILLION)
TABLE 270 SOUTH AFRICA: PET FOOD PACKAGING MARKET, BY FOOD, 2018–2021 (MILLION KG)
TABLE 271 SOUTH AFRICA: PET FOOD PACKAGING MARKET, BY FOOD, 2022–2028 (MILLION KG)
TABLE 272 REST OF MIDDLE EAST & AFRICA: PET FOOD PACKAGING MARKET, BY PRODUCT, 2018–2021 (USD MILLION)
TABLE 273 REST OF MIDDLE EAST & AFRICA: PET FOOD PACKAGING MARKET, BY PRODUCT, 2022–2028 (USD MILLION)
TABLE 274 REST OF MIDDLE EAST & AFRICA: PET FOOD PACKAGING MARKET, BY PRODUCT, 2018–2021 (MILLION KG)
TABLE 275 REST OF MIDDLE EAST & AFRICA: PET FOOD PACKAGING MARKET, BY PRODUCT, 2022–2028 (MILLION KG)
TABLE 276 REST OF MIDDLE EAST & AFRICA: PET FOOD PACKAGING MARKET, BY FOOD, 2018–2021 (USD MILLION)
TABLE 277 REST OF MIDDLE EAST & AFRICA: PET FOOD PACKAGING MARKET, BY FOOD, 2022–2028 (USD MILLION)
TABLE 278 REST OF MIDDLE EAST & AFRICA: PET FOOD PACKAGING MARKET, BY FOOD, 2018–2021 (MILLION KG)
TABLE 279 REST OF MIDDLE EAST & AFRICA: PET FOOD PACKAGING MARKET, BY FOOD, 2022–2028 (MILLION KG)
TABLE 280 SOUTH AMERICA: PET FOOD PACKAGING MARKET, BY COUNTRY, 2018–2021 (USD MILLION)
TABLE 281 SOUTH AMERICA: PET FOOD PACKAGING MARKET, BY COUNTRY, 2022–2028 (USD MILLION)
TABLE 282 SOUTH AMERICA: PET FOOD PACKAGING MARKET, BY COUNTRY, 2018–2021 (MILLION KG)
TABLE 283 SOUTH AMERICA: PET FOOD PACKAGING MARKET, BY COUNTRY, 2022–2028 (MILLION KG)
TABLE 284 SOUTH AMERICA: PET FOOD PACKAGING MARKET, BY MATERIAL, 2018–2021 (USD MILLION)
TABLE 285 SOUTH AMERICA: PET FOOD PACKAGING MARKET, BY MATERIAL, 2022–2028 (USD MILLION)
TABLE 286 SOUTH AMERICA: PET FOOD PACKAGING MARKET, BY MATERIAL, 2018–2021 (MILLION KG)
TABLE 287 SOUTH AMERICA: PET FOOD PACKAGING MARKET, BY MATERIAL, 2022–2028 (MILLION KG)
TABLE 288 SOUTH AMERICA: PET FOOD PACKAGING MARKET, BY PRODUCT, 2018–2021 (USD MILLION)
TABLE 289 SOUTH AMERICA: PET FOOD PACKAGING MARKET, BY PRODUCT, 2022–2028 (USD MILLION)
TABLE 290 SOUTH AMERICA: PET FOOD PACKAGING MARKET, BY PRODUCT, 2018–2021 (MILLION KG)
TABLE 291 SOUTH AMERICA: PET FOOD PACKAGING MARKET, BY PRODUCT, 2022–2028 (MILLION KG)
TABLE 292 SOUTH AMERICA: PET FOOD PACKAGING MARKET, BY FOOD, 2018–2021 (USD MILLION)
TABLE 293 SOUTH AMERICA: PET FOOD PACKAGING MARKET, BY FOOD, 2022–2028 (USD MILLION)
TABLE 294 SOUTH AMERICA: PET FOOD PACKAGING MARKET, BY FOOD, 2018–2021 (MILLION KG)
TABLE 295 SOUTH AMERICA: PET FOOD PACKAGING MARKET, BY FOOD, 2022–2028 (MILLION KG)
TABLE 296 SOUTH AMERICA: PET FOOD PACKAGING MARKET, BY ANIMAL, 2018–2021 (USD MILLION)
TABLE 297 SOUTH AMERICA: PET FOOD PACKAGING MARKET, BY ANIMAL, 2022–2028 (USD MILLION)
TABLE 298 SOUTH AMERICA: PET FOOD PACKAGING MARKET, BY ANIMAL, 2018–2021 (MILLION KG)
TABLE 299 SOUTH AMERICA: PET FOOD PACKAGING MARKET, BY ANIMAL, 2022–2028 (MILLION KG)
TABLE 300 BRAZIL: PET FOOD PACKAGING MARKET, BY PRODUCT, 2018–2021 (USD MILLION)
TABLE 301 BRAZIL: PET FOOD PACKAGING MARKET, BY PRODUCT, 2022–2028 (USD MILLION)
TABLE 302 BRAZIL: PET FOOD PACKAGING MARKET, BY PRODUCT, 2018–2021 (MILLION KG)
TABLE 303 BRAZIL: PET FOOD PACKAGING MARKET, BY PRODUCT, 2022–2028 (MILLION KG)
TABLE 304 BRAZIL: PET FOOD PACKAGING MARKET, BY FOOD, 2018–2021 (USD MILLION)
TABLE 305 BRAZIL: PET FOOD PACKAGING MARKET, BY FOOD, 2022–2028 (USD MILLION)
TABLE 306 BRAZIL: PET FOOD PACKAGING MARKET, BY FOOD, 2018–2021 (MILLION KG)
TABLE 307 BRAZIL: PET FOOD PACKAGING MARKET, BY FOOD, 2022–2028 (MILLION KG)
TABLE 308 ARGENTINA: PET FOOD PACKAGING MARKET, BY PRODUCT, 2018–2021 (USD MILLION)
TABLE 309 ARGENTINA: PET FOOD PACKAGING MARKET, BY PRODUCT, 2022–2028 (USD MILLION)
TABLE 310 ARGENTINA: PET FOOD PACKAGING MARKET, BY PRODUCT, 2018–2021 (MILLION KG)
TABLE 311 ARGENTINA: PET FOOD PACKAGING MARKET, BY PRODUCT, 2022–2028 (MILLION KG)
TABLE 312 ARGENTINA: PET FOOD PACKAGING MARKET, BY FOOD, 2018–2021 (USD MILLION)
TABLE 313 ARGENTINA: PET FOOD PACKAGING MARKET, BY FOOD, 2022–2028 (USD MILLION)
TABLE 314 ARGENTINA: PET FOOD PACKAGING MARKET, BY FOOD, 2018–2021 (MILLION KG)
TABLE 315 ARGENTINA: PET FOOD PACKAGING MARKET, BY FOOD, 2022–2028 (MILLION KG)
TABLE 316 REST OF SOUTH AMERICA: PET FOOD PACKAGING MARKET, BY PRODUCT, 2018–2021 (USD MILLION)
TABLE 317 REST OF SOUTH AMERICA: PET FOOD PACKAGING MARKET, BY PRODUCT, 2022–2028 (USD MILLION)
TABLE 318 REST OF SOUTH AMERICA: PET FOOD PACKAGING MARKET, BY PRODUCT, 2018–2021 (MILLION KG)
TABLE 319 REST OF SOUTH AMERICA: PET FOOD PACKAGING MARKET, BY PRODUCT, 2022–2028 (MILLION KG)
TABLE 320 REST OF SOUTH AMERICA: PET FOOD PACKAGING MARKET, BY FOOD, 2018–2021 (USD MILLION)
TABLE 321 REST OF SOUTH AMERICA: PET FOOD PACKAGING MARKET, BY FOOD, 2022–2028 (USD MILLION)
TABLE 322 REST OF SOUTH AMERICA: PET FOOD PACKAGING MARKET, BY FOOD, 2018–2021 (MILLION KG)
TABLE 323 REST OF SOUTH AMERICA: PET FOOD PACKAGING MARKET, BY FOOD, 2022–2028 (MILLION KG)
TABLE 324 OVERVIEW OF STRATEGIES DEPLOYED BY KEY PLAYERS
TABLE 325 PET FOOD PACKAGING MARKET: DEGREE OF COMPETITION
TABLE 326 PET FOOD PACKAGING MARKET REGION FOOTPRINT
TABLE 327 KEY STARTUPS/SMES IN PET FOOD PACKAGING MARKET
TABLE 328 PRODUCT/SERVICE LAUNCHES, 2019–2023
TABLE 329 DEALS, 2019–2023
TABLE 330 OTHERS, 2019–2023
TABLE 331 AMCOR PLC: COMPANY OVERVIEW
TABLE 332 AMCOR PLC: PRODUCTS/SOLUTIONS/SERVICES OFFERED
TABLE 333 AMCOR PLC: PRODUCT/SERVICE LAUNCHES
TABLE 334 AMCOR PLC: DEALS
TABLE 335 AMCOR PLC: OTHERS
TABLE 336 MONDI PLC: COMPANY OVERVIEW
TABLE 337 MONDI PLC: PRODUCTS/SOLUTIONS/SERVICES OFFERED
TABLE 338 MONDI PLC: PRODUCT/SERVICE LAUNCHES
TABLE 339 MONDI PLC: DEALS
TABLE 340 MONDI PLC: OTHERS
TABLE 341 SONOCO PRODUCTS COMPANY: COMPANY OVERVIEW
TABLE 342 SONOCO PRODUCTS COMPANY: PRODUCTS/SOLUTIONS/SERVICES OFFERED
TABLE 343 SONOCO PRODUCTS COMPANY: PRODUCT/SOLUTION/SERVICE LAUNCHES
TABLE 344 SONOCO PRODUCTS COMPANY: DEALS
TABLE 345 HUHTAMÄKI OYJ: COMPANY OVERVIEW
TABLE 346 HUHTAMÄKI OYJ: PRODUCTS/SOLUTIONS/SERVICES OFFERED
TABLE 347 HUHTAMÄKI OYJ : PRODUCT/SOLUTION/SERVICE LAUNCHES
TABLE 348 HUHTAMÄKI OYJ: DEALS
TABLE 349 HUHTAMÄKI OYJ: OTHERS
TABLE 350 BERRY GLOBAL GROUP, INC.: COMPANY OVERVIEW
TABLE 351 BERRY GLOBAL GROUP, INC.: PRODUCTS/SOLUTIONS/SERVICES OFFERED
TABLE 352 BERRY GLOBAL GROUP, INC.: DEALS
TABLE 353 BERRY GLOBAL GROUP, INC.: OTHERS
TABLE 354 CONSTANTIA FLEXIBLES INTERNATIONAL GMBH: COMPANY OVERVIEW
TABLE 355 CONSTANTIA FLEXIBLES INTERNATIONAL GMBH: PRODUCTS/SOLUTIONS/ SERVICES OFFERED
TABLE 356 CONSTANTIA FLEXIBLES INTERNATIONAL GMBH: DEALS
TABLE 357 CONSTANTIA FLEXIBLES INTERNATIONAL GMBH: OTHERS
TABLE 358 CROWN HOLDINGS, INC.: COMPANY OVERVIEW
TABLE 359 CROWN HOLDINGS, INC.: PRODUCTS/SOLUTIONS SERVICES OFFERED
TABLE 360 CROWN HOLDINGS, INC.: OTHERS
TABLE 361 SMURFIT KAPPA GROUP PLC.: COMPANY OVERVIEW
TABLE 362 SMURFIT KAPPA GROUP PLC: PRODUCTS/SOLUTIONS/SERVICES OFFERED
TABLE 363 SMURFIT KAPPA GROUP PLC: DEALS
TABLE 364 SMURFIT KAPPA GROUP PLC: OTHERS
TABLE 365 ARDAGH GROUP S.A.: COMPANY OVERVIEW
TABLE 366 ARDAGH GROUP S.A.: PRODUCTS/SOLUTIONS/SERVICES OFFERED
TABLE 367 ARDAGH GROUP S.A.: OTHERS
TABLE 368 TRANSCONTINENTAL INC.: COMPANY OVERVIEW
TABLE 369 TRANSCONTINENTAL INC.: PRODUCTS/SOLUTIONS/SERVICES OFFERED
TABLE 370 TRANSCONTINENTAL, INC.: DEALS
TABLE 371 TRANSCONTINENTAL, INC.: OTHERS
TABLE 372 WINPAK LTD.: COMPANY OVERVIEW
TABLE 373 WINPAK LTD.: PRODUCTS/SOLUTIONS/SERVICES OFFERED
TABLE 374 SILGAN HOLDINGS INC.: COMPANY OVERVIEW
TABLE 375 SILGAN HOLDINGS, INC.: PRODUCTS/SOLUTIONS/SERVICES OFFERED
TABLE 376 SILGAN HOLDINGS INC.: DEALS
TABLE 377 SILGAN HOLDINGS, INC.: OTHERS
TABLE 378 SEALED AIR CORPORATION: COMPANY OVERVIEW
TABLE 379 SEALED AIR CORPORATION: PRODUCTS/SOLUTIONS/SERVICES OFFERED
TABLE 380 SEALED AIR CORPORATION: DEALS
TABLE 381 SEALED AIR CORPORATION: OTHERS
TABLE 382 E-COMMERCE PACKAGING MARKET, BY PRODUCT TYPE, 2021–2028 (USD MILLION)
TABLE 383 E-COMMERCE PACKAGING MARKET, BY PRODUCT TYPE, 2021–2028 (KILOTON)
TABLE 384 E-COMMERCE PACKAGING MARKET, BY MATERIAL, 2021–2028 (USD MILLION)
TABLE 385 E-COMMERCE PACKAGING MARKET, BY MATERIAL, 2021–2028 (KILOTON)
TABLE 386 E-COMMERCE PACKAGING MARKET, BY APPLICATION, 2021–2028 (USD MILLION)
TABLE 387 E-COMMERCE PACKAGING MARKET, BY APPLICATION, 2021–2028 (KILOTON)
TABLE 388 E-COMMERCE PACKAGING MARKET, BY REGION, 2021–2028 (USD MILLION)
TABLE 389 E-COMMERCE PACKAGING MARKET, BY REGION, 2021–2028 (KILOTON)
 
 
LIST OF FIGURES (54 FIGURE)
 
FIGURE 1 PET FOOD PACKAGING MARKET SEGMENTATION
FIGURE 2 PET FOOD PACKAGING MARKET: RESEARCH DESIGN
FIGURE 3 PET FOOD PACKAGING MARKET: DATA TRIANGULATION
FIGURE 4 PLASTIC SEGMENT TO ACCOUNT FOR LARGEST MARKET SHARE IN 2028
FIGURE 5 METAL CANS TO RECORD FASTEST GROWTH DURING FORECAST PERIOD
FIGURE 6 DRY FOOD SEGMENT TO DOMINATE MARKET DURING FORECAST PERIOD
FIGURE 7 DOG FOOD SEGMENT TO HOLD LARGEST SHARE IN 2028
FIGURE 8 ASIA PACIFIC TO RECORD FASTEST GROWTH DURING FORECAST PERIOD
FIGURE 9 INCREASED AWARENESS TOWARD SUSTAINABLE PACKAGING SOLUTIONS
FIGURE 10 DOG FOOD AND CHINA WERE MAJOR STAKEHOLDERS IN 2022
FIGURE 11 PLASTIC SEGMENT TO LEAD MARKET DURING FORECAST PERIOD
FIGURE 12 BAGS TO DOMINATE MARKET DURING FORECAST PERIOD
FIGURE 13 DRY FOOD SEGMENT TO ACCOUNT FOR LARGEST SHARE IN 2028
FIGURE 14 CAT FOOD TO RECORD HIGHEST GROWTH DURING FORECAST PERIOD
FIGURE 15 JAPAN TO BE FASTEST-GROWING MARKET DURING FORECAST PERIOD
FIGURE 16 PET FOOD PACKAGING MARKET DYNAMICS
FIGURE 17 US PET INDUSTRY EXPENDITURES 2018–2022
FIGURE 18 OPEC BASKET CRUDE OIL PRICE, 2014–2022
FIGURE 19 US E-COMMERCE SALES, 2020–2022
FIGURE 20 PORTER’S FIVE FORCES ANALYSIS
FIGURE 21 VALUE/SUPPLY CHAIN ANALYSIS
FIGURE 22 TRENDS AND DISRUPTIONS IMPACTING CUSTOMER BUSINESS
FIGURE 23 KEY PLAYERS IN PET FOOD PACKAGING MARKET ECOSYSTEM
FIGURE 24 INFLUENCE OF STAKEHOLDERS ON BUYING PROCESS OF PET FOOD PACKAGING PRODUCTS
FIGURE 25 KEY BUYING CRITERIA FOR PET FOOD PACKAGING PRODUCTS
FIGURE 26 PATENTS GRANTED, 2013–2022
FIGURE 27 PATENTS REGISTERED, 2013–2022
FIGURE 28 NUMBER OF PATENTS, BY JURISDICTION
FIGURE 29 TOP PATENT APPLICANTS
FIGURE 30 AVERAGE SELLING PRICE, BY REGION (USD/KG)
FIGURE 31 PET FOOD PACKAGING MARKET, BY MATERIAL, 2023–2028
FIGURE 32 PET FOOD PACKAGING MARKET, BY PRODUCT, 2023–2028
FIGURE 33 PET FOOD PACKAGING MARKET, BY FOOD, 2023–2028
FIGURE 34 PET FOOD PACKAGING MARKET, BY ANIMAL, 2023–2028
FIGURE 35 PET FOOD PACKAGING MARKET, BY REGION, 2023–2028
FIGURE 36 NORTH AMERICA: PET FOOD PACKAGING MARKET SNAPSHOT
FIGURE 37 EUROPE: PET FOOD PACKAGING MARKET SNAPSHOT
FIGURE 38 REVENUE OF KEY PLAYERS, 2018–2022
FIGURE 39 MARKET SHARE OF KEY PLAYERS IN PET FOOD PACKAGING MARKET, 2022
FIGURE 40 COMPANY EVALUATION MATRIX, 2022
FIGURE 41 STARTUP/SME EVALUATION MATRIX, 2022
FIGURE 42 AMCOR PLC: COMPANY SNAPSHOT
FIGURE 43 MONDI PLC: COMPANY SNAPSHOT
FIGURE 44 SONOCO PRODUCTS COMPANY: COMPANY SNAPSHOT
FIGURE 45 HUHTAMÄKI OYJ: COMPANY SNAPSHOT
FIGURE 46 BERRY GLOBAL GROUP, INC.: COMPANY SNAPSHOT
FIGURE 47 CONSTANTIA FLEXIBLES INTERNATIONAL GMBH: COMPANY SNAPSHOT
FIGURE 48 CROWN HOLDINGS, INC.: COMPANY SNAPSHOT
FIGURE 49 SMURFIT KAPPA GROUP PLC: COMPANY SNAPSHOT
FIGURE 50 ARDAGH GROUP S.A.: COMPANY SNAPSHOT
FIGURE 51 TRANSCONTINENTAL INC.: COMPANY SNAPSHOT
FIGURE 52 WINPAK LTD.: COMPANY SNAPSHOT
FIGURE 53 SILGAN HOLDINGS INC.: COMPANY SNAPSHOT
FIGURE 54 SEALED AIR CORPORATION: COMPANY SNAPSHOT

The study involved four major activities for estimating the current global size of the pet food packaging market. The exhaustive secondary research was carried out to collect information on the market, the peer market, and the parent market. The next step was to validate these findings, assumptions and sizes with the industry experts across the value chain of pet food packaging through primary research. Both the top-down and bottom-up approaches were employed to estimate the overall size of the pet food packaging market. After that, market breakdown and data triangulation procedures were used to estimate the size of different segments and sub-segments of the market.

Secondary Research

In the secondary research process, various secondary sources such as Hoovers, Factiva, Bloomberg BusinessWeek, and Dun & Bradstreet were referred to, to identify and collect information for this study on the pet food packaging market. These secondary sources included annual reports, press releases & investor presentations of companies, white papers, certified publications, articles by recognized authors, regulatory bodies, trade directories, and databases.

Primary Research

Various primary sources from both the supply and demand sides of the pet food packaging market were interviewed to obtain qualitative and quantitative information. The primary sources from the supply-side included industry experts, such as Chief Executive Officers (CEOs), vice presidents, marketing directors, sales professionals, and related key executives from various leading companies and organizations operating in the pet food packaging industry. The primary sources from the demand side included key executives from banks, government organizations, and educational institutions. The breakdown of the profiles of primary respondents is as follows:

Pet Food Packaging Market Size, and Share

To know about the assumptions considered for the study, download the pdf brochure

Market Size Estimation

  • The top-down and bottom-up approaches were used to estimate and validate the size of the pet food packaging market.
  • The key players in the industry and market were identified through extensive secondary research.
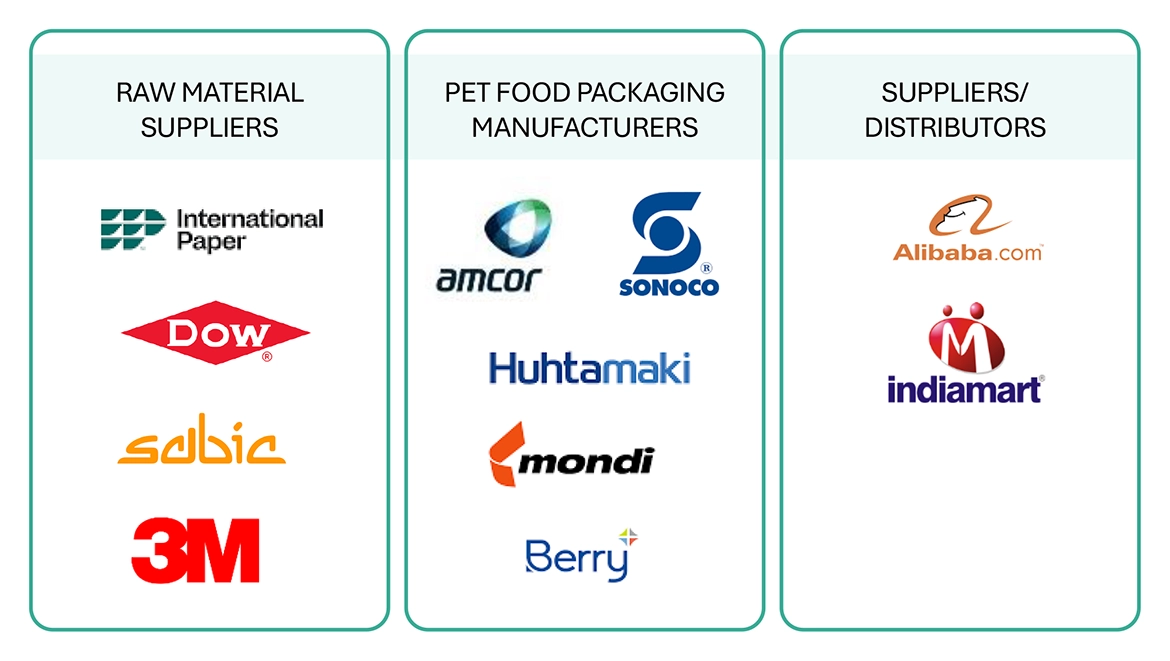
  • The industry’s supply chain value and the market size in terms of value and volume were determined through primary and secondary research.
  • All percentage shares, splits, and breakdowns were assessed using secondary sources and verified through primary sources.
  • All possible parameters that affect the markets covered in this research study were accounted for, viewed in extensive detail, verified through primary research, and analyzed to obtain the final quantitative and qualitative data.
  • The research involved analyzing reports, reviews, and newsletters from key market players, as well as conducting extensive interviews with leaders such as directors and marketing executives.
  • The following figure illustrates the overall market size estimation process employed for this study.

Pet Food Packaging Market Size, and Share

To know about the assumptions considered for the study, Request for Free Sample Report

Market Defination

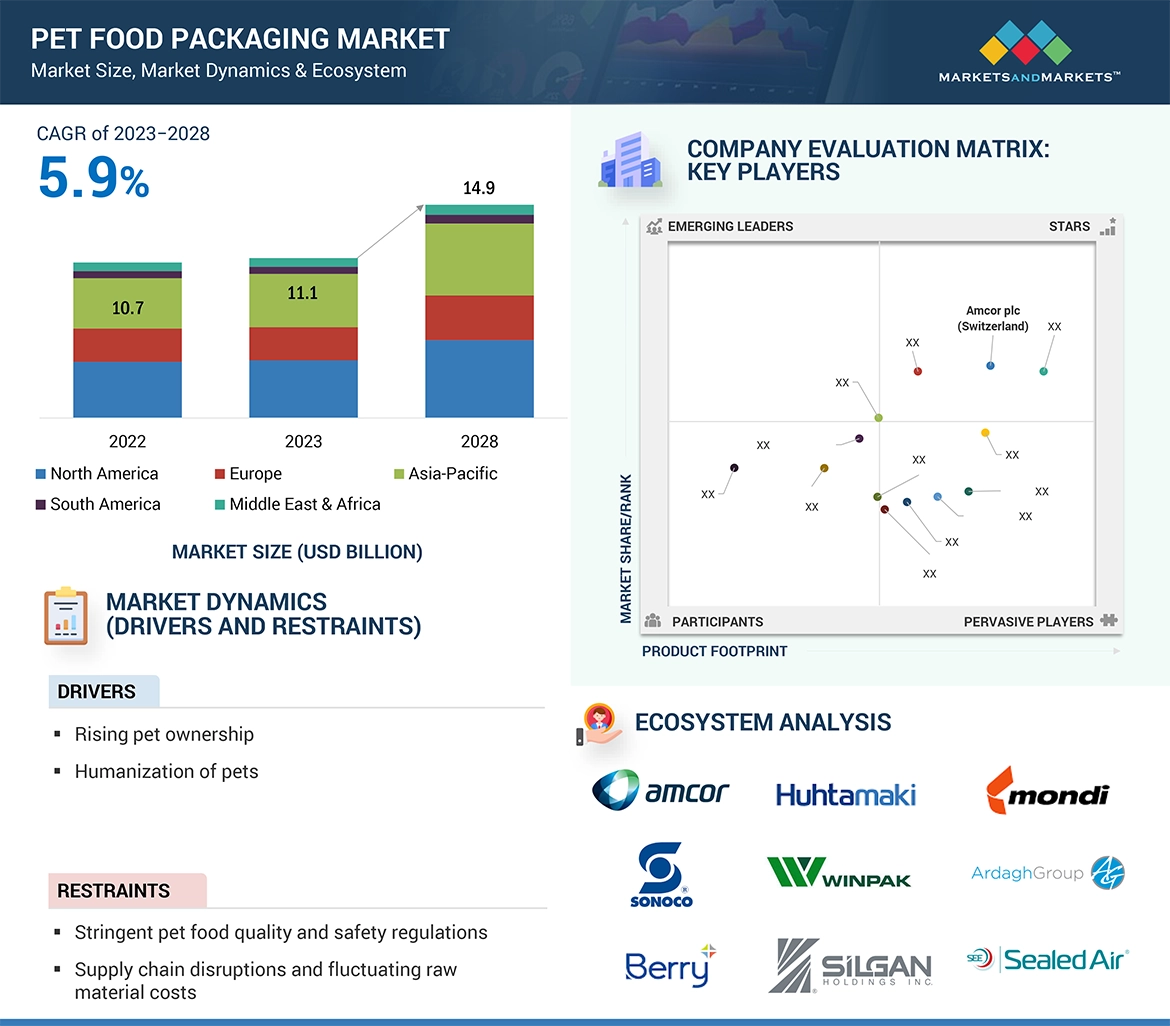
As per FEDIAF, pet food is defined as “products produced by a pet food manufacturer, whether processed, partially processed or unprocessed, intended to be ingested by pet animals after placing on the market”. Pet food packaging is a dynamic system, which includes the primary product i.e. pet food with packaging, which has visual and structural characteristics and is used to protect the food and aid in its transportation and distribution to consumers in a safe and sound condition. The most commonly used products for commercial packaging of pet food are paper, paperboard, and plastics. Glass and metal are also used for liquid and semi-solid food products.

Data Triangulation

The total market was split into several segments and subsegments after arriving at the overall size of the market using the process explained above. Market breakdown and data triangulation procedures were used, wherever applicable, to complete the overall market engineering process and derive the exact statistics for all segments and subsegments. The data was triangulated by studying various factors and trends from the demand and supply sides. The market was validated using the top-down and bottom-up approaches.

Research Objectives

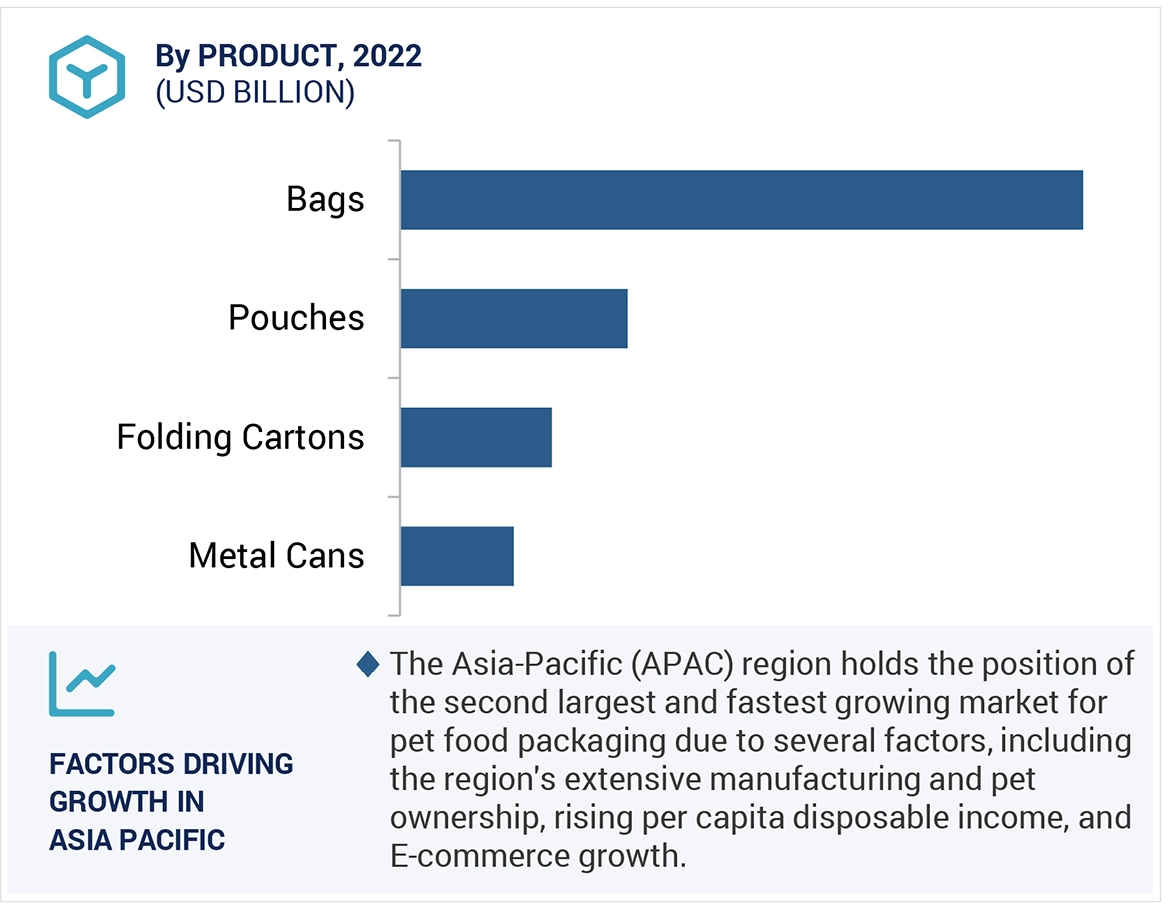
  • To define, analyze, and project the size of the pet food packaging market in terms of value and volume based on product type, material type, food type, animal type, and region
  • To project the size of the market and its segments in terms of value and volume, with respect to the five main regions, namely, North America, Europe, APAC, the Middle East & Africa, and South America
  • To provide detailed information about the key factors, such as drivers, restraints, opportunities, and challenges influencing the growth of the market
  • To strategically analyze the micro markets with respect to individual growth trends, future prospects, and their contribution to the total market
  • To analyze the opportunities in the market for stakeholders and provide a detailed competitive landscape of the market leaders
  • To analyze the competitive developments, such as new product launches, expansions, and acquisitions, in the pet food packaging market
  • To strategically profile the key players operating in the market and comprehensively analyze their market shares and core competencies

Available Customizations

With the given market data, MarketsandMarkets offers customizations according to client-specific needs.

The following customization options are available for the pet food packaging report:

Product Analysis

  • Product matrix, which offers a detailed comparison of the product portfolio of companies

Regional Analysis

  • Further analysis of the pet food packaging market for additional countries

Company Information

  • Detailed analysis and profiling of additional market players (up to five)
Custom Market Research Services

We will customize the research for you, in case the report listed above does not meet with your exact requirements. Our custom research will comprehensively cover the business information you require to help you arrive at strategic and profitable business decisions.

Request Customization
Report Code
PK 3474
Published ON
Nov, 2023
Choose License Type
BUY NOW
  • SHARE
X
Request Customization
Speak to Analyst
Speak to Analyst
OR FACE-TO-FACE MEETING
PERSONALIZE THIS RESEARCH
  • Triangulate with your Own Data
  • Get Data as per your Format and Definition
  • Gain a Deeper Dive on a Specific Application, Geography, Customer or Competitor
  • Any level of Personalization
REQUEST A FREE CUSTOMIZATION
LET US HELP YOU!
  • What are the Known and Unknown Adjacencies Impacting the Pet Food Packaging Market
  • What will your New Revenue Sources be?
  • Who will be your Top Customer; what will make them switch?
  • Defend your Market Share or Win Competitors
  • Get a Scorecard for Target Partners
CUSTOMIZED WORKSHOP REQUEST
+1-888-600-6441
  • Call Us
  • +1-888-600-6441 (Corporate office hours)
  • +1-888-600-6441 (US/Can toll free)
  • +44-800-368-9399 (UK office hours)
CONNECT WITH US
ABOUT TRUST ONLINE
©2023 MarketsandMarkets Research Private Ltd. All rights reserved
DMCA.com Protection Status Website Feedback