
Metals Cans Market

Metals Cans Market by Fabrication type (2 Piece Cans, 3 Piece Cans), Application (Food and Beverage), Coating Type, Material Type, Beverage Can Capacity, Degree of Internal Pressure, and Region - Global Forecast to 2029


OVERVIEW

Source: Secondary Research, Interviews with Experts, MarketsandMarkets Analysis
The metal cans market is estimated at USD 50.42 billion in 2024 and is projected to reach USD 70.72 billion by 2029, at a CAGR of 7.0% during the same period. Metal cans are widely used for packaging various food & beverage products because they maintain quality in terms of appearance, texture, flavor, and nutritional value while ensuring food safety. These aspects drive ongoing innovations in the metal cans market, where manufacturers prioritize food safety. However, growth is constrained by strict regulations on materials like aluminum and steel and inadequate infrastructure in emerging countries.
Market Size and Forecast:
- Market Size Value in 2023: USD 47.39 Billion
- Market Size Value in 2024: USD 50.42 Billion
- Revenue Forecast in 2029: USD 70.72 Billion
- Growth Rate: CAGR of 7.0% from 2024 to 2029
- Base year: 2023
- Forecast period: 2024–2029
- Europe is expected to dominate the metal cans market, with a share of 24.6% in 2025.
- the 2-piece segment is expected to register the highest CAGR of 7.02% during the forecast period.
Key Market Trends and Insights
- By Application: Increasing adoption of metal cans across food & beverages, personal care, pharmaceuticals, and industrial packaging applications is supporting market growth due to their durability, recyclability, and effective product preservation capabilities.
-
Growth Drivers: Metal cans provide excellent product protection, extended shelf life, high recyclability, durability, and efficient transportation, making them a preferred packaging solution across multiple end-use industries.
- Growing Trends: Manufacturers are increasingly adopting lightweight can designs, sustainable packaging solutions, advanced printing technologies, and high-recycled-content materials to meet consumer preferences and environmental regulations.
- Growth Opportunities: Rising demand for sustainable packaging, increasing consumption of canned foods and beverages, expanding recycling infrastructure, growth in ready-to-eat food products, and increasing adoption of metal packaging in emerging economies are creating substantial growth opportunities for the metals cans market.
KEY TAKEAWAYS
- Europe is expected to dominate the metal cans market, with a share of 24.6% in 2025.
- By fabrication type, the 2-piece segment is expected to register the highest CAGR of 7.02% during the forecast period.
- By material, the aluminum segment is projected to grow at the fastest rate from 2025 to 2030.
- By coating type, the bright coating segment is expected to dominate the market.
- By application, the food segment will grow at the fastest rate during the forecast period.
- By beverage capacity, the 330ml segment will dominate the market from 2025 to 2030.
- Key players in the metal cans market include Crown Holdings Inc., Ball Corporation, Silgan Holdings Inc., and Ardagh Group due to their specialization in manufacturing high-performance aluminum and steel cans.
- Key startups and emerging players in the metal cans market include Universal Can Corporation, Visy, Independent Can Company, Mauser Packaging Solutions, and P. Wilkinson Containers Ltd., which focus on niche can manufacturing, customized metal packaging, eco-efficient production, and innovative lightweight and recyclable metal solutions.
The competitive landscape of the metal cans market is shaped by innovation across fabrication types, materials, coatings, applications, and capacities. Leading players focus on lightweighting, expanding sustainable material use, and developing BPA-free and eco-friendly coatings to address stringent food and beverage safety and sustainability regulations. In fabrication, manufacturers are advancing 2-piece and 3-piece can technologies, with strategies emphasizing recyclability, production efficiency, and reduced carbon footprint. Application-specific targeting is a core approach, with tailored packaging solutions for high-growth segments such as carbonated soft drinks, alcoholic beverages, and energy drinks, as well as long-shelf-life food categories. On the coating side, companies are investing in protective and decorative solutions that enhance shelf life, corrosion resistance, and consumer appeal, often aligned with regional regulatory requirements. From a product portfolio perspective, firms adopt bundled offerings that integrate cans, closures, and coatings, creating end-to-end packaging solutions and securing long-term contracts with brand owners. In terms of capacity and regional focus, players balance innovations in small-volume cans for premium beverages with scaling production of standard sizes for mass-market categories, while expanding presence in emerging markets through localized production and acquisitions.
TRENDS & DISRUPTIONS IMPACTING CUSTOMERS' CUSTOMERS
The metal cans market is undergoing rapid transformation, shaped by both evolving trends and disruptive forces. Key trends include the industry-wide shift toward lightweighting and higher recycled-content aluminium, alongside the growing adoption of BPA-free, water-based, and eco-friendly coatings to address regulatory and consumer safety demands. Premiumization is influencing can design, with more decorative finishes, specialty coatings, and varied capacities (100–330ml) tailored for beverages such as energy drinks, craft beer, and ready-to-drink products. Sustainability remains central, with brand owners and manufacturers investing in closed-loop recycling, carbon reduction strategies, and packaging circularity commitments. Disruption comes from emerging coating technologies that replace traditional epoxy resins, as well as alternative packaging formats such as PET bottles, cartons, and pouches, which challenge can demand in certain segments. At the same time, automation and high-speed manufacturing lines are reshaping production economics, while regional capacity expansions in Asia Pacific and South America are altering competitive dynamics. Evolving consumer preferences for smaller, convenient pack sizes and regulatory pressure for higher recyclability further accelerate change. Ultimately, the market’s trajectory is being defined by the intersection of sustainability, cost competitiveness, and innovation in coating and material technologies.

Source: Secondary Research, Interviews with Experts, MarketsandMarkets Analysis
MARKET DYNAMICS
Level
-
Companies are shifting to lightweight, durable food & beverage cans

-
Rising demand for sustainable and recyclable packaging

Level
-
Move toward alternative packaging options

-
Volatility in raw material (aluminum, steel) prices increases production costs and squeezes manufacturer margins

Level
-
Driving Innovation in metal can packaging: sustainable printing and coating solutions

-
Growing consumption of ready-to-drink beverages, craft beer, and energy drinks is expanding the market for 2-piece beverage cans

Level
-
High usage of plastic packaging due to lower cost

-
Logistics and supply chain disruptions (e.g., geopolitical issues, shipping delays) impact timely availability of cans for beverage companies

Source: Secondary Research, Interviews with Experts, MarketsandMarkets Analysis
Drivers: Companies are shifting to lightweight, durable food & beverage cans
In the food & beverage industry, companies are increasingly adopting lightweight and durable metal cans, leading to significant growth in the metal can market. This trend is driven by a demand for packaging solutions that provide sustainability, protection, and ease of transportation, all while minimizing environmental impact. Lightweight cans are particularly beneficial as they help reduce transportation costs and carbon emissions, which is crucial for companies striving to meet strict environmental goals. Their durability ensures that products remain intact and protected, which is essential for maintaining quality and extending shelf life, especially for beverages and perishable foods. Consumers are becoming more aware of sustainable packaging, prompting manufacturers to focus on metal cans, which are recyclable and maintain their structural integrity across multiple recycling cycles. Consequently, innovations in the metal can industry, such as thinner walls without compromising strength and advances in coating technologies, are enabling companies to provide superior packaging solutions that meet both regulatory standards and consumer expectations. A notable example of this shift is Toyo Seikan, which announced in April 2024 the development of the lightest aluminum double-integrated (DI) can in Japan using Compression Bottom Reform (CBR) technology. This innovation reduces the weight of their 350mL and 500mL cans by up to 2.0 grams, leading to approximately a 9% reduction in greenhouse gas emissions. Similarly, Ball Corporation, in partnership with CavinKare, introduced sustainable retort aluminum cans for milkshakes in April 2024. These two-piece cans are designed for the dairy sector in India and offer reduced transportation costs and improved product freshness, aligning with the growing demand for ready-to-drink beverages and sustainable packaging solutions.
Restraints: Move toward alternative packaging options
The metal cans market faces increasing competition from alternative packaging options like Tetrapaks, pouches, and blister packaging. These alternatives are often cheaper, more convenient, and increasingly preferred by food and beverage companies for their innovative features. Pouch and blister packaging offer several advantages, including reduced material costs compared to traditional rigid packaging and enhanced sustainability. Consequently, many fast-moving consumer goods (FMCG) companies are adopting pouch packaging to offer greater convenience to consumers. Additionally, new designs with easy-open and easy-reclose features are being developed across various market segments. However, the rising cost of final packaging could impact sales. This dual challenge pressures companies to find a balanced approach that integrates both sustainability and cost management.
Opportunities: Driving innovation in metal can packaging: Sustainable printing and coating solutions
With increasing consumer focus on health and sustainability, innovations in metal can packaging are meeting demands for safer, eco-friendly options. BPA-free coatings have become a key selling point, offering non-toxic solutions in response to stricter regulations. Meanwhile, advancements in printing technologies, such as digital printing and high-definition imaging, enable vibrant, customizable designs that reduce waste and enhance brand identity. DataLase's inkless technology, introduced in June 2024, uses specialty pigments that change color with laser wavelengths, eliminating the need for ink and labels. This solution improves recyclability and supports sustainability, while also meeting traceability requirements like Digital Product Passports. Similarly, Ball Corporation’s Eyeris technology, launched in September 2023, delivers photo-realistic imagery on aluminum cans. This printing method spans 360 degrees and utilizes advanced techniques to offer vivid, high-resolution designs that resonate with consumers, with 76% viewing packaging as a key purchase factor. Eyeris also upholds sustainability with aluminum's recyclability. Both innovations from DataLase and Ball Corporation demonstrate the growing trend of combining sustainable packaging with cutting-edge printing and coating technologies. These developments not only address environmental concerns but also enhance consumer engagement, positioning the metal can industry for growth in the face of evolving regulations and market demands.
Challenges: High usage of plastic packaging due to lower cost
Awareness of the benefits of metal packaging for food and beverages is limited in developing countries. The high cost of raw materials like steel and aluminum discourages consumers from choosing canned products. A significant challenge for metal can manufacturers is the increasing use of polyethylene terephthalate (PET) bottles, particularly for beverages. Other sustainable packaging materials, such as paper, glass, and plastic, are more cost-effective than metal. Alternatives to metal cans, including Tetra Pak cartons, glass bottles, PET, and flexible pouches, as well as other innovative packaging methods, are also gaining popularity. The growing use of these packaging options is hindering the expansion of the metal cans market. According to the British Plastics Federation (BPF) in 2020, 1.1 million tons of plastic packaging were recycled annually, with the UK recycling up to 39% of its plastic packaging each year.
Food & Beverage Metal Cans Market: COMMERCIAL USE CASES ACROSS INDUSTRIES
| COMPANY | USE CASE DESCRIPTION | BENEFITS |
|---|---|---|
|
|
Manufactures lightweight, recyclable 2-piece aluminum beverage cans across multiple sizes (100–330ml) with a focus on carbonated soft drinks, beer, and energy drinks | Industry leader in aluminum sustainability | Global scale | Helps brand owners reduce carbon footprint and meet recycling targets |
|
|
Produces 2-piece and 3-piece cans, coatings, and closures for food and beverages | Innovation in high-strength steel and decorative coatings | Strong product diversity; supports food safety with advanced coatings | Broad regional presence across NA, EU, Asia Pacific |
|
|
Supplies beverage and food cans with emphasis on design, lightweighting, and sustainability | Portfolio includes glass + metal | Differentiation through premium packaging design | Supports brand positioning in alcoholic beverages and specialty foods |
|
|
Offers aluminum beverage cans with customization (printing, sizes, shapes); strong focus on emerging markets (Eastern Europe, Asia, South America) | Cost-competitive solutions; rapid response to regional demand; helps beverage companies penetrate high-growth developing markets |
|
|
Largest US supplier of food cans (steel and aluminum) with 3-piece fabrication and vacuum/pressurised solutions | Trusted partner for food processors | Ensures long shelf life | Reliable domestic supply chain and strong service network |
Logos and trademarks shown above are the property of their respective owners. Their use here is for informational and illustrative purposes only.
MARKET ECOSYSTEM
The metal cans market is driven by demand from food and beverage companies seeking durable, sustainable packaging solutions. Manufacturers produce cans using materials like aluminum and steel, focusing on recyclability and innovation to meet industry standards. Regulatory bodies ensure compliance with safety, quality, and environmental guidelines, while end users, including major beverage and food producers, adopt metal cans for their sustainability benefits. The ecosystem thrives on the growing demand for eco-friendly packaging and the collaboration between manufacturers, regulators, and end users. The ecosystem analysis of the metal cans industry highlights the interconnected roles of various stakeholders. Demand-side companies, including Coca-Cola, PepsiCo, and Nestlé, drive the need for packaging solutions. Manufacturers like Ball Corporation, Crown, and Ardagh Group supply the metal cans, ensuring quality and scalability. Regulatory bodies such as FSSAI, ISO, and the Aluminum Association maintain safety, environmental, and industry standards. End Users like Heineken and AB InBev use these cans to package their beverages, aligning with sustainability and market trends. This ecosystem reflects a collaborative effort between demand, production, regulation, and consumption.

Logos and trademarks shown above are the property of their respective owners. Their use here is for informational and illustrative purposes only.
MARKET SEGMENTS

Source: Secondary Research, Interviews with Experts, MarketsandMarkets Analysis
Metal Cans Market, by Application
Aluminum cans are widely used for packaging beverages like soda, beer, and even wine, while metal cans are commonly employed for packaging food items such as vegetables, soups, fruits, pet food, and meats. Beverage cans are highly valued for their portability and convenience, making them ideal for active lifestyles, including hiking, camping, and other outdoor activities, due to their lightweight, durable nature that resists breakage. They are especially suitable for outdoor locations where glass bottles are prohibited, such as stadiums, concerts, and athletic events, allowing consumers to enjoy their favorite drinks anytime, anywhere. In 2023, sustainability became a key concern for beverage brands, and this trend is set to continue in 2024. As consumers become more conscious of the environmental impact of their choices, and as government regulations tighten globally, sustainability is becoming increasingly important. The European Parliament, for instance, proposed a comprehensive directive on new regulations for green claims and environmental labeling schemes. This new initiative is expected to have a significant impact on brands and businesses operating in the region, positively affecting the beverage industry’s use of aluminum and steel cans.
Metal Cans Market, by Type
Two-piece cans come in three main types: draw (shallow draw), where the height is less than the diameter; draw and redraw (DRD); and draw and iron (D&I). These cans are composed of two parts: a body integrated with the bottom lid and a separate lid with an opening. To ensure the contents are protected from external contamination, a technique called double seaming is used to attach the can body to the lids. Steel and aluminum are the primary raw materials used in manufacturing these cans, making them ideal for packaging carbonated and non-carbonated beverages like beer, wine, sports drinks, and fruit juices. Two-piece cans offer several advantages over three-piece cans, such as a seamless connection between the body and bottom, which allows for a tighter seal and reduced raw material consumption. The 2-piece cans segment in the metal cans market has seen substantial growth, fueled by the rising demand for carbonated beverages like soda, energy drinks, and beer. These cans provide a lightweight, cost-effective packaging solution, making them ideal for easy transportation and handling.
REGION
The APAC market is projected to grow the fastest in the metal cans processing market.
Asia Pacific has been a key driver of growth in the global metal cans market for food & beverages during the forecast period. Countries like China and India have significantly contributed to this growth, given their high population density and status as leading producers of fruits and vegetables. These factors are expected to increase the demand for processed food and beverages in the region, making Asia Pacific an emerging market for metal cans in the food & beverage sector. The study considers countries such as China, India, Japan, Thailand, Indonesia, Australia, and New Zealand, where market growth is anticipated to be substantial. Various packaging types are popular in the region, including flexible, rigid plastic, paper, glass, and metal packaging. The growing population has led to increased demand from the food & beverage industry. In response, global players like Ball Corporation (US) and Crown Holdings Inc. (US) are expanding into the Asia Pacific market by establishing new manufacturing plants, further boosting the metal cans market for food & beverages.

Food & Beverage Metal Cans Market: COMPANY EVALUATION MATRIX
Ball Corporation leads the global metal cans market with a dominant share, driven by its large-scale manufacturing, advanced lightweighting technologies, and sustainability initiatives, including recycled aluminium integration and BPA-free coating innovations. Its strong partnerships with leading beverage brands and diversified presence across carbonated drinks, energy drinks, and alcoholic beverages reinforce its leadership position. CCL Industries (Emerging Leader) is gaining visibility through investments in sustainable packaging formats, premium decorative can finishes, and acquisitions that expand its geographic reach and product portfolio, enabling it to capture rising demand in specialty beverage and value-added segments. Other players in the market are actively strengthening their competitive positioning through regional expansions, modernization of manufacturing lines, and the introduction of eco-friendly coatings to comply with global regulations. While they currently trail leaders in terms of global scale and customer reach, their focus on niche markets, cost competitiveness, and sustainability strategies positions them to capture incremental opportunities and gradually move toward higher market share.

Source: Secondary Research, Interviews with Experts, MarketsandMarkets Analysis
KEY MARKET PLAYERS
- 1. Crown Holdings, Inc (US)
- 2. Ball Corporation (US)
- 3. Silgan Holdings Inc. (US)
- 4. Ardagh Group (Luxembourg)
- 5. CCL Industries (US)
- 6. CAN-PACK Group (Poland)
- 7. Kian Joo Group (Malaysia)
- 8. CPMC Holdings Limited (China)
- 9. Envases Group (Spain)
- 10. Toyo Seikan Group Holdings, Ltd. (Japan)
- 11. Universal Can Corporation (Japan)
- 12. Visy (Australia)
- 13. Independent Can Company (US)
- 14. Mauser Packaging Solutions (US)
- 15. P. Wilkinson Containers Ltd (UK)
MARKET SCOPE
| REPORT METRIC | DETAILS |
|---|---|
| Market Size, 2024 (Value) | USD 50.42 Billion |
| Market Forecast, 2029 (Value) | USD 70.72 Billion |
| Growth Rate | CAGR of 7.0% from 2024 to 2029 |
| Years Considered | 2019–2029 |
| Base Year | 2023 |
| Forecast Period | 2024–2029 |
| Units Considered | Value (USD Billion), Volume (Number of Cans) |
| Report Coverage | Revenue forecast, company ranking, competitive landscape, growth factors, and trends |
| Segments Covered |
|
| Regions Covered | North America, Europe, Asia Pacific, South America, and Rest of the World (RoW) |
WHAT IS IN IT FOR YOU: Food & Beverage Metal Cans Market REPORT CONTENT GUIDE

DELIVERED CUSTOMIZATIONS
We have successfully delivered the following deep-dive customizations:
| CLIENT REQUEST | CUSTOMIZATION DELIVERED | VALUE ADDS |
|---|---|---|
| Beverage & Food Brand Owners (breweries, soda, energy drinks, food packers) |
|
|
| Can Manufacturers (2-piece / 3-piece producers) |
|
|
| Coating & Ink Suppliers |
|
|
| Machinery & Equipment Suppliers (forming, seaming, coating lines) |
|
|
| Fillers / Contract Packagers |
|
|
RECENT DEVELOPMENTS
- July 2024 : Silgan Holding Inc. acquired Weener Packaging. Silgan Holdings Inc. announced that it entered into a sale and purchase agreement to acquire Weener Plastics Holdings B.V., a leading manufacturer of specialized dispensing solutions for personal care, food, and healthcare products, for an enterprise value of USD 923 million.
- August 2023 : Crown Holdings, Inc. acquired the Saarlouis facility, which would strengthen its European beverage can operations in Germany, adding around one billion units of annual production capacity. Upon closing, Crown would also take over Helvetia's existing customer base and associated contracts as part of the agreement.
- October 2022 : Ball Corporation expanded its portfolio, its range of infinitely recyclable Ball Aluminum Cups by adding new 9-ounce and 12-ounce options, meeting the rising demand for eco-friendly beverage cups while solidifying its leadership in sustainable packaging.
- May 2022 : Ball Corporation partnered with Coldplay's Music of the Spheres Tour to supply infinitely recyclable Ball Aluminum Cups, aiming to reduce waste and enhance refill and recycling efforts. This collaboration supported Ball Corporation's market growth by promoting its sustainable packaging solutions and broadening its customer base within the entertainment industry.
- April 2022 : Ardagh Group acquired Consol glass, a USD 1 billion acquisition of Consol, broadening its global footprint and strengthening its presence in the African glass packaging market. This acquisition sets the stage for future investments and addresses rising consumer demand.
- October 2021 : Crown Holdings, Inc. launched a round-to-square tin. Available in a shorter size and targeting the luxury market, this distinctive design, paired with customizable finishes, offered uniqueness and collectibility. As a 100% recyclable product, it aligned with sustainability objectives, contributing to Crown's market growth.
Table of Contents
 Exclusive indicates content/data unique to MarketsandMarkets and not available with any competitors.
Methodology
The research study involved extensive secondary sources, directories, and databases such as Bloomberg Businessweek and Factiva to identify and collect information useful for a technical, market-oriented, and commercial study of the food and beverage metal cans market. In-depth interviews were conducted with various primary respondents—such as key industry participants, subject matter experts (SMEs), C-level executives of key market players, and industry consultants—to obtain and verify critical qualitative and quantitative information and assess prospects.
Secondary Research
The secondary sources referred for this research study include government sources, such as the Food and Agriculture Organization (FAO), the Can Manufacturers India (CMI), Eurostat (EU Database), and various national ministries of the agricultural department, corporate filings (such as annual reports, press releases, investor presentations, and financial statements), and trade, business, and professional associations such as In the secondary research process, various organizations such as The Aluminium Association, Metal Construction Association, and Metal Packaging Europe (MPE), were referred to identify and collect information for this study.
Secondary research was mainly used to obtain key information about the industry's supply chain—the total pool of key players, market classification, and segmentation according to the industry trends and key developments from market-oriented perspectives.
Primary Research
The food and beverage metal cans market comprises several stakeholders, including raw material suppliers, end-product manufacturers, and regulatory organizations in the supply chain. Various primary sources from both the supply and demand sides of the market were interviewed to obtain qualitative and quantitative information. Primary interviewees from the supply side include research institutions involved in R&D to introduce technology, distributors, wholesalers, importers & exporters of aluminium/steel manufacturers and technology providers. Primary sources from the demand-side include key opinion leaders, executives, vice presidents, and CEOs through questionnaires, emails, and telephonic interviews.

Note: Three tiers of the companies are defined based on their total revenues in 2022 or 2023, according to the availability of financial data.
Tier 1: Revenue > USD 1 billion
Tier 2: USD 100 million = Revenue = USD 1 billion
Tier 3: Revenue < USD 100 million
To know about the assumptions considered for the study, download the pdf brochure
Market Size Estimation
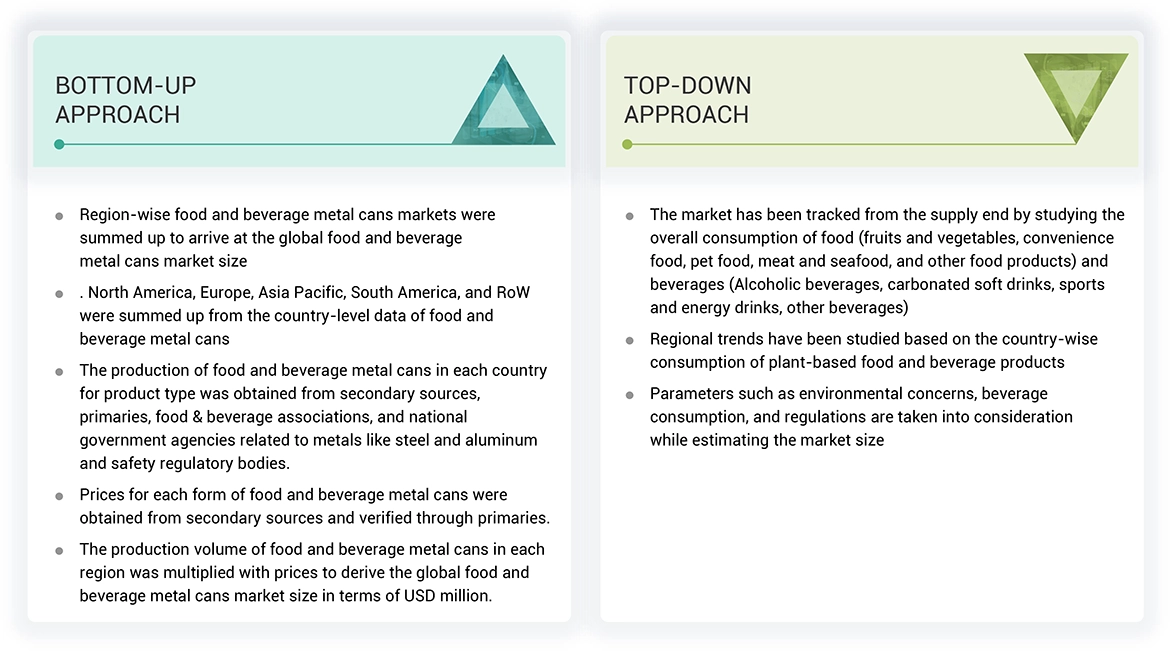
Both the top-down and bottom-up approaches have been used to estimate and validate the total size of the food and beverage metal cans market. These approaches were extensive to determine the size of the subsegments in the market. The research methodology used to estimate the market size includes the following details:
Food and Beverage Metal Cans Market : Top-Down and Bottom-Up Approach
Data Triangulation
After arriving at the overall market size from the estimation process explained above, the total market was split into several segments and subsegments. The data triangulation and market breakdown procedures were employed, wherever applicable, to estimate the overall food and beverage metal cans market and arrive at the exact statistics for all segments and subsegments. The data was triangulated by studying various factors and trends from the demand and supply sides. Along with this, the market size was validated using both the top-down and bottom-up approaches.
Market Definition
The food and beverage metal cans refers to the global industry involved in the production, distribution, and utilization of metal cans, primarily made from aluminum or steel, for packaging food and beverages. These cans are widely used for preserving a range of products, including soft drinks, beer, fruit juices, energy drinks, canned vegetables, soups, and ready-to-eat meals.
Key characteristics of metal cans in this market include their durability, ability to protect the contents from contamination, extend shelf life, and support recycling initiatives, which align with sustainability goals. The demand for metal cans is driven by factors such as their lightweight, corrosion-resistant properties, and consumer preference for eco-friendly packaging solutions, along with their ability to be fully recycled without loss of quality. The market encompasses manufacturers of metal cans, suppliers of raw materials (like aluminum and steel), end-user industries (food and beverage companies), and consumers.
Stakeholders
- Food manufacturers
- Aluminum can manufacturers
- Steel can manufacturers
- Fruit and Vegetable manufacturers
- Food importers and exporters
- Intermediary suppliers include traders and distributors of packed foods such as pet food and convenience foods.
- Government and research organizations
-
Associations and industry bodies:
- Food and Agriculture Organization (FAO)
- United States Department of Agriculture (USDA)
- European Food Safety Authority (EFSA)
- European Association of Specialty Feed Ingredients and their Mixtures (FEFANA)
- Organization for Economic Co-operation and Development (OECD)
- Venture capitalists and investors
Report Objectives
- To determine and project the size of the food and beverage metal cans market by fabrication type, application, degree of internal pressure, coating type, material type, beverage can capacity, and region over five years, ranging from 2024 to 2029.
- To analyze opportunities for stakeholders by identifying the high-growth segments of the food and beverage metal cans market
- To forecast the size of the market segments with respect to five main regions: North America, Europe, Asia Pacific, the Middle East & Africa, and Latin America
- To analyze subsegments of the food and beverage metal cans market with respect to individual growth trends, prospects, and contributions to the overall market
- To profile the key players and comprehensively analyze their market sizes and core competencies
- To track and analyze competitive developments such as product enhancements and new product launches, acquisitions, and partnerships & collaborations in the food and beverage metal cans market globally
Available Customizations
With the given market data, MarketsandMarkets offers customizations according to company-specific scientific needs.
The following customization options are available for the report:
PRODUCT ANALYSIS
- Product Matrix, which gives a detailed comparison of the product portfolio of each company.
GEOGRAPHIC ANALYSIS
With the given market data, MarketsandMarkets offers customizations according to company-specific scientific needs.
- Further breakdown of the Rest of the European food and beverage metal cans market, by key country
- Further breakdown of the Rest of the South American food and beverage metal cans market market, by key country
- Further breakdown of the Rest of Asia Pacific food and beverage metal cans market market, by key country
COMPANY INFORMATION
- Detailed analyses and profiling of additional market players
Key Questions Addressed by the Report
Which region is projected to account for the largest share of the food and beverage metal cans market?
The North American region accounted for the largest share in 2024, valued at USD 12.43 billion, and is expected to grow at a CAGR of 6.5% during the forecast period.
What is the current size of the global food and beverage metal cans market?
The food and beverage metal cans market is estimated at USD 50.42 billion in 2024 and is projected to reach USD 70.72 billion by 2029, growing at a CAGR of 7.0% from 2024 to 2029.
What are the key players in the food and beverage metal cans market?
Key players include Crown Holdings, Inc. (US), Ball Corporation (US), Silgan Holdings Inc. (US), Ardagh Group (Luxembourg), CCL Industries (US), CAN-PACK SA (Poland), Kian-Joo Group (Malaysia), CPMC Holdings (China), Envases Group (Spain), and Toyo Seikan Group Holdings, Ltd. (Japan).
What factors drive the food and beverage metal cans market?
The market is driven by the recyclable nature of metal cans, the high nutritional value and extended shelf life of canned foods combined with their affordability, and the increasing demand for convenience, which encourages innovations in can manufacturing.
Which segment by material source accounted for the largest food and beverage metal cans market share?
The aluminum segment accounted for the largest share of the market, valued at USD 27.35 billion in 2024.
Need a Tailored Report?
Customize this report to your needs
Get 10% FREE Customization
Customize This ReportPersonalize This Research
- Triangulate with your Own Data
- Get Data as per your Format and Definition
- Gain a Deeper Dive on a Specific Application, Geography, Customer or Competitor
- Any level of Personalization
Let Us Help You
- What are the Known and Unknown Adjacencies Impacting the Metals Cans Market
- What will your New Revenue Sources be?
- Who will be your Top Customer; what will make them switch?
- Defend your Market Share or Win Competitors
- Get a Scorecard for Target Partners

Custom Market Research Services
We Will Customise The Research For You, In Case The Report Listed Above Does Not Meet With Your Requirements
Get 10% Free CustomisationTESTIMONIALS

Business Innovation Director
US Based Leading Agribusiness,
Food and Ingredients ManufacturerI highly appreciate the team's efficiency for a well conducted study that helped us clarify some blind spots in food and agricultural niche markets. Although compiling information for B2B markets is very difficult, the MnM team pulled out the task successfully. The quality of research, level of insights, and responsiveness of team were commendable.
Growth opportunities and latent adjacency in Metals Cans Market


Charlotte
May, 2022
what are the different types of metals used for canned food packaging?.