This research study involves the use of extensive secondary sources, directories, and databases, such as Hoovers, Bloomberg L.P., Factiva, ICIS, and OneSource, to identify and collect information useful for this technical, market-oriented, and commercial study of the global plastic hot and cold pipe market. Primary sources are mainly industry experts from core and related industries, preferred suppliers, manufacturers, distributors, service providers, and organizations related to all segments of the value chain of this industry. In-depth interviews were conducted with various primary respondents, including key industry participants, subject matter experts, C-level executives of key market players, and industry consultants, among other experts, to obtain and verify critical qualitative and quantitative information as well as assess growth prospects of the market.
Secondary Research
Secondary sources referred to for this research study include annual reports, press releases, and investor presentations of companies; white papers; certified publications; articles by recognized authors; and databases of various companies and associations. Secondary research was mainly used to obtain key information about the industry’s supply chain, the total pool of key players, market classification, and segmentation according to industry trends to the bottom-most level, regional markets, and key developments from both, market- and technology-oriented perspectives.
Primary Research
In the primary research process, various sources from both the supply and demand sides have been interviewed to obtain and verify qualitative and quantitative information for this report and analyze prospects. Primary sources from the supply side include industry experts such as CEOs, vice presidents, marketing directors, technology and innovation directors, and related executives from various leading companies and organizations operating in the plastic hot and cold pipe market. Primary sources from the demand side include experts and key persons.
In the primary research process, various sources from both the supply and demand sides have been interviewed to obtain and verify qualitative and quantitative information for this report and analyze prospects. Primary sources from the supply side include industry experts such as CEOs, vice presidents, marketing directors, technology and innovation directors, and related executives from various leading companies and organizations operating in the plastic hot and cold pipe market. Primary sources from the demand side include experts and key persons.

To know about the assumptions considered for the study, download the pdf brochure
Market Size Estimation
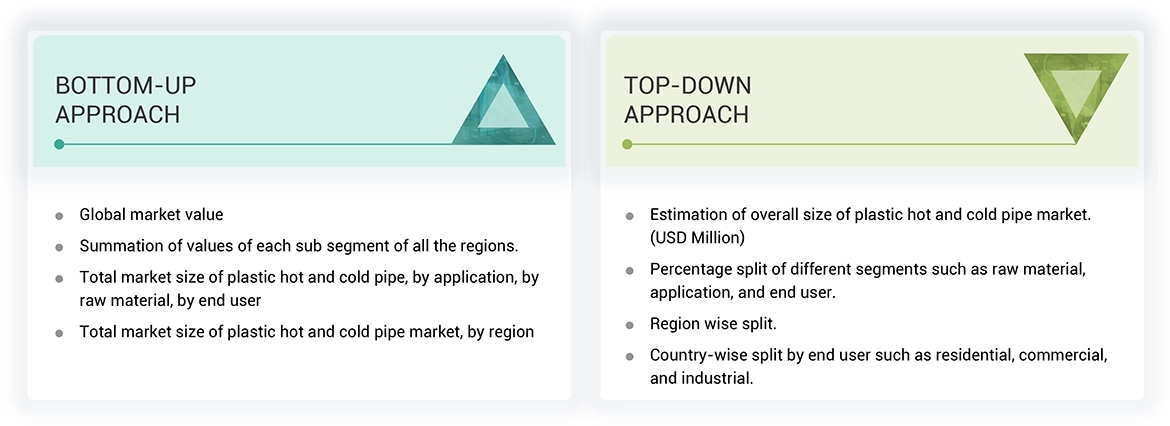
In the complete market engineering process, both top-down and bottom-up approaches have been extensively used along with several data triangulation methods to estimate and forecast the overall market segments listed in this report.
Top-down and bottom-up approaches have been used to estimate and validate the market size of plastic hot and cold pipe for various end user in each region. The key players in the market have been identified through secondary research, and their market share in respective regions has been determined through primary and secondary research. This entire procedure includes the study of annual and financial reports of the key market players and extensive interviews for insights from industry leaders such as CEOs, vice presidents, directors, and marketing executives. All percentage shares, splits, and breakdowns have been determined using secondary sources and verified through primary sources.
Plastic Hot & Cold Pipe Market : Top-Down and Bottom-Up Approach
Data Triangulation
After arriving at the overall market size from the estimation process explained above, the total market has been split into several segments and sub-segments. Data triangulation and market breakdown procedures have been used wherever applicable to complete the overall market engineering process and to arrive at the exact statistics for all segments and sub-segments. The data has been triangulated by studying various factors and trends from both the demand and supply sides. The market has been validated using both the top-down and bottom-up approaches. Then, it was verified through primary interviews. Hence, for every data segment, there are three sources—the top-down approach, the bottom-up approach, and expert interviews. When the values arrived at from the three points matched, the data was assumed to be correct.
Market Definition
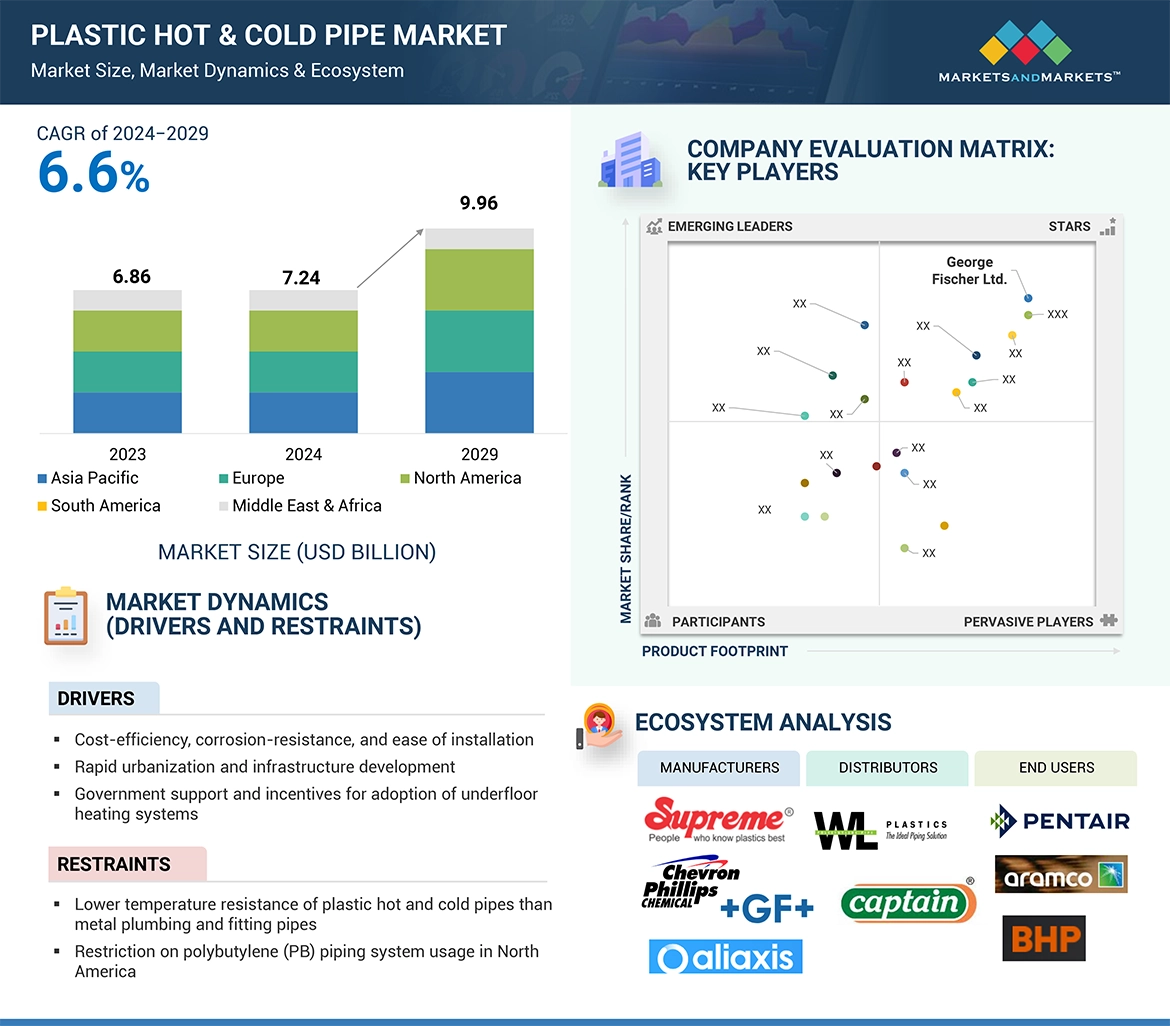
Plastic pipes are cylindrical and hollow and have tubular sections. They allow the flow of fluids, such as water and slurries, gases, small masses of solids, and powders. Plastic hot and cold pipes are used for water plumbing, radiator connection, and underfloor surface heating and cooling applications. They are made of materials such as cross-linked polyethylene (PEX), polyethylene-raised temperature (PE-RT), polypropylene random copolymer (PPR), chlorinated polyvinyl chloride (C-PVC), and polybutylene (PB).
The most suitable pipes for hot and cold water supply and heating systems are cross-linked polyethylene (PEX) or solid wall polybutylene pipes, multi-layer pipes, and barrier pipes. They are often available in straight lengths or coiled shapes with nominal diameters ranging from 10 mm to 110 mm. Plastic pipes offer many advantages over steel, cast iron, and copper pipes. One of the prime advantages is that plastic is simple to cut and transform into any shape or size on the job site, reducing the labor costs required for their installation.
The market for plastic hot and cold pipe is defined as the sum of revenues generated by global companies from the sale of plastic hot and cold pipe. They cater to various end users, such as industrial, commercial, and residential. The regions considered for the plastic hot and cold pipe market study include Asia Pacific, Europe, North America, the Middle East & Africa, and South America.
Stakeholders
-
Government organizations and regulatory agencies
-
Investors/shareholders
-
Shipping companies
-
Organizations, forums, alliances, and associations related to the plastic hot and cold pipe market
-
Plastic hot and cold pipe manufacturing companies
-
Manufacturers and equipment user associations and groups
-
Plastic pipes and fittings association
-
Environmental research institutes
-
Consulting companies in the energy and power domain
-
Manufacturing industry
-
Investment banks
-
State and national regulatory authorities
-
Venture capital firms
-
Financial organizations
-
Research Institutes and organizations
-
Environment associations
Report Objectives
-
To describe and forecast the plastic hot and cold pipe market in terms of value based on raw material, application, end user and region
-
To describe and forecast the plastic hot and cold pipe market in terms of volume based on region
-
To provide detailed information about the key factors such as drivers, restraints, opportunities, and challenges influencing the growth of the plastic hot and cold pipe market
-
To strategically analyze the subsegments with respect to individual growth trends, prospects, and contributions of each segment to the overall market size
-
To forecast the market size for five key regions: North America, Europe, Asia Pacific, Middle East & Africa, and South America, along with their key countries
-
To strategically analyze micromarkets1 with respect to individual growth trends, prospects, and contributions to the total market
-
To study the complete supply chain and allied industry segments and perform a supply chain analysis of the plastic hot and cold pipe market’ landscape
-
To study market trends, patent analysis, trade analysis, tariff and regulatory landscape, Porter’s five forces analysis, ecosystem mapping, technologies, investment and funding scenario, key stakeholders & buying criteria, case studies pertaining to off plastic hot and cold pipe market
-
To analyze the opportunities for various stakeholders by identifying the high-growth segments of the plastic hot and cold pipe market
-
To profile the key players and comprehensively analyze their market positions in terms of ranking and core competencies2, along with detailing the competitive landscape for the market leaders
-
To analyze competitive developments, such as contracts, collaborations, expansions, product launches, investments, and acquisitions, in the plastic hot and cold pipe market
Note: 1. Micromarkets are defined as the further segments and subsegments of the plastic hot and cold pipe market included in the report.
2. Core competencies of companies are captured in terms of their key developments and product portfolios, as well as key strategies adopted to sustain their position in the plastic hot and cold pipe market.
Available Customizations
MarketsandMarkets offers customizations according to the specific needs of the companies with the given market data.
The following customization options are available for the report:
Product Analysis
-
Product matrix, which gives a detailed comparison of the product portfolio of each company
Regional Analysis
-
Further breakdown of the plastic hot and cold pipe market, by country
Company Information
-
Detailed analysis and profiling of additional market players (up to five)


 HIGHEST CAGR MARKET IN 2030
 CANADA FASTEST GROWING MARKET IN THE REGION


Growth opportunities and latent adjacency in Plastic Hot & Cold Pipe Market