Power SCADA Market

Power SCADA Market by Architecture (Hardware, Software, Services) Component (Remote Terminal Unit, Programmable Logic Controller, Human Machine Interface, Communication Systems Protection relays), End User and Region - Global Forecast to 2028

Report Code: EP 7902 Jan, 2024, by marketsandmarkets.com

[270 Pages Report] The power SCADA market is poised to exhibit a notable compound annual growth rate (CAGR) of 7.1% throughout the forecast period, escalating from an estimated USD 2.1 billion in 2023 to USD 2.9 billion by 2028. The substantial growth in the power SCADA (Supervisory Control and Data Acquisition) market is driven by pivotal factors, including a heightened emphasis on modernizing and digitizing power infrastructure. This imperative arises from the essential need for utilities and energy providers to enhance operational efficiency and reliability, making the adoption of SCADA systems indispensable. The increasing integration of renewable energy sources, such as solar and wind, into power grids further amplifies the demand for advanced SCADA solutions. The market is propelled by the growing complexities of power networks, necessitating real-time monitoring and control capabilities. The incorporation of smart grid technologies, the imperative for predictive maintenance capabilities, and the overarching trend towards Industry 4.0 collectively contribute significantly to the expansive growth of the market.

Power SCADA Market

To know about the assumptions considered for the study, Request for Free Sample Report

Power SCADA Market Opportunities

To know about the assumptions considered for the study, download the pdf brochure

Power SCADA Market Dynamics

Driver: Growing adoption of Industry 4.0 principles in various sectors.

The genesis of the 4th generation industrial revolution, Industry 4.0, originated in Germany and subsequently evolved across Europe and the Americas. This paradigm shift is instrumental in fostering market growth, particularly in the power sector, where the widespread adoption of Industry 4.0 principles is reshaping the future. Automation plays a pivotal role, enabling power plants to operate seamlessly, 24/7, with minimal errors and heightened efficiency. The integration of power SCADA systems, key facilitators of industrial automation, allows for the control and operation of various machines. In power plants, interconnected mechanical and electronic components, sensors, and actuators communicate through a network, sharing vital information. This interconnectedness enhances predictive maintenance strategies, optimizing efficiency, throughput times, and resource utilization in transmission and distribution. Industry 4.0 principles enhance the overall performance of power SCADA systems by automating manual tasks, improving operational accuracy, and providing real-time data and analytics. This contributes to grid reliability, stability, and proactive maintenance, preventing outages. The benefits extend to improved decision-making, as data-driven insights empower operators to make informed choices, leading to better planning and resource allocation. The impact translates into reduced costs, with automation and efficiency gains lowering operational expenses. Examples of Industry 4.0 implementation, such as predictive maintenance through sensors and artificial intelligence, highlight the prevention of equipment failures and subsequent costly downtime. Smart grids, integrating renewable energy sources and optimizing energy distribution, exemplify another application. The deployment of microgrids showcases the resilience and energy independence achievable through Industry 4.0, contributing to a more robust and adaptable energy infrastructure. In essence, Industry 4.0 principles in power SCADA systems drive transformative changes, fostering operational excellence, cost savings, and a sustainable and resilient energy landscape.

Restraints: High costs associated with initial setup, maintenance, and upgrade of power SCADA solutions.

Setting up power plants, new T&D lines, and substations requires huge capital investment associated with the installation of equipment, software, and training. Some of these solutions are installed in remote locations for controlling and maintaining the systems and gathering real-time data. Gathering data with the help of a power SCADA system helps reduce errors while improving efficiency and productivity. Investment of such a considerable amount is difficult for a new company. The management has to conduct a deep analysis of the return on investment (ROI) before implementing state-of-the-art control and automation systems. It is not feasible for many companies to replace their existing systems because of the high cost of new and advanced systems and the lack of interoperability in legacy systems. Legacy systems rely on their proprietary protocols to communicate, which makes it difficult to connect them to systems based on new technology. Moreover, the additional costs incurred by power SCADA manufacturers or suppliers to upgrade the existing systems are high. Furthermore, automation software systems used in power plants require maintenance and upgrades occasionally. It is not feasible for small power plants and captive power plants to bear such expenses. Thus, cost is a key factor restraining the growth of the power SCADA market. Once the power SCADA system is installed in an operating plant, adding any alternative system, hardware, or software incompatible with the power SCADA system becomes difficult, as it has to seamlessly integrate with the existing system for optimum results. Maintenance costs follow the initial capital investment. Maintenance and upgrading the plant with modern technologies require a high capital re-investment, which is difficult for companies with fewer financial resources. Thus, both initial capital investment and the cost of maintenance and upgrades are restraining factors for the power SCADA market.

Opportunities:  Convergence of power SCADA systems and wireless sensor networks (WSNs).

A wireless network integrated with distributed autonomous devices consisting of sensors to monitor physical or environmental conditions is known as a wireless sensor network (WSN). WSNs are used in various industries, such as oil & gas, transportation, and water & wastewater treatment. Oil & gas plants are generally located in remote areas with rough environmental conditions. In an oil & gas plant, tanks, compressors, generators, and separators are monitored, managed, and controlled by a power SCADA system with the help of sensors deployed in a WSN. Using a WSN reduces the costs associated with implementing a sensor network and communication system. Moreover, wired technologies are comparatively costlier than their wireless counterparts due to the increased hardware requirements such as cables, networking devices, routers, and network adapters. Several parameters in plant operations, such as pressure, temperature, flow, and level of systems, are measured and detected using a WSN. Some major applications of WSN in power grids are preventing theft of cables, conductors, and lattices, monitoring conductor temperature and low-hanging temperature, monitoring partial discharge and leakage current, and fault detection. The use of a WSN enables real-time data monitoring and process control. Thus, growing R&D in the field of WSN and its active adoption in SCADA systems and solutions would increase the application scope of power SCADA systems. Also, frequent software updates in wireless sensor networks make them apt for the current automated systems in various industries adopting power SCADA systems. Network-enabled device electricity demand has been increasing significantly since 2008 and is expected to grow till 2023 at an increasing rate of 5.7% of TWh. Electricity demand helps drive the smart grid market, which further helps drive the SCADA market, followed by power SCADA market calculation.

Challenges:Inadequate data storage and management concerns.

The deployment of power SCADA systems in the transmission and distribution sector across different industries has led to the generation of vast amounts of highly complex data. Such data is related to transmission logs and outage prevention, which is highly unstructured and needs to be processed to gain vital insights. Continuous data generation from various network nodes has raised huge concerns about data storage and management for solution providers. Unmanaged data can raise multiple threats, such as hardware failure, cyberattacks, misconfiguration, auto-negation miss-match, and sub-standard cabling; eventually, extracting valuable insights from the data might become a major challenge. The respective authorities need to create high-volume data centers and deploy analytical solutions without increasing the cost. A major challenge for end-use industries is understanding the information acquired from power SCADA systems and developing a solution that can aggregate the data and correlate the information generated by the systems. Inaccessibility and delays in data retrieval further compound the issue, manifesting through slow access times, version control difficulties, and disruptions caused by system outages or crashes. These hurdles can impede workflows and hinder timely decision-making processes. Poor decision-making emerges due to inaccurate data, limited visibility due to siloed information, and potential compliance challenges arising from improper data management. Flawed analysis and non-compliance can result in misguided conclusions and financial penalties. Increased costs and inefficiencies are additional concerns stemming from wasted resources spent on searching for disorganized data, inefficient storage practices leading to higher costs, and duplication of efforts due to a lack of data sharing and collaboration. Organizations must implement effective data storage and management strategies to address these multifaceted concerns. This involves investing in reliable storage solutions such as secure cloud storage or enterprise-grade NAS devices. Additionally, establishing robust data backup and recovery protocols is crucial for preventing data loss and ensuring quick recovery during failures. The implementation of data governance policies plays a vital role in defining guidelines for data ownership, access, and retention, thereby maintaining data integrity and compliance. Leveraging data management tools, including software solutions for data classification and organization, enhances accessibility and visibility. Moreover, promoting data literacy through employee training fosters a culture of awareness and responsibility.

Power SCADA Market Ecosystem

The power SCADA market is defined by the participation of established, financially robust companies boasting substantial expertise in manufacturing SCADA systems and associated components. These companies have a well-established presence, providing a diverse array of products. Leveraging state-of-the-art technologies, they maintain extensive international networks for sales and marketing. Key players in this market include Rockwell Automation (US), Emerson (US), ABB (Switzerland), Siemens (Germany), and Schneider Electric (France).

Power SCADA Market Ecosystem

The Power SCADA hardware market is expected to experience the highest CAGR by architecture between 2023 and 2028.

The Power SCADA hardware market is anticipated to witness the highest CAGR by architecture from 2023 to 2028 due to several factors driving demand and technological advancements. As industries increasingly adopt Industry 4.0 principles, the need for robust and efficient hardware solutions in power SCADA systems becomes paramount. The hardware architecture serves as the backbone for the automation and control processes in power plants, enabling seamless communication and data exchange among interconnected components. With the rising trend of automation, the demand for sophisticated and technologically advanced hardware components is escalating. Additionally, the emphasis on enhancing reliability, reducing downtime, and optimizing operational efficiency in power plants contributes to the heightened demand for innovative power SCADA hardware. As industries across the globe prioritize the integration of smart technologies for improved performance, the power SCADA hardware market is poised to experience significant growth during the forecast period.

Remote Terminal Units (RTU) segment, by component, to emerge as largest segment of power SCADA market.

The Remote Terminal Units (RTU) segment is poised to emerge as the largest component in the power SCADA market due to several key factors driving its prominence. RTUs play a pivotal role in power SCADA systems, acting as essential data acquisition and control units in remote and critical infrastructure locations, such as power substations. The increasing complexity of power grid systems, coupled with the growing demand for real-time monitoring and control, has fueled the adoption of RTUs. These units facilitate the seamless integration of various sensors, actuators, and communication modules, enabling efficient data collection and transmission. Moreover, the emphasis on grid modernization and the integration of renewable energy sources has further propelled the demand for RTUs in power SCADA applications. As industries seek enhanced reliability, reduced response times, and improved decision-making capabilities, the RTU segment becomes integral in ensuring the robust performance of power SCADA systems. Additionally, advancements in RTU technologies, including increased processing power and communication capabilities, contribute to their growing significance, making them the leading component in the evolving landscape of the power SCADA market.

Oil & Gas segment, by end-use industry, to have highest market share from 2023 to 2028.

The Oil & Gas segment is anticipated to command the highest market share in the power SCADA market from 2023 to 2028, owing to several factors driving its prominence in the industry. The Oil & Gas sector operates in a dynamic and challenging environment, where the integration of advanced technologies is crucial for ensuring operational efficiency, safety, and regulatory compliance. Power SCADA systems play a pivotal role in this industry by providing real-time monitoring, control, and automation of critical processes in exploration, production, refining, and distribution facilities. The need for continuous and reliable operation, coupled with the complex and geographically dispersed nature of Oil & Gas infrastructure, makes power SCADA systems indispensable. These systems enable remote monitoring of assets, facilitate predictive maintenance, and enhance overall operational visibility. Furthermore, the increasing adoption of Industrial Internet of Things (IIoT) and Industry 4.0 principles in the Oil & Gas sector further boosts the demand for advanced power SCADA solutions. As the industry strives for cost optimization, safety improvements, and regulatory compliance, the Oil & Gas segment emerges as a key driver, contributing to the highest market share in the power SCADA market during the forecast period.

Asia Pacific to account for largest market size during forecast period.

Asia Pacific is poised to account for the largest market size in the power SCADA sector during the forecast period, propelled by a confluence of factors driving robust growth in the region. The escalating demand for electricity due to rapid industrialization, urbanization, and population growth is fostering extensive investments in power infrastructure across Asia Pacific. Governments in the region are actively promoting smart grid initiatives and the integration of advanced technologies, creating a conducive environment for the adoption of power SCADA systems. Additionally, the increasing focus on renewable energy sources, coupled with the need for efficient grid management, is driving the deployment of SCADA solutions in power generation, transmission, and distribution. The expanding manufacturing sector, particularly in countries like China and India, further contributes to the rising demand for reliable and technologically advanced power SCADA systems. With a growing awareness of the benefits of automation, real-time monitoring, and predictive maintenance, Asia Pacific emerges as a key market player in the power SCADA landscape, set to experience the largest market size during the forecast period.

Asia Pacific/APAC Power SCADA Market Size, and Share

Key Market Players

ABB (Switzerland), Emerson (US), Siemens (Germany), Schneider Electric (France), Eaton Corporation (Ireland), Rockwell Automation (US), Hitachi (Japan), Honeywell (US), Indra Sistemas (Spain), PSI AG (Germany), and Toshiba Corporation (Japan).

Get online access to the report on the World's First Market Intelligence Cloud

  • Easy to Download Historical Data & Forecast Numbers
  • Company Analysis Dashboard for high growth potential opportunities
  • Research Analyst Access for customization & queries
  • Competitor Analysis with Interactive dashboard
  • Latest News, Updates & Trend analysis
Request Sample

Scope of the Report

Report Metric

Details

Market Size available for years

2019–2028

Base year considered

2022

Forecast period

2023–2028

Forecast units

Value (USD Million)

Segments covered

By Component, By Architecture, and By End-use Industry

Geographies covered

Asia Pacific, North America, Europe, Middle East and Africa, and South America 

Companies covered

ABB (Switzerland), General Electric (US), Siemens (Germany), Schneider Electric (France), Mitsubishi Electric (Japan), Eaton Corporation (Ireland), Hitachi (Japan), Rockwell Automation (US), Honeywell (US), Toshiba corporation (Japan),  Yokogawa Electric Corporation (Japan), Emerson (US), Motorola Solutions (US), Bentek Systems (California), Indra Sistemas (Spain),  EFACEC Power Solutions (Portugal), PSI AG (Germany), Outlaw Automation (Canada), Omron Technologies (Japan), Advantech Co. (Taiwan) and Inductive Automation (US), Survalent Technology Corporation (Canada), Nugen Automation (US), Ovak Technologies (US).

The power SCADA market is classified in this research report based on component, architecture, end-use industry, and region.

Based on Architechture, the power SCADA market has been segmented as follows:
  • Hardware
  • Software
  • Services
Based on end-use industry, the power SCADA market has been segmented as follows:
  • Oil & Gas
  • Water & Wastewater Treatment
  • Metal & Mining
  • Chemicals
  • Transportation
  • Other End-use Industry
Based on voltage, the oil immersed power transformer market has been segmented as follows:
  • Master Terminal Unit (MTU)
  • Remote Terminal Unit (RTU)
  • Human Machine Interface (HMI)
  • Programmable Logic Controller (PLC)
  • Communication Systems
  • Protection Relay (IED’s)
  • Other Components
Based on regions, the power SCADA market has been segmented as follows:
  • North America
  • Asia Pacific
  • South America
  • Europe
  • Middle East and Africa

Recent Developments

  • In 2022, ABB secured a contract to upgrade the SCADA and telecommunication systems for NSE's 220 kV and 138 kV transmission network. The project aimed to modernize the grid infrastructure and improve its resilience to disturbances.
  • Siemens Energy and Ørsted have joined forces to pioneer the world's inaugural AI-driven offshore wind service platform. The collaborative agreement, initiated in 2022, focuses on the creation and implementation of an advanced platform leveraging artificial intelligence to monitor and enhance the efficiency of offshore wind farms.
  • In December 2022, Emerson secured a multi-million dollar contract to modernize National Grid ESO's SCADA system, the central nervous system of the UK's electricity grid. The project involved deploying Emerson's latest automation technologies to improve situational awareness, decision-making, and control capabilities.

Frequently Asked Questions (FAQ):

To speak to our analyst for a discussion on the above findings, click Speak to Analyst

TABLE OF CONTENTS
 
1 INTRODUCTION (Page No. - 34)
    1.1 STUDY OBJECTIVES 
    1.2 MARKET DEFINITION 
    1.3 INCLUSIONS AND EXCLUSIONS 
           1.3.1 POWER SCADA MARKET, BY ARCHITECTURE: INCLUSIONS AND EXCLUSIONS
           1.3.2 POWER SCADA MARKET, BY END-USER INDUSTRY: INCLUSIONS AND EXCLUSIONS
    1.4 STUDY SCOPE 
           1.4.1 MARKETS COVERED
           1.4.2 REGIONAL SCOPE
           1.4.3 YEARS CONSIDERED
           1.4.4 CURRENCY CONSIDERED
    1.5 LIMITATIONS 
    1.6 STAKEHOLDERS 
    1.7 SUMMARY OF CHANGES 
 
2 RESEARCH METHODOLOGY (Page No. - 40)
    2.1 RESEARCH DATA 
           FIGURE 1 POWER SCADA MARKET: RESEARCH DESIGN
    2.2 MARKET BREAKDOWN AND DATA TRIANGULATION 
           FIGURE 2 DATA TRIANGULATION
           2.2.1 SECONDARY DATA
                    2.2.1.1 Key secondary sources
           2.2.2 PRIMARY DATA
                    2.2.2.1 Key industry insights
                    2.2.2.2 Breakdown of primaries
    2.3 SCOPE 
    2.4 MARKET SIZE ESTIMATION 
           2.4.1 BOTTOM-UP APPROACH
                    FIGURE 3 MARKET SIZE ESTIMATION METHODOLOGY: BOTTOM-UP APPROACH
           2.4.2 TOP-DOWN APPROACH
                    FIGURE 4 MARKET SIZE ESTIMATION METHODOLOGY: TOP-DOWN APPROACH
           2.4.3 DEMAND-SIDE ANALYSIS
                    FIGURE 5 MAIN METRICS CONSIDERED TO ANALYZE AND ASSESS DEMAND FOR POWER SCADA SOLUTIONS
                    2.4.3.1 Calculations for demand-side analysis
                    2.4.3.2 Assumptions for demand-side analysis
           2.4.4 SUPPLY-SIDE ANALYSIS
                    FIGURE 6 KEY METRICS CONSIDERED TO ASSESS SUPPLY OF POWER SCADA SYSTEMS
                    FIGURE 7 POWER SCADA MARKET: SUPPLY-SIDE ANALYSIS
                    2.4.4.1 Calculations for supply-side analysis
                    2.4.4.2 Assumptions for supply-side analysis
                    2.4.4.3 Forecast
    2.5 IMPACT OF RECESSION 
 
3 EXECUTIVE SUMMARY (Page No. - 53)
    TABLE 1 POWER SCADA MARKET SNAPSHOT 
    FIGURE 8 ASIA PACIFIC DOMINATED POWER SCADA MARKET IN 2022 
    FIGURE 9 HARDWARE SEGMENT TO DOMINATE POWER SCADA MARKET DURING FORECAST PERIOD 
    FIGURE 10 REMOTE TERMINAL UNITS (RTUS) SEGMENT TO LEAD POWER SCADA MARKET DURING FORECAST PERIOD 
    FIGURE 11 OIL & GAS SEGMENT TO DOMINATE POWER SCADA MARKET DURING FORECAST PERIOD 
 
4 PREMIUM INSIGHTS (Page No. - 58)
    4.1 ATTRACTIVE OPPORTUNITIES FOR PLAYERS IN POWER SCADA MARKET 
           FIGURE 12 INCREASING INVESTMENTS IN AUTOMATION OF SUBSTATIONS TO CREATE LUCRATIVE OPPORTUNITIES FOR MARKET PLAYERS
    4.2 POWER SCADA MARKET, BY REGION 
           FIGURE 13 ASIA PACIFIC POWER SCADA MARKET TO REGISTER HIGHEST CAGR FROM 2023 TO 2028
    4.3 ASIA PACIFIC POWER SCADA MARKET, BY END-USER INDUSTRY AND COUNTRY 
           FIGURE 14 OIL & GAS SEGMENT AND CHINA HELD LARGEST SHARES OF ASIA PACIFIC POWER SCADA MARKET IN 2022
    4.4 POWER SCADA MARKET, BY COMPONENT 
           FIGURE 15 REMOTE TERMINAL UNITS SEGMENT TO ACCOUNT FOR LARGEST SHARE OF POWER SCADA MARKET IN 2028
    4.5 POWER SCADA MARKET, BY ARCHITECTURE 
           FIGURE 16 HARDWARE SEGMENT TO ACCOUNT FOR LARGEST SHARE OF POWER SCADA MARKET IN 2028
    4.6 POWER SCADA MARKET, BY END-USER INDUSTRY 
           FIGURE 17 OIL & GAS SEGMENT TO ACCOUNT FOR LARGEST SHARE OF POWER SCADA MARKET IN 2028
 
5 MARKET OVERVIEW (Page No. - 63)
    5.1 INTRODUCTION 
    5.2 MARKET DYNAMICS 
           FIGURE 18 POWER SCADA MARKET: DRIVERS, RESTRAINTS, OPPORTUNITIES,  AND CHALLENGES
           5.2.1 DRIVERS
                    5.2.1.1 Growing adoption of Industry 4.0 principles in various sectors
                               FIGURE 19 GLOBAL ELECTRICITY INVESTMENTS AND SHARE OF DIGITAL GRID INFRASTRUCTURE, 2015–2023
                    5.2.1.2 Increasing focus on managing carbon footprint
                    5.2.1.3 Rising use of power SCADA systems in oil & gas industry
           5.2.2 RESTRAINTS
                    5.2.2.1 High costs associated with initial setup, maintenance, and upgrade of power SCADA solutions
                    5.2.2.2 Risks of cyberattacks
                               FIGURE 20 ENTRY POINTS FOR CYBERATTACKS
           5.2.3 OPPORTUNITIES
                    5.2.3.1 Convergence of power SCADA systems and wireless sensor networks (WSNs)
                               FIGURE 21 GLOBAL POWER CONSUMPTION BY ALL ICT DEVICES, 2008–2023
                    5.2.3.2 Shift from on-premises to cloud-based power SCADA systems
                    5.2.3.3 Rise in use of big data analytics and 5G technology in industrial sector
           5.2.4 CHALLENGES
                    5.2.4.1 Inadequate data storage and management concerns
    5.3 PRICING ANALYSIS 
           5.3.1 AVERAGE SELLING PRICE (ASP) OF POWER SCADA SOLUTIONS,  BY COMPONENT
                    TABLE 2 AVERAGE SELLING PRICE (ASP) OF POWER SCADA SOLUTIONS
                    TABLE 3 AVERAGE SELLING PRICE (ASP) OF REMOTE TERMINAL UNITS (RTUS)
                    TABLE 4 AVERAGE SELLING PRICE (ASP) OF PROGRAMMABLE LOGIC CONTROLLERS (PLCS)
    5.4 ECOSYSTEM/MARKET MAP 
           FIGURE 22 POWER SCADA MARKET MAP
           TABLE 5 COMPANIES AND THEIR ROLES IN POWER SCADA ECOSYSTEM
    5.5 VALUE CHAIN ANALYSIS 
           FIGURE 23 POWER SCADA MARKET: VALUE CHAIN ANALYSIS
           5.5.1 RAW MATERIAL PROVIDERS/SUPPLIERS
           5.5.2 COMPONENT MANUFACTURERS
           5.5.3 POWER SCADA MANUFACTURERS/ASSEMBLERS
           5.5.4 DISTRIBUTORS (BUYERS)/END USERS AND POST-SALES SERVICE PROVIDERS
    5.6 TECHNOLOGY ANALYSIS 
           5.6.1 POWER SCADA BASED ON DIFFERENT TECHNOLOGIES
    5.7 TARIFF, STANDARD, AND REGULATORY LANDSCAPE 
           5.7.1 TARIFF ANALYSIS
                    TABLE 6 IMPORT TARIFF FOR HS 853710-COMPLIANT PRODUCTS (BOARDS, CABINETS, AND SIMILAR COMBINATIONS OF APPARATUS FOR ELECTRIC CONTROL OR DISTRIBUTION OF ELECTRICITY), BY COUNTRY, 2022
           5.7.2 REGULATIONS
                    TABLE 7 REGULATIONS RELATED TO POWER SCADA SYSTEMS
           5.7.3 REGULATORY BODIES, GOVERNMENT AGENCIES, AND OTHER ORGANIZATIONS RELATED TO POWER SCADA MARKET
                    TABLE 8 NORTH AMERICA: LIST OF REGULATORY BODIES, GOVERNMENT AGENCIES, AND OTHER ORGANIZATIONS
                    TABLE 9 EUROPE: LIST OF REGULATORY BODIES, GOVERNMENT AGENCIES, AND OTHER ORGANIZATIONS
                    TABLE 10 ASIA PACIFIC: LIST OF REGULATORY BODIES, GOVERNMENT AGENCIES, AND OTHER ORGANIZATIONS
                    TABLE 11 ROW: LIST OF REGULATORY BODIES, GOVERNMENT AGENCIES, AND OTHER ORGANIZATIONS
           5.7.4 STANDARDS
                    TABLE 12 STANDARDS RELATED TO POWER SCADA SYSTEMS
    5.8 PATENT ANALYSIS 
           FIGURE 24 MAJOR PATENTS RELATED TO POWER SCADA SYSTEMS
           TABLE 13 POWER SCADA MARKET: INNOVATIONS AND PATENT REGISTRATIONS
    5.9 PORTER’S FIVE FORCES ANALYSIS 
           FIGURE 25 POWER SCADA MARKET: PORTER’S FIVE FORCES ANALYSIS
           TABLE 14 POWER SCADA MARKET: PORTER’S FIVE FORCES ANALYSIS
           5.9.1 THREAT OF SUBSTITUTES
           5.9.2 BARGAINING POWER OF SUPPLIERS
           5.9.3 BARGAINING POWER OF BUYERS
           5.9.4 THREAT OF NEW ENTRANTS
           5.9.5 INTENSITY OF COMPETITIVE RIVALRY
    5.10 TRENDS/DISRUPTIONS IMPACTING CUSTOMERS’ BUSINESSES 
           FIGURE 26 TRENDS/DISRUPTIONS IMPACTING CUSTOMERS’ BUSINESSES
    5.11 CASE STUDY ANALYSIS 
           5.11.1 SIEMENS PROVIDED TIA SOLUTIONS DESIGNED IN COLLABORATION WITH TESCO FOR MUNICIPAL WATER MANAGEMENT SYSTEM
           5.11.2 SIEMENS INTEGRATOR HELPED SMALL TOWN MODERNIZE WATER SUPPLY WHILE CUTTING DOWN COSTS
           5.11.3 ABB PROVIDED CLOUD-BASED SCADA SYSTEM DRIVEN BY ABB ABILITY GENIX PLATFORM TO ALTO MAIPO HYDROPOWER PLANT
 
6 POWER SCADA MARKET, BY ARCHITECTURE (Page No. - 91)
    6.1 INTRODUCTION 
           FIGURE 27 HARDWARE SEGMENT DOMINATED POWER SCADA MARKET IN 2022
           TABLE 15 POWER SCADA MARKET, BY ARCHITECTURE, 2019–2022 (USD MILLION)
           TABLE 16 POWER SCADA MARKET, BY ARCHITECTURE, 2023–2028 (USD MILLION)
    6.2 HARDWARE 
           6.2.1 USE OF HARDWARE COMPONENTS TO PERFORM FUNCTIONS LIKE FIELD DATA COLLECTION TO DRIVE MARKET
                    TABLE 17 HARDWARE: POWER SCADA MARKET, BY REGION, 2019–2022 (USD MILLION)
                    TABLE 18 HARDWARE: POWER SCADA MARKET, BY REGION, 2023–2028 (USD MILLION)
    6.3 SOFTWARE 
           6.3.1 USE OF SOFTWARE APPLICATIONS TO ANALYZE DATA AND IDENTIFY PRECISE LOCATIONS FOR REPAIR TO DRIVE MARKET
                    TABLE 19 SOFTWARE: POWER SCADA MARKET, BY REGION, 2019–2022 (USD MILLION)
                    TABLE 20 SOFTWARE: POWER SCADA MARKET, BY REGION, 2023–2028 (USD MILLION)
    6.4 SERVICES 
           6.4.1 RISING DEMAND FOR DESIGNING, INSTALLATION, TRAINING, AND MAINTENANCE SERVICES OF POWER SCADA SYSTEMS TO FUEL MARKET GROWTH
                    TABLE 21 SERVICES: POWER SCADA MARKET, BY REGION, 2019–2022 (USD MILLION)
                    TABLE 22 SERVICES: POWER SCADA MARKET, BY REGION, 2023–2028 (USD MILLION)
 
7 POWER SCADA MARKET, BY END-USER INDUSTRY (Page No. - 97)
    7.1 INTRODUCTION 
           FIGURE 28 OIL & GAS SEGMENT TO HOLD LARGEST SHARE OF POWER SCADA MARKET  IN 2023
           TABLE 23 POWER SCADA MARKET, BY END-USER INDUSTRY, 2019–2022 (USD MILLION)
           TABLE 24 POWER SCADA MARKET, BY END-USER INDUSTRY, 2023–2028 (USD MILLION)
    7.2 OIL & GAS 
           7.2.1 GROWING USE OF POWER SCADA SYSTEMS IN OIL & GAS INDUSTRY TO OPTIMIZE PRODUCTION TO DRIVE MARKET
                    TABLE 25 OIL & GAS: POWER SCADA MARKET, BY REGION, 2019–2022 (USD MILLION)
                    TABLE 26 OIL & GAS: POWER SCADA MARKET, BY REGION, 2023–2028 (USD MILLION)
    7.3 WATER & WASTEWATER TREATMENT 
           7.3.1 RISING NEED TO MINIMIZE LOSSES DUE TO LEAKAGES TO FUEL DEMAND
                    TABLE 27 WATER & WASTEWATER TREATMENT: POWER SCADA MARKET, BY REGION,  2019–2022 (USD MILLION)
                    TABLE 28 WATER & WASTEWATER TREATMENT: POWER SCADA MARKET, BY REGION,  2023–2028 (USD MILLION)
    7.4 METALS & MINING 
           7.4.1 NEED TO ENSURE OPERATIONAL SAFETY AND ACHIEVE CONSISTENT EFFICIENCY TO FUEL DEMAND
                    TABLE 29 METALS & MINING: POWER SCADA MARKET, BY REGION, 2019–2022 (USD MILLION)
                    TABLE 30 METALS & MINING: POWER SCADA MARKET, BY REGION, 2023–2028 (USD MILLION)
    7.5 CHEMICALS 
           7.5.1 INCREASING NEED FOR RELIABLE PLANT OPERATIONS TO DRIVE DEMAND
                    TABLE 31 CHEMICALS: POWER SCADA MARKET, BY REGION, 2019–2022 (USD MILLION)
                    TABLE 32 CHEMICALS: POWER SCADA MARKET, BY REGION, 2023–2028 (USD MILLION)
    7.6 TRANSPORTATION 
           7.6.1 DEMAND FOR TRANSPARENCY OF LOCATION AND OPERATION DURING MOVEMENT OF GOODS TO PROPEL MARKET GROWTH
                    TABLE 33 TRANSPORTATION: POWER SCADA MARKET, BY REGION, 2019–2022 (USD MILLION)
                    TABLE 34 TRANSPORTATION: POWER SCADA MARKET, BY REGION, 2023–2028 (USD MILLION)
    7.7 OTHER END-USER INDUSTRIES 
           TABLE 35 OTHER END-USER INDUSTRIES: POWER SCADA MARKET, BY REGION,  2019–2022 (USD MILLION)
           TABLE 36 OTHER END-USER INDUSTRIES: POWER SCADA MARKET, BY REGION,  2023–2028 (USD MILLION)
 
8 POWER SCADA MARKET, BY COMPONENT (Page No. - 108)
    8.1 INTRODUCTION 
           FIGURE 29 REMOTE TERMINAL UNITS (RTUS) SEGMENT HELD LARGEST SHARE OF POWER SCADA MARKET IN 2022
           TABLE 37 POWER SCADA MARKET, BY COMPONENT, 2019–2022 (USD MILLION)
           TABLE 38 POWER SCADA MARKET, BY COMPONENT, 2023–2028 (USD MILLION)
    8.2 MASTER TERMINAL UNITS (MTUS) 
           8.2.1 USE TO MONITOR AND CONTROL COMPLETE POWER SCADA SYSTEMS TO DRIVE MARKET
                    TABLE 39 MASTER TERMINAL UNITS: POWER SCADA MARKET, BY REGION,  2019–2022 (USD MILLION)
                    TABLE 40 MASTER TERMINAL UNITS: POWER SCADA MARKET, BY REGION,  2023–2028 (USD MILLION)
    8.3 REMOTE TERMINAL UNITS (RTUS) 
           8.3.1 ADOPTION TO COLLECT DATA FROM REMOTE LOCATIONS TO DRIVE MARKET
                    TABLE 41 REMOTE TERMINAL UNITS: POWER SCADA MARKET, BY REGION,  2019–2022 (USD MILLION)
                    TABLE 42 REMOTE TERMINAL UNITS: POWER SCADA MARKET, BY REGION,  2023–2028 (USD MILLION)
    8.4 HUMAN–MACHINE INTERFACES (HMIS) 
           8.4.1 USE OF HUMAN–MACHINE INTERFACES FOR EFFECTIVE WORKING OF SYSTEMS TO DRIVE MARKET
                    TABLE 43 HUMAN–MACHINE INTERFACES: POWER SCADA MARKET, BY REGION,  2019–2022 (USD MILLION)
                    TABLE 44 HUMAN–MACHINE INTERFACES: POWER SCADA MARKET, BY REGION,  2023–2028 (USD MILLION)
    8.5 PROGRAMMABLE LOGIC CONTROLLERS (PLCS) 
           8.5.1 USE TO UNDERTAKE LOGIC-BASED DECISIONS TO DRIVE MARKET
                    TABLE 45 PROGRAMMABLE LOGIC CONTROLLERS: POWER SCADA MARKET, BY REGION,  2019–2022 (USD MILLION)
                    TABLE 46 PROGRAMMABLE LOGIC CONTROLLERS: POWER SCADA MARKET, BY REGION,  2023–2028 (USD MILLION)
    8.6 COMMUNICATION SYSTEMS 
           8.6.1 USE TO PROVIDE LINK FOR COMMUNICATION BETWEEN NODES IN SCADA NETWORK SYSTEMS TO FUEL MARKET GROWTH
                    TABLE 47 COMMUNICATION SYSTEMS: POWER SCADA MARKET, BY REGION,  2019–2022 (USD MILLION)
                    TABLE 48 COMMUNICATION SYSTEMS: POWER SCADA MARKET, BY REGION,  2023–2028 (USD MILLION)
    8.7 PROTECTION RELAYS (IEDS) 
           8.7.1 USE TO TAKE PREVENTIVE ACTION TO AVOID ANY DAMAGE TO DRIVE MARKET
                    TABLE 49 PROTECTION RELAYS (IEDS): POWER SCADA MARKET, BY REGION,  2019–2022 (USD MILLION)
                    TABLE 50 PROTECTION RELAYS (IEDS): POWER SCADA MARKET, BY REGION,  2023–2028 (USD MILLION)
    8.8 OTHER COMPONENTS 
           TABLE 51 OTHER COMPONENTS: POWER SCADA MARKET, BY REGION, 2019–2022 (USD MILLION)
           TABLE 52 OTHER COMPONENTS: POWER SCADA MARKET, BY REGION, 2023–2028 (USD MILLION)
 
9 POWER SCADA MARKET, BY REGION (Page No. - 121)
    9.1 INTRODUCTION 
           FIGURE 30 ASIA PACIFIC POWER SCADA MARKET TO REGISTER HIGHEST CAGR FROM  2023 TO 2028
           FIGURE 31 POWER SCADA MARKET SHARE, BY REGION, 2022 (%)
           TABLE 53 POWER SCADA MARKET, BY REGION, 2019–2022 (USD MILLION)
           TABLE 54 POWER SCADA MARKET, BY REGION, 2023–2028 (USD MILLION)
    9.2 ASIA PACIFIC 
           9.2.1 ASIA PACIFIC: RECESSION IMPACT
                    FIGURE 32 ASIA PACIFIC: POWER SCADA MARKET SNAPSHOT
           9.2.2 BY ARCHITECTURE
                    TABLE 55 ASIA PACIFIC: POWER SCADA MARKET, BY ARCHITECTURE, 2019–2022 (USD MILLION)
                    TABLE 56 ASIA PACIFIC: POWER SCADA MARKET, BY ARCHITECTURE, 2023–2028 (USD MILLION)
           9.2.3 BY COMPONENT
                    TABLE 57 ASIA PACIFIC: POWER SCADA MARKET, BY COMPONENT, 2019–2022 (USD MILLION)
                    TABLE 58 ASIA PACIFIC: POWER SCADA MARKET, BY COMPONENT, 2023–2028 (USD MILLION)
           9.2.4 BY END-USER INDUSTRY
                    TABLE 59 ASIA PACIFIC: POWER SCADA MARKET, BY END-USER INDUSTRY,  2019–2022 (USD MILLION)
                    TABLE 60 ASIA PACIFIC: POWER SCADA MARKET, BY END-USER INDUSTRY,  2023–2028 (USD MILLION)
           9.2.5 BY COUNTRY
                    TABLE 61 ASIA PACIFIC: POWER SCADA MARKET, BY COUNTRY, 2019–2022 (USD MILLION)
                    TABLE 62 ASIA PACIFIC: POWER SCADA MARKET, BY COUNTRY, 2023–2028 (USD MILLION)
                    9.2.5.1 China
                               9.2.5.1.1 Capitalization on growth opportunities in manufacturing and energy sectors to drive market
                               9.2.5.1.2 By architecture
                               TABLE 63 CHINA: POWER SCADA MARKET, BY ARCHITECTURE, 2019–2022 (USD MILLION)
                               TABLE 64 CHINA: POWER SCADA MARKET, BY ARCHITECTURE, 2023–2028 (USD MILLION)
                               9.2.5.1.3 By end-user industry
                               TABLE 65 CHINA: POWER SCADA MARKET, BY END-USER INDUSTRY, 2019–2022 (USD MILLION)
                               TABLE 66 CHINA: POWER SCADA MARKET, BY END-USER INDUSTRY, 2023–2028 (USD MILLION)
                    9.2.5.2 Japan
                               9.2.5.2.1 Robust growth of industrial and manufacturing sectors to drive demand
                               9.2.5.2.2 By architecture
                               TABLE 67 JAPAN: POWER SCADA MARKET, BY ARCHITECTURE, 2019–2022 (USD MILLION)
                               TABLE 68 JAPAN: POWER SCADA MARKET, BY ARCHITECTURE, 2023–2028 (USD MILLION)
                               9.2.5.2.3 By end-user industry
                               TABLE 69 JAPAN: POWER SCADA MARKET, BY END-USER INDUSTRY, 2019–2022 (USD MILLION)
                               TABLE 70 JAPAN: POWER SCADA MARKET, BY END-USER INDUSTRY, 2023–2028 (USD MILLION)
                    9.2.5.3 India
                               9.2.5.3.1 Rising focus on automation of water and wastewater systems to drive market
                               9.2.5.3.2 By architecture
                               TABLE 71 INDIA: POWER SCADA MARKET, BY ARCHITECTURE, 2019–2022 (USD MILLION)
                               TABLE 72 INDIA: POWER SCADA MARKET, BY ARCHITECTURE, 2023–2028 (USD MILLION)
                               9.2.5.3.3 By end-user industry
                               TABLE 73 INDIA: POWER SCADA MARKET, BY END-USER INDUSTRY, 2019–2022 (USD MILLION)
                               TABLE 74 INDIA: POWER SCADA MARKET, BY END-USER INDUSTRY, 2023–2028 (USD MILLION)
                    9.2.5.4 South Korea
                               9.2.5.4.1 Increasing innovation, industrialization, and technological advancements to drive demand
                               9.2.5.4.2 By architecture
                               TABLE 75 SOUTH KOREA: POWER SCADA MARKET, BY ARCHITECTURE, 2019–2022 (USD MILLION)
                               TABLE 76 SOUTH KOREA: POWER SCADA MARKET, BY ARCHITECTURE, 2023–2028 (USD MILLION)
                               9.2.5.4.3 By end-user industry
                               TABLE 77 SOUTH KOREA: POWER SCADA MARKET, BY END-USER INDUSTRY,  2019–2022 (USD MILLION)
                               TABLE 78 SOUTH KOREA: POWER SCADA MARKET, BY END-USER INDUSTRY,  2023–2028 (USD MILLION)
                    9.2.5.5 Australia
                               9.2.5.5.1 Rising automation investments, renewable energy integration, and technological advancements to drive market
                               9.2.5.5.2 By architecture
                               TABLE 79 AUSTRALIA: POWER SCADA MARKET, BY ARCHITECTURE, 2019–2022 (USD MILLION)
                               TABLE 80 AUSTRALIA: POWER SCADA MARKET, BY ARCHITECTURE, 2023–2028 (USD MILLION)
                               9.2.5.5.3 By end-user industry
                               TABLE 81 AUSTRALIA: POWER SCADA MARKET, BY END-USER INDUSTRY,  2019–2022 (USD MILLION)
                               TABLE 82 AUSTRALIA: POWER SCADA MARKET, BY END-USER INDUSTRY,  2023–2028 (USD MILLION)
                    9.2.5.6 Rest of Asia Pacific
                               9.2.5.6.1 By architecture
                               TABLE 83 REST OF ASIA PACIFIC: POWER SCADA MARKET, BY ARCHITECTURE,  2019–2022 (USD MILLION)
                               TABLE 84 REST OF ASIA PACIFIC: POWER SCADA MARKET, BY ARCHITECTURE,  2023–2028 (USD MILLION)
                               9.2.5.6.2 By end-user industry
                               TABLE 85 REST OF ASIA PACIFIC: POWER SCADA MARKET, BY END-USER INDUSTRY,  2019–2022 (USD MILLION)
                               TABLE 86 REST OF ASIA PACIFIC: POWER SCADA MARKET, BY END-USER INDUSTRY,  2023–2028 (USD MILLION)
    9.3 NORTH AMERICA 
           9.3.1 NORTH AMERICA: RECESSION IMPACT
                    FIGURE 33 NORTH AMERICA: POWER SCADA MARKET SNAPSHOT
           9.3.2 BY ARCHITECTURE
                    TABLE 87 NORTH AMERICA: POWER SCADA MARKET, BY ARCHITECTURE,  2019–2022 (USD MILLION)
                    TABLE 88 NORTH AMERICA: POWER SCADA MARKET, BY ARCHITECTURE,  2023–2028 (USD MILLION)
           9.3.3 BY COMPONENT
                    TABLE 89 NORTH AMERICA: POWER SCADA MARKET, BY COMPONENT, 2019–2022 (USD MILLION)
                    TABLE 90 NORTH AMERICA: POWER SCADA MARKET, BY COMPONENT, 2023–2028 (USD MILLION)
           9.3.4 BY END-USER INDUSTRY
                    TABLE 91 NORTH AMERICA: POWER SCADA MARKET, BY END-USER INDUSTRY,  2019–2022 (USD MILLION)
                    TABLE 92 NORTH AMERICA: POWER SCADA MARKET, BY END-USER INDUSTRY,  2023–2028 (USD MILLION)
           9.3.5 BY COUNTRY
                    TABLE 93 NORTH AMERICA: POWER SCADA MARKET, BY COUNTRY, 2019–2022 (USD MILLION)
                    TABLE 94 NORTH AMERICA: POWER SCADA MARKET, BY COUNTRY, 2023–2028 (USD MILLION)
                    9.3.5.1 US
                               9.3.5.1.1 Rising demand for industrial automation to drive market
                               9.3.5.1.2 By architecture
                               TABLE 95 US: POWER SCADA MARKET, BY ARCHITECTURE, 2019–2022 (USD MILLION)
                               TABLE 96 US: POWER SCADA MARKET, BY ARCHITECTURE, 2023–2028 (USD MILLION)
                               9.3.5.1.3 By end-user industry
                               TABLE 97 US: POWER SCADA MARKET, BY END-USER INDUSTRY, 2019–2022 (USD MILLION)
                               TABLE 98 US: POWER SCADA MARKET, BY END-USER INDUSTRY, 2023–2028 (USD MILLION)
                    9.3.5.2 Canada
                               9.3.5.2.1 Increasing emphasis on incorporating renewable energy sources into national power grids to drive market
                               9.3.5.2.2 By architecture
                               TABLE 99 CANADA: POWER SCADA MARKET, BY ARCHITECTURE, 2019–2022 (USD MILLION)
                               TABLE 100 CANADA: POWER SCADA MARKET, BY ARCHITECTURE, 2023–2028 (USD MILLION)
                               9.3.5.2.3 By end-user industry
                               TABLE 101 CANADA: POWER SCADA MARKET, BY END-USER INDUSTRY, 2019–2022 (USD MILLION)
                               TABLE 102 CANADA: POWER SCADA MARKET, BY END-USER INDUSTRY, 2023–2028 (USD MILLION)
                    9.3.5.3 Mexico
                               9.3.5.3.1 Rising adoption of power SCADA systems to streamline power grids to drive market
                               9.3.5.3.2 By architecture
                               TABLE 103 MEXICO: POWER SCADA MARKET, BY ARCHITECTURE, 2019–2022 (USD MILLION)
                               TABLE 104 MEXICO: POWER SCADA MARKET, BY ARCHITECTURE, 2023–2028 (USD MILLION)
                               9.3.5.3.3 By end-user industry
                               TABLE 105 MEXICO: POWER SCADA MARKET, BY END-USER INDUSTRY, 2019–2022 (USD MILLION)
                               TABLE 106 MEXICO: POWER SCADA MARKET, BY END-USER INDUSTRY, 2023–2028 (USD MILLION)
    9.4 EUROPE 
           9.4.1 EUROPE: RECESSION IMPACT
           9.4.2 BY ARCHITECTURE
                    TABLE 107 EUROPE: POWER SCADA MARKET, BY ARCHITECTURE, 2019–2022 (USD MILLION)
                    TABLE 108 EUROPE: POWER SCADA MARKET, BY ARCHITECTURE, 2023–2028 (USD MILLION)
           9.4.3 BY COMPONENT
                    TABLE 109 EUROPE: POWER SCADA MARKET, BY COMPONENT, 2019–2022 (USD MILLION)
                    TABLE 110 EUROPE: POWER SCADA MARKET, BY COMPONENT, 2023–2028 (USD MILLION)
           9.4.4 BY END-USER INDUSTRY
                    TABLE 111 EUROPE: POWER SCADA MARKET, BY END-USER INDUSTRY, 2019–2022 (USD MILLION)
                    TABLE 112 EUROPE: POWER SCADA MARKET, BY END-USER INDUSTRY, 2023–2028 (USD MILLION)
           9.4.5 BY COUNTRY
                    TABLE 113 EUROPE: POWER SCADA MARKET, BY COUNTRY, 2019–2022 (USD MILLION)
                    TABLE 114 EUROPE: POWER SCADA MARKET, BY COUNTRY, 2023–2028 (USD MILLION)
                    9.4.5.1 Germany
                               9.4.5.1.1 Growing use of power SCADA solutions for digital transformation in power and transportation sectors to drive market
                               9.4.5.1.2 By architecture
                               TABLE 115 GERMANY: POWER SCADA MARKET, BY ARCHITECTURE, 2019–2022 (USD MILLION)
                               TABLE 116 GERMANY: POWER SCADA MARKET, BY ARCHITECTURE, 2023–2028 (USD MILLION)
                               9.4.5.1.3 By end-user industry
                               TABLE 117 GERMANY: POWER SCADA MARKET, BY END-USER INDUSTRY,  2019–2022 (USD MILLION)
                               TABLE 118 GERMANY: POWER SCADA MARKET, BY END-USER INDUSTRY,  2023–2028 (USD MILLION)
                    9.4.5.2 France
                               9.4.5.2.1 Commitment to nuclear power and ambitious green initiatives to drive demand
                               9.4.5.2.2 By architecture
                               TABLE 119 FRANCE: POWER SCADA MARKET, BY ARCHITECTURE, 2019–2022 (USD MILLION)
                               TABLE 120 FRANCE: POWER SCADA MARKET, BY ARCHITECTURE, 2023–2028 (USD MILLION)
                               9.4.5.2.3 By end-user industry
                               TABLE 121 FRANCE: POWER SCADA MARKET, BY END-USER INDUSTRY, 2019–2022 (USD MILLION)
                               TABLE 122 FRANCE: POWER SCADA MARKET, BY END-USER INDUSTRY, 2023–2028 (USD MILLION)
                    9.4.5.3 UK
                               9.4.5.3.1 Focus on achieving net zero carbon emissions by 2050 to drive demand
                               9.4.5.3.2 By architecture
                               TABLE 123 UK: POWER SCADA MARKET, BY ARCHITECTURE, 2019–2022 (USD MILLION)
                               TABLE 124 UK: POWER SCADA MARKET, BY ARCHITECTURE, 2023–2028 (USD MILLION)
                               9.4.5.3.3 By end-user industry
                               TABLE 125 UK: POWER SCADA MARKET, BY END-USER INDUSTRY, 2019–2022 (USD MILLION)
                               TABLE 126 UK: POWER SCADA MARKET, BY END-USER INDUSTRY, 2023–2028 (USD MILLION)
                    9.4.5.4 Russia
                               9.4.5.4.1 Focus on grid modernization to drive demand
                               9.4.5.4.2 By architecture
                               TABLE 127 RUSSIA: POWER SCADA MARKET, BY ARCHITECTURE, 2019–2022 (USD MILLION)
                               TABLE 128 RUSSIA: POWER SCADA MARKET, BY ARCHITECTURE, 2023–2028 (USD MILLION)
                               9.4.5.4.3 By end-user industry
                               TABLE 129 RUSSIA: POWER SCADA MARKET, BY END-USER INDUSTRY, 2019–2022 (USD MILLION)
                               TABLE 130 RUSSIA: POWER SCADA MARKET, BY END-USER INDUSTRY, 2023–2028 (USD MILLION)
                    9.4.5.5 Italy
                               9.4.5.5.1 Increasing investments in pharmaceuticals industry to automate processes to drive demand
                               9.4.5.5.2 By architecture
                               TABLE 131 ITALY: POWER SCADA MARKET, BY ARCHITECTURE, 2019–2022 (USD MILLION)
                               TABLE 132 ITALY: POWER SCADA MARKET, BY ARCHITECTURE, 2023–2028 (USD MILLION)
                               9.4.5.5.3 By end-user industry
                               TABLE 133 ITALY: POWER SCADA MARKET, BY END-USER INDUSTRY, 2019–2022 (USD MILLION)
                               TABLE 134 ITALY: POWER SCADA MARKET, BY END-USER INDUSTRY, 2023–2028 (USD MILLION)
                    9.4.5.6 Rest of Europe
                               9.4.5.6.1 By architecture
                               TABLE 135 REST OF EUROPE: POWER SCADA MARKET, BY ARCHITECTURE,  2019–2022 (USD MILLION)
                               TABLE 136 REST OF EUROPE: POWER SCADA MARKET, BY ARCHITECTURE,  2023–2028 (USD MILLION)
                               9.4.5.6.2 By end-user industry
                               TABLE 137 REST OF EUROPE: POWER SCADA MARKET, BY END-USER INDUSTRY,  2019–2022 (USD MILLION)
                               TABLE 138 REST OF EUROPE: POWER SCADA MARKET, BY END-USER INDUSTRY,  2023–2028 (USD MILLION)
    9.5 MIDDLE EAST & AFRICA 
           9.5.1 MIDDLE EAST & AFRICA: RECESSION IMPACT
           9.5.2 BY ARCHITECTURE
                    TABLE 139 MIDDLE EAST & AFRICA: POWER SCADA MARKET, BY ARCHITECTURE,  2019–2022 (USD MILLION)
                    TABLE 140 MIDDLE EAST & AFRICA: POWER SCADA MARKET, BY ARCHITECTURE,  2023–2028 (USD MILLION)
           9.5.3 BY COMPONENT
                    TABLE 141 MIDDLE EAST & AFRICA: POWER SCADA MARKET, BY COMPONENT,  2019–2022 (USD MILLION)
                    TABLE 142 MIDDLE EAST & AFRICA: POWER SCADA MARKET, BY COMPONENT,  2023–2028 (USD MILLION)
           9.5.4 BY END-USER INDUSTRY
                    TABLE 143 MIDDLE EAST & AFRICA: POWER SCADA MARKET, BY END-USER INDUSTRY, 2019–2022 (USD MILLION)
                    TABLE 144 MIDDLE EAST & AFRICA: POWER SCADA MARKET, BY END-USER INDUSTRY,  2023–2028 (USD MILLION)
           9.5.5 BY COUNTRY
                    TABLE 145 MIDDLE EAST & AFRICA: POWER SCADA MARKET, BY COUNTRY,  2019–2022 (USD MILLION)
                    TABLE 146 MIDDLE EAST & AFRICA: POWER SCADA MARKET, BY COUNTRY,  2023–2028 (USD MILLION)
                    9.5.5.1 Saudi Arabia
                               9.5.5.1.1 Focus on diversifying energy mix through solar and wind power projects to drive demand
                               9.5.5.1.2 By architecture
                               TABLE 147 SAUDI ARABIA: POWER SCADA MARKET, BY ARCHITECTURE, 2019–2022 (USD MILLION)
                               TABLE 148 SAUDI ARABIA: POWER SCADA MARKET, BY ARCHITECTURE, 2023–2028 (USD MILLION)
                               9.5.5.1.3 By end-user industry
                               TABLE 149 SAUDI ARABIA: POWER SCADA MARKET, BY END-USER INDUSTRY,  2019–2022 (USD MILLION)
                               TABLE 150 SAUDI ARABIA: POWER SCADA MARKET, BY END-USER INDUSTRY,  2023–2028 (USD MILLION)
                    9.5.5.2 UAE
                               9.5.5.2.1 Optimization of oil & gas infrastructure to drive demand
                               9.5.5.2.2 By architecture
                               TABLE 151 UAE: POWER SCADA MARKET, BY ARCHITECTURE, 2019–2022 (USD MILLION)
                               TABLE 152 UAE: POWER SCADA MARKET, BY ARCHITECTURE, 2023–2028 (USD MILLION)
                               9.5.5.2.3 By end-user industry
                               TABLE 153 UAE: POWER SCADA MARKET, BY END-USER INDUSTRY, 2019–2022 (USD MILLION)
                               TABLE 154 UAE: POWER SCADA MARKET, BY END-USER INDUSTRY, 2023–2028 (USD MILLION)
                    9.5.5.3 South Africa
                               9.5.5.3.1 Lack of skilled labor in mining industry to drive demand
                               9.5.5.3.2 By architecture
                               TABLE 155 SOUTH AFRICA: POWER SCADA MARKET, BY ARCHITECTURE, 2019–2022 (USD MILLION)
                               TABLE 156 SOUTH AFRICA: POWER SCADA MARKET, BY ARCHITECTURE,  2023–2028 (USD MILLION)
                               9.5.5.3.3 By end-user industry
                               TABLE 157 SOUTH AFRICA: POWER SCADA MARKET, BY END-USER INDUSTRY,  2019–2022 (USD MILLION)
                               TABLE 158 SOUTH AFRICA: POWER SCADA MARKET, BY END-USER INDUSTRY,  2023–2028 (USD MILLION)
                    9.5.5.4 Rest of Middle East & Africa
                               9.5.5.4.1 By architecture
                               TABLE 159 REST OF MIDDLE EAST & AFRICA: POWER SCADA MARKET, BY ARCHITECTURE,  2019–2022 (USD MILLION)
                               TABLE 160 REST OF MIDDLE EAST & AFRICA: POWER SCADA MARKET, BY ARCHITECTURE,  2023–2028 (USD MILLION)
                               9.5.5.4.2 By end-user industry
                               TABLE 161 REST OF MIDDLE EAST & AFRICA: POWER SCADA MARKET, BY END-USER INDUSTRY, 2019–2022 (USD MILLION)
                               TABLE 162 REST OF MIDDLE EAST & AFRICA: POWER SCADA MARKET, BY END-USER INDUSTRY, 2023–2028 (USD MILLION)
    9.6 SOUTH AMERICA 
           9.6.1 SOUTH AMERICA: RECESSION IMPACT
           9.6.2 BY ARCHITECTURE
                    TABLE 163 SOUTH AMERICA: POWER SCADA MARKET, BY ARCHITECTURE,  2019–2022 (USD MILLION)
                    TABLE 164 SOUTH AMERICA: POWER SCADA MARKET, BY ARCHITECTURE,  2023–2028 (USD MILLION)
           9.6.3 BY COMPONENT
                    TABLE 165 SOUTH AMERICA: POWER SCADA MARKET, BY COMPONENT, 2019–2022 (USD MILLION)
                    TABLE 166 SOUTH AMERICA: POWER SCADA MARKET, BY COMPONENT, 2023–2028 (USD MILLION)
           9.6.4 BY END-USER INDUSTRY
                    TABLE 167 SOUTH AMERICA: POWER SCADA MARKET, BY END-USER INDUSTRY,  2019–2022 (USD MILLION)
                    TABLE 168 SOUTH AMERICA: POWER SCADA MARKET, BY END-USER INDUSTRY,  2023–2028 (USD MILLION)
           9.6.5 BY COUNTRY
                    TABLE 169 SOUTH AMERICA: POWER SCADA MARKET, BY COUNTRY, 2019–2022 (USD MILLION)
                    TABLE 170 SOUTH AMERICA: POWER SCADA MARKET, BY COUNTRY, 2023–2028 (USD MILLION)
                    9.6.5.1 Brazil
                               9.6.5.1.1 Need to upgrade and automate existing hydropower plants to drive demand
                               9.6.5.1.2 By architecture
                               TABLE 171 BRAZIL: POWER SCADA MARKET, BY ARCHITECTURE, 2019–2022 (USD MILLION)
                               TABLE 172 BRAZIL: POWER SCADA MARKET, BY ARCHITECTURE, 2023–2028 (USD MILLION)
                               9.6.5.1.3 By end-user industry
                               TABLE 173 BRAZIL: POWER SCADA MARKET, BY END-USER INDUSTRY, 2019–2022 (USD MILLION)
                               TABLE 174 BRAZIL: POWER SCADA MARKET, BY END-USER INDUSTRY, 2023–2028 (USD MILLION)
                    9.6.5.2 Argentina
                               9.6.5.2.1 Deployment of power SCADA solutions in oil & gas, hydropower, and renewable energy industries to drive market
                               9.6.5.2.2 By architecture
                               TABLE 175 ARGENTINA: POWER SCADA MARKET, BY ARCHITECTURE, 2019–2022 (USD MILLION)
                               TABLE 176 ARGENTINA: POWER SCADA MARKET, BY ARCHITECTURE, 2023–2028 (USD MILLION)
                               9.6.5.2.3 By end-user industry
                               TABLE 177 ARGENTINA: POWER SCADA MARKET, BY END-USER INDUSTRY,  2019–2022 (USD MILLION)
                               TABLE 178 ARGENTINA: POWER SCADA MARKET, BY END-USER INDUSTRY,  2023–2028 (USD MILLION)
                    9.6.5.3 Rest of South America
                               9.6.5.3.1 By architecture
                               TABLE 179 REST OF SOUTH AMERICA: POWER SCADA MARKET, BY ARCHITECTURE,  2019–2022 (USD MILLION)
                               TABLE 180 REST OF SOUTH AMERICA: POWER SCADA MARKET, BY ARCHITECTURE,  2023–2028 (USD MILLION)
                               9.6.5.3.2 By end-user industry
                               TABLE 181 REST OF SOUTH AMERICA: POWER SCADA MARKET, BY END-USER INDUSTRY,  2019–2022 (USD MILLION)
                               TABLE 182 REST OF SOUTH AMERICA: POWER SCADA MARKET, BY END-USER INDUSTRY,  2023–2028 (USD MILLION)
 
10 COMPETITIVE LANDSCAPE (Page No. - 187)
     10.1 OVERVIEW 
     10.2 KEY STRATEGIES ADOPTED BY MAJOR PLAYERS 
               TABLE 183 POWER SCADA MARKET: OVERVIEW OF KEY STRATEGIES ADOPTED BY MAJOR PLAYERS, JANUARY 2020–DECEMBER 2023
     10.3 MARKET SHARE ANALYSIS, 2022 
               TABLE 184 POWER SCADA MARKET: DEGREE OF COMPETITION, 2022
               FIGURE 34 POWER SCADA MARKET SHARE ANALYSIS, 2022
     10.4 MARKET EVALUATION FRAMEWORK, 2020–2023 
               TABLE 185 MARKET EVALUATION FRAMEWORK, 2020–2023
     10.5 REVENUE ANALYSIS, 2018–2022 
               FIGURE 35 POWER SCADA MARKET: REVENUE ANALYSIS OF TOP FIVE COMPANIES,  2018–2022
     10.6 COMPANY EVALUATION MATRIX, 2022 
             10.6.1 STARS
             10.6.2 EMERGING LEADERS
             10.6.3 PERVASIVE PLAYERS
             10.6.4 PARTICIPANTS
                       FIGURE 36 POWER SCADA MARKET: COMPANY EVALUATION MATRIX, 2022
             10.6.5 COMPANY FOOTPRINT
                       TABLE 186 COMPANY OVERALL FOOTPRINT
                       TABLE 187 COMPANY ARCHITECTURE FOOTPRINT
                       TABLE 188 COMPANY END-USER INDUSTRY FOOTPRINT
                       TABLE 189 COMPANY REGION FOOTPRINT
     10.7 COMPETITIVE SCENARIOS AND TRENDS 
             10.7.1 PRODUCT LAUNCHES
                       TABLE 190 POWER SCADA MARKET: PRODUCT LAUNCHES, JANUARY 2020–DECEMBER 2023
             10.7.2 DEALS
                       TABLE 191 POWER SCADA MARKET: DEALS, MAY 2020–DECEMBER 2023
             10.7.3 OTHERS
                       TABLE 192 POWER SCADA MARKET: OTHERS, JANUARY 2020–DECEMBER 2023
 
11 COMPANY PROFILES (Page No. - 202)
(Business overview, Products/ Solutions offered, Recent Developments, MNM view)*
     11.1 KEY PLAYERS 
             11.1.1 ABB
                       TABLE 193 ABB: COMPANY OVERVIEW
                       FIGURE 37 ABB: COMPANY SNAPSHOT
                       TABLE 194 ABB: PRODUCTS/SOLUTIONS OFFERED
                       TABLE 195 ABB: PRODUCT LAUNCHES
                       TABLE 196 ABB: DEALS
             11.1.2 SIEMENS
                       TABLE 197 SIEMENS: COMPANY OVERVIEW
                       FIGURE 38 SIEMENS: COMPANY SNAPSHOT
                       TABLE 198 SIEMENS: PRODUCTS/SOLUTIONS OFFERED
                       TABLE 199 SIEMENS: DEALS
                       TABLE 200 SIEMENS: OTHERS
             11.1.3 EMERSON
                       TABLE 201 EMERSON: COMPANY OVERVIEW
                       FIGURE 39 EMERSON: COMPANY SNAPSHOT
                       TABLE 202 EMERSON: PRODUCT/SOLUTIONS OFFERED
                       TABLE 203 EMERSON: PRODUCT LAUNCHES
                       TABLE 204 EMERSON: DEALS
             11.1.4 SCHNEIDER ELECTRIC
                       TABLE 205 SCHNEIDER ELECTRIC: COMPANY OVERVIEW
                       FIGURE 40 SCHNEIDER ELECTRIC: COMPANY SNAPSHOT
                       TABLE 206 SCHNEIDER ELECTRIC: PRODUCTS/SOLUTIONS OFFERED
                       TABLE 207 SCHNEIDER ELECTRIC: PRODUCT LAUNCHES
                       TABLE 208 SCHNEIDER ELECTRIC: DEALS
             11.1.5 ROCKWELL AUTOMATION
                       TABLE 209 ROCKWELL AUTOMATION: COMPANY OVERVIEW
                       FIGURE 41 ROCKWELL: COMPANY SNAPSHOT
                       TABLE 210 ROCKWELL AUTOMATION: PRODUCTS/SOLUTIONS OFFERED
                       TABLE 211 ROCKWELL AUTOMATION: DEALS
             11.1.6 MITSUBISHI ELECTRIC
                       TABLE 212 MITSUBISHI ELECTRIC: COMPANY OVERVIEW
                       FIGURE 42 MITSUBISHI ELECTRIC: COMPANY SNAPSHOT
                       TABLE 213 MITSUBISHI ELECTRIC: PRODUCTS/SOLUTIONS OFFERED
                       TABLE 214 MITSUBISHI ELECTRIC: DEALS
                       TABLE 215 MITSUBISHI ELECTRIC: OTHERS
             11.1.7 HONEYWELL
                       TABLE 216 HONEYWELL: COMPANY OVERVIEW
                       FIGURE 43 HONEYWELL: COMPANY SNAPSHOT
                       TABLE 217 HONEYWELL: PRODUCTS/SOLUTIONS OFFERED
                       TABLE 218 HONEYWELL: PRODUCT LAUNCHES
                       TABLE 219 HONEYWELL: DEALS
             11.1.8 YOKOGAWA ELECTRIC CORPORATION
                       TABLE 220 YOKOGAWA: COMPANY OVERVIEW
                       FIGURE 44 YOKOGAWA ELECTRIC CORPORATION: COMPANY SNAPSHOT
                       TABLE 221 YOKOGAWA ELECTRIC CORPORATION: PRODUCTS/SOLUTIONS OFFERED
                       TABLE 222 YOKOGAWA ELECTRIC CORPORATION: PRODUCT LAUNCHES
                       TABLE 223 YOKOGAWA ELECTRIC CORPORATION: DEALS
             11.1.9 OPEN SYSTEM INTERNATIONAL
                       TABLE 224 OPEN SYSTEM INTERNATIONAL: COMPANY OVERVIEW
                       TABLE 225 OPEN SYSTEMS INTERNATIONAL: PRODUCTS/SOLUTIONS OFFERED
                       TABLE 226 OPEN SYSTEMS INTERNATIONAL: DEALS
             11.1.10 INDRA SISTEMAS
                       TABLE 227 INDRA SISTEMAS: COMPANY OVERVIEW
                       TABLE 228 INDRA SISTEMAS: PRODUCTS/SOLUTIONS OFFERED
                       TABLE 229 INDRA SISTEMAS: PRODUCT LAUNCHES
                       TABLE 230 INDRA SISTEMAS-DEALS
             11.1.11 MOTOROLA SOLUTIONS
                       TABLE 231 MOTOROLA SOLUTIONS: COMPANY OVERVIEW
                       FIGURE 45 MOTOROLA SOLUTIONS: COMPANY SNAPSHOT
                       TABLE 232 MOTOROLA SOLUTIONS: PRODUCTS/SOLUTIONS OFFERED
                       TABLE 233 MOTOROLA SOLUTIONS: DEALS
             11.1.12 BENTEK SYSTEMS
                       TABLE 234 BENTEK SYSTEMS: COMPANY OVERVIEW
                       TABLE 235 BENTEK SYSTEMS: PRODUCTS/SOLUTIONS OFFERED
             11.1.13 EFACEC POWER SOLUTIONS
                       TABLE 236 EFACEC POWER SOLUTIONS: COMPANY OVERVIEW
                       TABLE 237 EFACEC POWER SOLUTIONS: PRODUCTS/SOLUTIONS OFFERED
                       TABLE 238 EFACEC POWER SOLUTIONS: DEALS
             11.1.14 EATON
                       TABLE 239 EATON: COMPANY OVERVIEW
                       FIGURE 46 EATON: COMPANY SNAPSHOT
                       TABLE 240 EATON: PRODUCTS/SOLUTIONS OFFERED
             11.1.15 GENERAL ELECTRIC
                       TABLE 241 GENERAL ELECTRIC: COMPANY OVERVIEW
                       FIGURE 47 GENERAL ELECTRIC: COMPANY SNAPSHOT
                       TABLE 242 GENERAL ELECTRIC: PRODUCTS/SOLUTIONS OFFERED
                       TABLE 243 GENERAL ELECTRIC: DEALS
             11.1.16 PSI AG
                       TABLE 244 PSI AG: COMPANY OVERVIEW
                       FIGURE 48 PSI AG: COMPANY SNAPSHOT
                       TABLE 245 PSI AG: PRODUCTS/SOLUTIONS OFFERED
                       TABLE 246 PSI AG: DEALS
     11.2 OTHER PLAYERS 
             11.2.1 TOSHIBA
             11.2.2 HITACHI
             11.2.3 OUTLAW AUTOMATION
             11.2.4 OMRON TECHNOLOGIES
             11.2.5 ADVANTECH CO
             11.2.6 INDUCTIVE AUTOMATION
             11.2.7 SURVALENT TECHNOLOGY CORPORATION
             11.2.8 NUGEN AUTOMATION
             11.2.9 OVAK TECHNOLOGIES
*Details on Business overview, Products/ Solutions offered, Recent Developments, MNM view might not be captured in case of unlisted companies.
 
12 APPENDIX (Page No. - 261)
     12.1 INSIGHTS FROM INDUSTRY EXPERTS 
     12.2 DISCUSSION GUIDE 
     12.3 KNOWLEDGESTORE: MARKETSANDMARKETS’  SUBSCRIPTION PORTAL 
     12.4 CUSTOMIZATION OPTIONS 
     12.5 RELATED REPORTS 
     12.6 AUTHOR DETAILS 

This study extensively investigated the current size of the power SCADA market, initiating with a thorough secondary research phase dedicated to gathering data on the market, related markets, and the broader industry landscape. The collected information, along with assumptions and calculated market sizes, underwent rigorous validation in the subsequent primary research phase, which involved consultations with industry experts spanning the entire value chain. The assessment of the overall market size was tailored to each country, followed by a detailed market dissection where the data was cross-referenced to estimate the sizes of various segments and sub-segments. This two-phased approach, incorporating both secondary and primary research methodologies, enhances the reliability and accuracy of the study's findings.

Secondary Research

Throughout this research study, a wide range of secondary sources was utilized, incorporating directories, databases, and reputable references such as Hoover's, Bloomberg BusinessWeek, Factiva, World Bank, the US Department of Energy (DOE), and the International Energy Agency (IEA). These sources played a crucial role in gathering valuable data necessary for conducting a thorough analysis of the global power SCADA market. Covering technical, market-oriented, and commercial aspects, these secondary sources significantly contributed to the study's depth and breadth. Additional secondary sources encompassed annual reports, press releases, investor presentations, whitepapers, authoritative publications, articles by esteemed experts, information from industry associations, trade directories, and various database resources. The diverse range of secondary sources employed ensures a robust and well-informed foundation for the research study.

Primary Research

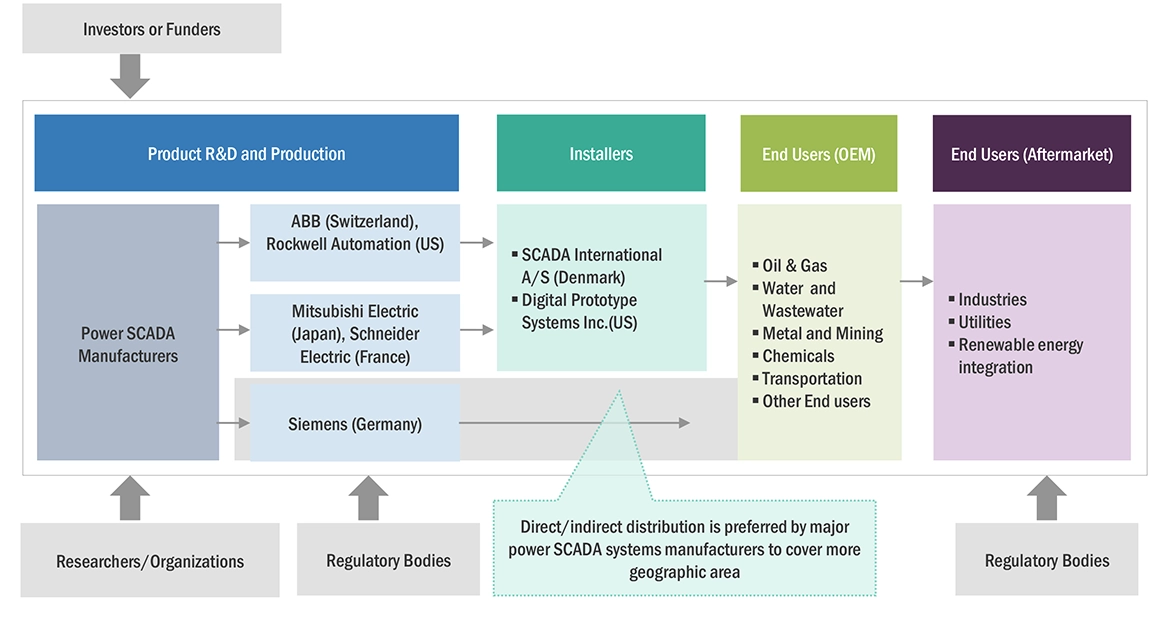
The power SCADA market involves various stakeholders throughout its supply chain, including component manufacturers, product manufacturers/assemblers, service providers, distributors, and end-user industries. The primary driver of market demand originates from industrial end-users, while the increasing needs of transmission and distribution utilities also contribute significantly to market growth. On the supply side, a noticeable trend is the heightened demand for contracts from the industrial sector, accompanied by a notable prevalence of mergers and acquisitions among major industry players.

To gain a comprehensive understanding of the market, both qualitatively and quantitatively, a diverse set of primary sources from both the supply and demand sides underwent interviews. The breakdown below outlines the primary respondents who played a crucial role in providing insights for the research study.

Power SCADA Market Size, and Share

To know about the assumptions considered for the study, download the pdf brochure

Market Size Estimation

Top-down and bottom-up approaches are combined in the research strategy to evaluate the size of the global power SCADA market and its associated submarkets. The sizes of the market's several subsegments were ascertained by carefully applying these techniques. The following essential phases comprise the research process.

  • This methodology has examined production data for all types of power SCADA systems at both the national and regional levels.
  • A comprehensive understanding of the global market environment for various power SCADA system types has been achieved through extensive secondary and primary research.
  • Several primary interviews with notable power SCADA system development specialists, including important OEMs and Tier I suppliers, have been undertaken.
  • When evaluating and projecting the market size, qualitative factors such as market drivers, restraints, opportunities, and challenges have been taken into account.

Global power SCADA Market Size: Bottom-Up Approach

Power SCADA Market Bottom Up Approach

To speak to our analyst for a discussion on the above findings, click Speak to Analyst

Global power SCADA Market Size: Top-Down Approach

Power SCADA Market Top Down Approach

Data Triangulation

The procedure for determining the overall market size involved the previously outlined methodologies, which included segmenting the market into various segments and subsegments. To conclude the comprehensive market analysis and obtain accurate statistics for each market segment and subsegment, the implementation of data triangulation and market segmentation techniques was deemed essential. Data triangulation entailed a thorough examination of various factors and trends from both the demand and supply perspectives within the ecosystem of the power SCADA market.

Market Definition

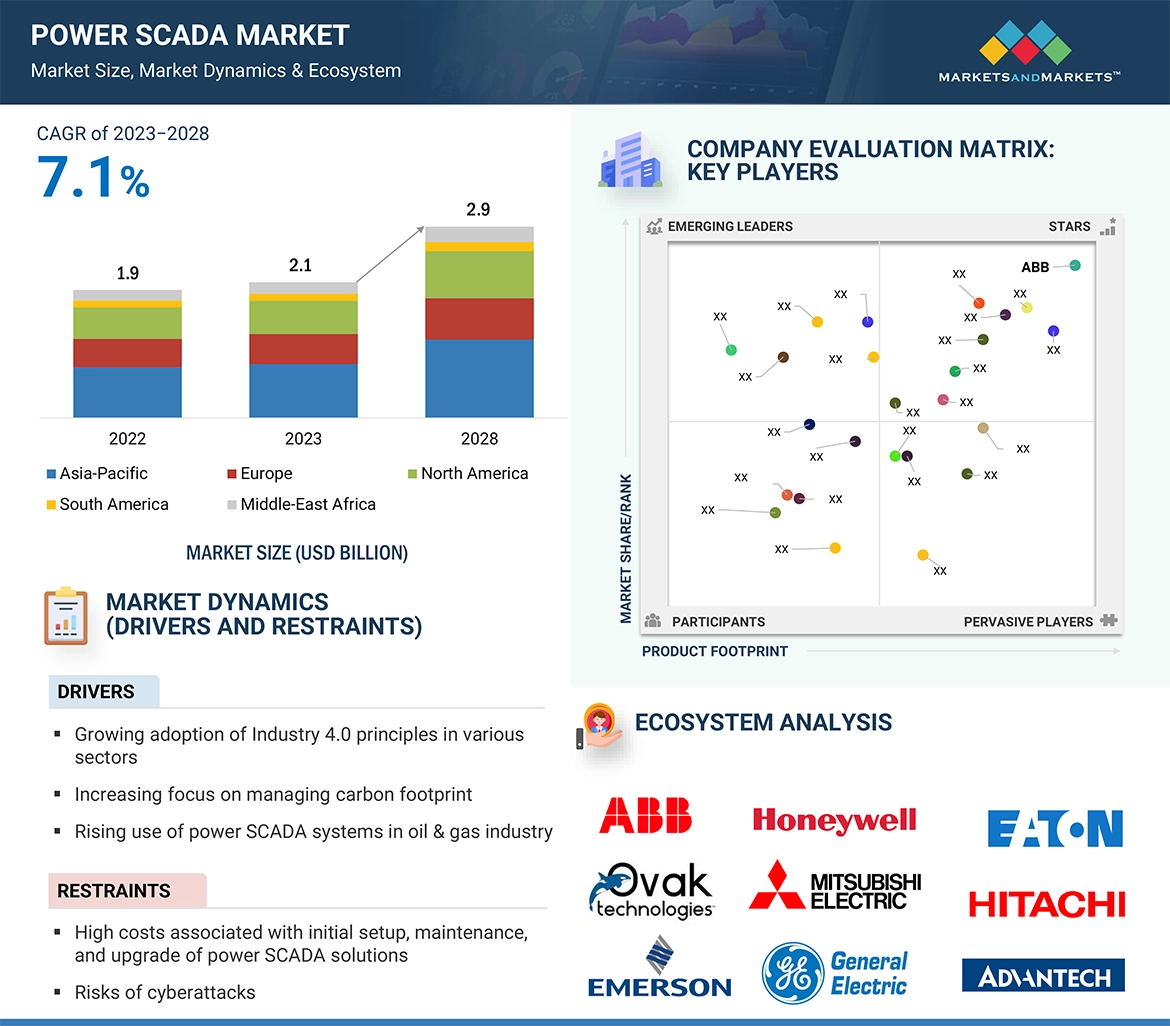
The Power SCADA (Supervisory Control and Data Acquisition) market refers to the industry involved in providing advanced control and monitoring solutions for power systems. This technology encompasses a comprehensive suite of hardware and software components that enable real-time supervision and data acquisition across power generation, transmission, and distribution processes. Power SCADA systems play a pivotal role in enhancing operational efficiency, reliability, and automation within the power sector, utilizing a centralized platform to monitor diverse elements of the infrastructure. These systems are crucial for managing the complexities of modern power networks, facilitating the integration of renewable energy sources, and supporting the overall digitization of power infrastructure. The market encompasses various stakeholders, including component manufacturers, product assemblers, service providers, distributors, and end-users in industries such as utilities and manufacturing, contributing to the growth and evolution of the Power SCADA market.

Key Stakeholders

  • Government Utility Providers
  • Independent Power Producers
  • SCADA System Developers
  • Power equipment and garden tool manufacturers
  • Consulting companies in the energy & power sector
  • Distribution utilities
  • Government and research organizations
  • Organizations, forums, and associations
  • Raw material suppliers
  • State and national regulatory authorities
  • SCADA System Developers, distributors, and suppliers
  • SCADA System original equipment manufacturers (OEMs)

Objectives of the Study

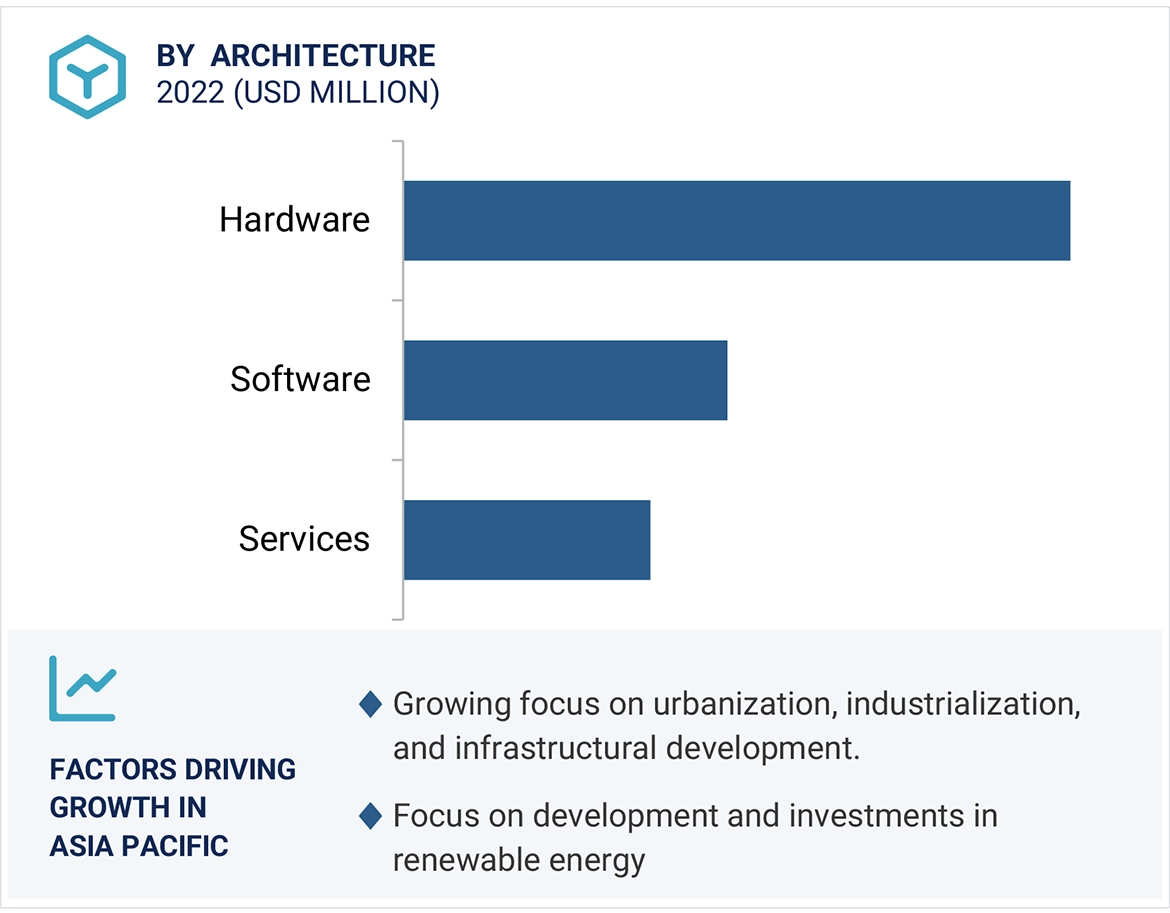
  • Based on variables like component, architecture, and end-use industry, the power SCADA system market will be defined, characterised, categorised, and forecasted.
  • To project market sizes for the major countries in each of these five regions, as well as those for North America, South America, Europe, Asia Pacific, the Middle East, and Africa.
  • To provide in-depth analyses of the elements driving market dynamics, industry-specific opportunities, constraints, and difficulties.
  • To systematically assess the market share, growth trends, and prospects of each subsegment.
  • To evaluate the competitive landscape for leaders in the industry and the market prospects for interested parties.
  • To create strategic profiles of the top players by closely examining their market shares and essential strengths.
  • To monitor and assess competitive changes in the power SCADA market, including as joint ventures, acquisitions, contracts, partnerships, agreements, sales contracts, new product launches, expansions, and investments.
  • The market for power SCADA is evaluated in this report.

Available Customization

With the given market data, MarketsandMarkets offers customizations based on the company’s specific needs. The following customization options are available for the report:

Product Analysis

  • Product Matrix, which provides a detailed comparison of the product portfolio of each company

Company Information

  • Detailed analyses and profiling of additional market players (up to 5)
Custom Market Research Services

We will customize the research for you, in case the report listed above does not meet with your exact requirements. Our custom research will comprehensively cover the business information you require to help you arrive at strategic and profitable business decisions.

Request Customization

Instant Answers with GPT - Ask Now!

Ask real questions. Get complete answers !
Report Code
EP 7902
Published ON
Jan, 2024
Choose License Type
BUY NOW
  • SHARE
X
Request Customization
Speak to Analyst
Speak to Analyst
OR FACE-TO-FACE MEETING
PERSONALIZE THIS RESEARCH
  • Triangulate with your Own Data
  • Get Data as per your Format and Definition
  • Gain a Deeper Dive on a Specific Application, Geography, Customer or Competitor
  • Any level of Personalization
REQUEST A FREE CUSTOMIZATION
LET US HELP YOU!
  • What are the Known and Unknown Adjacencies Impacting the Power SCADA Market
  • What will your New Revenue Sources be?
  • Who will be your Top Customer; what will make them switch?
  • Defend your Market Share or Win Competitors
  • Get a Scorecard for Target Partners
CUSTOMIZED WORKSHOP REQUEST
+1-888-600-6441
  • Call Us
  • +1-888-600-6441 (Corporate office hours)
  • +1-888-600-6441 (US/Can toll free)
  • +44-800-368-9399 (UK office hours)
CONNECT WITH US
ABOUT TRUST ONLINE
©2024 MarketsandMarkets Research Private Ltd. All rights reserved
DMCA.com Protection Status Website Feedback