Restorative Dentistry Market: Growth, Size, Share, and Trends

Restorative Dentistry Market by Product (Material (Composite, Glass Ionomer, Adhesive, Metal)), Rotary Instrument, Equipment (CAD/CAM, Intraoral scanner, CBCT, X-ray)), End User (DSO, Clinic, Hospital), Cavity Type, Key Stakeholders - Global Forecast to 2028

Report Code: MD 5593 Nov, 2023, by marketsandmarkets.com

Market Growth Outlook Summary

The global restorative dentistry market growth forecasted to transform from $5.6 billion in 2023 to $7.4 billion by 2028, driven by a CAGR of 5.5%. Growth in this market is largely driven by the rise in the number of patients suffering from dental disorders and increasing of the technological advancements in the dental procedures. The microleakage in composite restorations is becoming a challenge as the placement of composite resins is highly technique sensitive and may result in shrinkage if placed incorrectly. These materials are more prone to microleakage than other restorative materials.

Attractive Opportunities in Restorative Dentistry Market

Restorative dentistry Market

To know about the assumptions considered for the study, Request for Free Sample Report

Restorative dentistry Market

Restorative Dentistry Market Dynamics

Driver: Lifestyle Changes and unhealthy food habits

Some of the major causes of rise in restorative dentistry is due to Increase in the consumption of food with high content of sugar, Chocolates, sugary cookies, cakes, ice cream which contains sugar in abundance due to which the bacteria present in the mouth grow .As a result of high sugar. According to the American Dental Association (ADA), growing number of people opting for oral piercing results in a high infection rate. The oral piercings are nowadays commonly seen in young adults, and the tongue is considered the most common site for these oral piercing. This results in bleeding, chipped or damaged teeth, lacerations/scarring, palatal erythema, swelling, gingival recession, or unusual discharge from the pierced region. Such instances support the demand for dental procedures.

Restraint: Intricacies of using traditional dental composites

The process of placing composite restorations can be time consuming and technique sensitive, especially in bigger and deeper cavities. This can be due to several thin layer placements (usually 2 mm or less) required for dental composites, and incremental light-curing needs to be done after placing each layer. In addition to preventing shrinkage and voids, this is essential to guarantee that the composite cures fully and the resultant restoration has adequate strength to absorb the forces of mastication. This will be a major factor responsible for the slower growth of the market despite the increasing demand.

Opportunity: Rising disposable incomes in developing countries

The increase in the income levels in developing countries such as India, China, and Brazil, with a relatively high decayed, missing, and filled teeth (DMFT) index, are expected to boost restorative dental products. According to a research study conducted by the International Monetary Fund, one of the leading economic communities in the world-China has shown a considerable increase in the per capita national income. The general growth in the per capita income will result in an increase of the dental healthcare expenditure among the population, henceforth driving the uptake of dental treatments in the country. Thus, population growth in emerging markets, coupled with increasing healthcare spending, is expected to offer opportunities for developing the restorative dentistry market in emerging countries.

Challenges: Dearth of Dental practitioners

The demand for dental care services is expected to increase globally due to the changing demographics as the population is increasing, growing dental care awareness, and the rising prevalence of dental diseases. However, a shortage of dental professionals in countries poses a significant challenge for the restorative dentistry market. For instance, in Africa, the dentist-to-population ratio is ~1:150,000 (this figure is ~1:2,000 in developed countries). The shortage of dentists in these countries is one of the major challenges expected to reduce the adoption of restorative dentistry despite their large target patient population.

Restorative Dentistry Market Ecosystem

Leading players in this market include well-established and financially stable service providers of restorative dentistry. These companies have been operating in the market for several years and possess a diversified product portfolio, advanced technologies, and strong global presence. Prominent companies in this market include DENTSPLY SIORNA Inc, (US0, 3M Company (US) and Envista Holdings Corporation (US).

Restorative dentistry Market Ecosystem

By product segment, the materials segment accounted for the fastest growing segment of the restorative dentistry industry in 2022.

By product, the material segment of the restorative dentistry market is accounted for fastest growing segment. The rise in the number of tooth repair procedures, growing demand for advanced cosmetic dental procedures, growing market for dental tourism in emerging countries, development of technologically advanced solutions, and lifestyle changes & unhealthy food habits are some of the factors which are attributed to the growth of the material segment in restorative dentistry market. The materials are used in dental restorative procedures to restore missing or decayed teeth, and hence are chosen based on the type or surface of the tooth, which requires restoration.

The Type II cavity segment of the restorative dentistry industry is estimated to grow at a higher CAGR during the forecast period.

Based on classification of class, the restorative dentistry market is segmented into class I, class II, class III, class IV, class V and class VI. The class II cavity segment is estimated to grow at a higher CAGR during the forecast period. Cavity II, also known as secondary caries, is a type of cavity that forms on a tooth that has already been filled. It can occur for a number of reasons including marginal leakage which happens when the filling material does not completely seal the tooth, allowing bacteria and plaque to seep in and cause decay.

The dental hospitals and clinics segment of the restorative dentistry industry is expected to grow at the highest CAGR during the forecast period.

The restorative dentistry market is segmented into dental hospitals and clinics, dental laboratories and  other end users. The dental hospitals and clinics is the fastest-growing segment for restorative dentistry, mainly due to their convenience to patients. The factors which are supporting the market growth are the increasing number of dental clinics and hospitals (especially in emerging markets) and the rapid adoption of advanced technologies.

North America is estimated to be the fastest-growing regional market for restorative dentistry industry.

The global restorative dentistry market is segmented into Asia Pacific, North America, Europe, Latin America, and the Middle East & Africa. In 2022, North America is estimated to be the fastest-growing regional market for restorative dentistry. The North America market is considered one of the fastest-growing medical procedures and devices markets. Low infrastructure and treatment costs and the availability of highly educated physicians have driven medical tourists to North American countries.

Restorative dentistry Market by Region

To know about the assumptions considered for the study, download the pdf brochure

The restorative dentistry market is dominated by a few globally established players such as DENTSPLY SIRONA Inc, (US), 3M Company (US), and Envisat Holdings Corporation (US). Major players adopt growth strategies to expand their geographical presence and garner higher shares in the global market.

Scope of the Restorative Dentistry Industry

Report Metric

Details

Market Revenue in 2023

$5.6 billion

Projected Revenue by 2028

$7.4 billion

Revenue Rate

Poised to Grow at a CAGR of 5.5%

Market Driver

Lifestyle Changes and unhealthy food habits

Market Opportunity

Rising disposable incomes in developing countries

This research report categorizes the restorative dentistry market to forecast revenue and analyze trends in each of the following submarkets:

By Product

  • Materials
    • Direct restorative
  • Amalgams
  • Composites
  • Glass ionomers cements
  • other direct restorative materials  (BONDING AGENTS)
    • InDirect restorative materials
  • Metals
  • Ceramics
  • Instruments
  • Handheld Instruments
  • Rotary Instruments
  • Equipment
    • Fabrication Equipment
  • Light Curing Equipment
  • CAD/ CAm Systems
  • Furnaces
  • Mixing Devices
  • Dental 3D Printers
  •  Diagnostic Equipment
  • Intraoral Scanners
  • dental Xrays
  • Others (CBCT)

By Type of Cavity

  • Cavity I
  • Cavity II
  • Cavity III
  • Cavity IV
  • Cavity V
  • Cavity VI

By end user

  • Dentals Hospitals and clinics
  • Dental Laboratories
  • Others

By Region

  • North America
    • US
    • Canada
  • Europe
    • Germany
    • UK
    • France
    • Italy
    • Spain
    • RoEU
  • Asia Pacific
    • Japan
    • China
    • India
    • Australia
    • South Korea
    • RoAPAC
  • Latin America
    • Brazil
    • Mexico
    • Rest of Latin America
  • Middle East and Africa

Recent Developments of Restorative Dentistry Industry

  • In September 2023, J Morita launched its new Vera view X800 3D CBCT imaging system. This system is designed to provide dentists with high-quality 3D images of patients' teeth and jaws.
  • In May 2022, Dentsply Sirona introduced the initial version of a new line of Dentsply Sirona devices that will revolutionize digital dentistry, as well as Prime print Solution for dental offices and labs. This innovative 3D printing method makes it simple to build patient-specific and biocompatible appliances through an automated and simplified manufacturing procedure.
  • In March 2022, Envisat Holdings Corporation announced Envisat’s KaVo imagining business to be re-branded as DEXIS. The DEXIS brand represents a portfolio of award-winning imaging and digital solutions, including cone-beam computed tomography (CBCT), intraoral scanners, handheld X-rays, and sensors.

Frequently Asked Questions (FAQ):

To speak to our analyst for a discussion on the above findings, click Speak to Analyst

TABLE OF CONTENTS
 
1 INTRODUCTION (Page No. - 42)
    1.1 STUDY OBJECTIVES 
    1.2 MARKET DEFINITION 
           1.2.1 INCLUSIONS AND EXCLUSIONS
    1.3 STUDY SCOPE 
           1.3.1 MARKETS COVERED
           1.3.2 REGIONS COVERED
           1.3.3 YEARS CONSIDERED
           1.3.4 CURRENCY CONSIDERED
                    TABLE 1 STANDARD CURRENCY CONVERSION RATES
    1.4 STAKEHOLDERS 
    1.5 SUMMARY OF CHANGES 
    1.6 RECESSION IMPACT 
 
2 RESEARCH METHODOLOGY (Page No. - 47)
    2.1 RESEARCH DATA 
          FIGURE 1 RESEARCH DESIGN
           2.1.1 SECONDARY DATA
                    2.1.1.1 Key data from secondary sources
           2.1.2 PRIMARY DATA
                    FIGURE 2 PRIMARY SOURCES
                    2.1.2.1 Key data from primary sources
                    2.1.2.2 Key industry insights
                                FIGURE 3 BREAKDOWN OF PRIMARY INTERVIEWS: SUPPLY-SIDE AND DEMAND-SIDE PARTICIPANTS
                                FIGURE 4 BREAKDOWN OF PRIMARY INTERVIEWS (SUPPLY SIDE): BY COMPANY TYPE, DESIGNATION, AND REGION
                                FIGURE 5 BREAKDOWN OF PRIMARY INTERVIEWS (DEMAND SIDE): BY END USER, DESIGNATION, AND REGION
    2.2 MARKET SIZE ESTIMATION 
          FIGURE 6 SUPPLY-SIDE MARKET SIZE ESTIMATION: REVENUE SHARE ANALYSIS
          FIGURE 7 REVENUE SHARE ANALYSIS ILLUSTRATION: 3M
          FIGURE 8 SUPPLY-SIDE MARKET SIZE ESTIMATION: RESTORATIVE DENTISTRY MATERIALS MARKET (2022)
          FIGURE 9 DEMAND-SIDE ANALYSIS
          FIGURE 10 TOP-DOWN APPROACH
          FIGURE 11 CAGR PROJECTIONS FROM DRIVERS, RESTRAINTS, OPPORTUNITIES, AND CHALLENGES (2023–2028)
          FIGURE 12 CAGR PROJECTIONS: SUPPLY SIDE ANALYSIS
    2.3 MARKET BREAKDOWN AND DATA TRIANGULATION 
          FIGURE 13 DATA TRIANGULATION METHODOLOGY
    2.4 MARKET SHARE ESTIMATION 
    2.5 ASSUMPTIONS 
    2.6 LIMITATIONS 
           2.6.1 METHODOLOGY-RELATED LIMITATIONS
           2.6.2 SCOPE-RELATED LIMITATIONS
    2.7 RISK ASSESSMENT 
          TABLE 2 RISK ASSESSMENT: RESTORATIVE DENTISTRY MARKET
    2.8 RECESSION IMPACT ANALYSIS 
 
3 EXECUTIVE SUMMARY (Page No. - 61)
    FIGURE 14 RESTORATIVE DENTISTRY MARKET, BY PRODUCT, 2023 VS. 2028 (USD MILLION)
    FIGURE 15 RESTORATIVE DENTISTRY MARKET, BY TYPE OF CAVITY, 2023 VS. 2028 (USD MILLION)
    FIGURE 16 RESTORATIVE DENTISTRY MARKET, BY END USER, 2023 VS. 2028 (USD MILLION)
    FIGURE 17 GEOGRAPHIC SNAPSHOT: RESTORATIVE DENTISTRY MARKET
 
4 PREMIUM INSIGHTS (Page No. - 64)
    4.1 RESTORATIVE DENTISTRY MARKET OVERVIEW 
          FIGURE 18 RISING PREVALENCE OF DENTAL CARIES TO DRIVE MARKET GROWTH
    4.2 NORTH AMERICA: RESTORATIVE DENTISTRY MARKET, BY END USER AND COUNTRY (2022) 
          FIGURE 19 DENTAL HOSPITALS & CLINICS TO HOLD LARGEST SHARE OF MARKET IN NORTH AMERICA
    4.3 RESTORATIVE DENTISTRY MARKET: GEOGRAPHIC GROWTH OPPORTUNITIES 
          FIGURE 20 CHINA TO REGISTER HIGHEST GROWTH RATE
    4.4 RESTORATIVE DENTISTRY MARKET, REGIONAL MIX, 2023−2028 
          FIGURE 21 EUROPE TO DOMINATE RESTORATIVE DENTISTRY MARKET
    4.5 RESTORATIVE DENTISTRY MARKET: DEVELOPED MARKETS VS. EMERGING ECONOMIES 
          FIGURE 22 EMERGING ECONOMIES TO REGISTER HIGHER GROWTH RATES
 
5 MARKET OVERVIEW (Page No. - 68)
    5.1 INTRODUCTION 
    5.2 MARKET DYNAMICS 
          FIGURE 23 RESTORATIVE DENTISTRY MARKET: DRIVERS, RESTRAINTS, OPPORTUNITIES, AND CHALLENGES
           5.2.1 DRIVERS
                    5.2.1.1 Rising cases of dental caries and subsequent increase in tooth repair procedures
                    5.2.1.2 Rising demand for cosmetic dentistry
                    5.2.1.3 Growing market for dental tourism in emerging countries
                    5.2.1.4 Development of technologically advanced solutions
                                TABLE 3 KEY TECHNOLOGICAL ADVANCEMENTS USED IN DENTISTRY:
           5.2.2 RESTRAINTS
                    5.2.2.1 Complexities associated with using traditional dental composites
                                TABLE 4 AVERAGE COST OF BULK-FILLING COMPOSITES AND CONVENTIONAL COMPOSITES
           5.2.3 OPPORTUNITIES
                    5.2.3.1 High growth potential of emerging economies
                                TABLE 5 PER CAPITA NATIONAL INCOME (USD)
                    5.2.3.2 Impact of DSOs on dental practices
                                TABLE 6 LIST OF RECENT DEVELOPMENTS FINANCED BY PRIVATE EQUITIES IN US (2020–2023)
                    5.2.3.3 Increasing investments in CAD/CAM technologies
           5.2.4 CHALLENGES
                    5.2.4.1 Microleakage in composite restorations
                    5.2.4.2 Shortage of skilled dental practitioners
    5.3 INDUSTRY TRENDS 
           5.3.1 RISING NUMBER OF PRODUCT LAUNCHES
                    TABLE 7 NUMBER OF PRODUCT LAUNCHES BY KEY PLAYERS (2020–2023)
           5.3.2 AUTOMATED PATIENT TRACKING AND MANAGEMENT SOFTWARE
           5.3.3 DENTRONICS
    5.4 PORTER’S FIVE FORCES ANALYSIS 
          TABLE 8 RESTORATIVE DENTISTRY MARKET: PORTER’S FIVE FORCES ANALYSIS
           5.4.1 THREAT OF NEW ENTRANTS
           5.4.2 THREAT OF SUBSTITUTES
           5.4.3 BARGAINING POWER OF SUPPLIERS
           5.4.4 BARGAINING POWER OF BUYERS
           5.4.5 INTENSITY OF COMPETITIVE RIVALRY
    5.5 ECOSYSTEM MARKET/MAP 
          FIGURE 24 RESTORATIVE DENTISTRY MARKET: ECOSYSTEM MAP
    5.6 SUPPLY CHAIN ANALYSIS 
          FIGURE 25 RESTORATIVE DENTISTRY MARKET: SUPPLY CHAIN ANALYSIS
    5.7 VALUE CHAIN ANALYSIS 
          FIGURE 26 RESTORATIVE DENTISTRY MARKET: VALUE CHAIN ANALYSIS
    5.8 TARIFF AND REGULATORY LANDSCAPE 
           5.8.1 REGULATORY ANALYSIS
           5.8.2 US
           5.8.3 EUROPEAN UNION
           5.8.4 CHINA
           5.8.5 REGULATORY BODIES, GOVERNMENT AGENCIES, AND OTHER ORGANIZATIONS
                    TABLE 9 NORTH AMERICA: LIST OF REGULATORY BODIES, GOVERNMENT AGENCIES, AND OTHER ORGANIZATIONS
                    TABLE 10 EUROPE: LIST OF REGULATORY BODIES, GOVERNMENT AGENCIES, AND OTHER ORGANIZATIONS
                    TABLE 11 ASIA PACIFIC: LIST OF REGULATORY BODIES, GOVERNMENT AGENCIES, AND OTHER ORGANIZATIONS
    5.9 AVERAGE SELLING PRICE TREND 
           5.9.1 AVERAGE SELLING PRICE OF KEY PLAYERS, BY PRODUCT
                    TABLE 12 RESTORATIVE MATERIALS: AVERAGE SELLING PRICE (USD)
                    TABLE 13 ROTARY INSTRUMENTS: AVERAGE SELLING PRICE (USD)
           5.9.2 AVERAGE SELLING PRICE OF RESTORATIVE MATERIALS
                    FIGURE 27 AVERAGE SELLING PRICE OF RESTORATIVE MATERIALS, BY PRODUCT TYPE
                    TABLE 14 RESTORATIVE EQUIPMENT: AVERAGE SELLING PRICE (USD)
           5.9.3 AVERAGE SELLING PRICE OF RESTORATIVE DENTISTRY EQUIPMENT
                    FIGURE 28 AVERAGE SELLING PRICE OF RESTORATIVE DENTISTRY EQUIPMENT
           5.9.4 AVERAGE SELLING PRICE TRENDS
    5.10 TECHNOLOGY ANALYSIS 
    5.11 TRADE ANALYSIS 
           TABLE 15 US RESTORATIVE DENTISTRY AND SUPPLIES, EXPORTS 2015−2022 (IN THOUSAND)
    5.12 PATENT ANALYSIS 
           5.12.1 PATENT PUBLICATION TRENDS FOR RESTORATIVE DENTISTRY
                     FIGURE 29 PATENT PUBLICATION TRENDS IN RESTORATIVE DENTISTRY MARKET (2013–2023)
           5.12.2 INSIGHTS ON JURISDICTION AND TOP APPLICANT ANALYSIS
                     FIGURE 30 TOP APPLICANTS & OWNERS (COMPANIES/INSTITUTIONS) FOR RESTORATIVE DENTISTRY PATENTS (JANUARY 2013–SEPTEMBER 2023)
                     FIGURE 31 TOP 10 APPLICANT COUNTRIES/REGIONS FOR RESTORATIVE DENTISTRY PATENTS, 2013–2023
                     TABLE 16 RESTORATIVE DENTISTRY MARKET: LIST OF MAJOR PATENTS
    5.13 CASE STUDY ANALYSIS 
           TABLE 17 INNOVATION TRACKING, TECHNOLOGY ASSESSMENT, AND PRODUCT LAUNCHES
           TABLE 18 RESTORATIVE DENTISTRY MARKET IN MIDDLE EAST & AFRICA
    5.14 KEY CONFERENCES & EVENTS IN 2023−2024 
           TABLE 19 RESTORATIVE DENTISTRY MARKET: DETAILED LIST OF CONFERENCES & EVENTS (2023−2024)
    5.15 TRENDS/DISRUPTIONS IMPACTING CUSTOMER BUSINESSES 
    5.16 KEY STAKEHOLDERS & BUYING CRITERIA 
           5.16.1 KEY STAKEHOLDERS IN BUYING PROCESS
                     FIGURE 32 INFLUENCE OF STAKEHOLDERS ON BUYING PROCESS FOR RESTORATIVE DENTISTRY PRODUCTS
                     TABLE 20 INFLUENCE OF STAKEHOLDERS ON BUYING PROCESS FOR RESTORATIVE DENTISTRY PRODUCTS (%)
           5.16.2 BUYING CRITERIA
                     FIGURE 33 KEY BUYING CRITERIA FOR RESTORATIVE DENTISTRY PRODUCTS
                     TABLE 21 KEY BUYING CRITERIA FOR RESTORATIVE DENTISTRY PRODUCTS, BY RANKING
    5.17 ADJACENT MARKETS 
    5.18 AI IN RESTORATIVE DENTISTRY 
    5.19 UNMET NEEDS/END-USER EXPECTATIONS IN RESTORATIVE DENTISTRY 
 
6 RESTORATIVE DENTISTRY MARKET, BY TYPE OF CAVITY (Page No. - 102)
    6.1 INTRODUCTION 
          TABLE 22 RESTORATIVE DENTISTRY MARKET, BY TYPE OF CAVITY, 2021–2028 (USD MILLION)
    6.2 CLASS I 
           6.2.1 RISING NUMBER OF DENTAL HOSPITALS AND CLINICS IN EMERGING COUNTRIES TO DRIVE MARKET
                    TABLE 23 RESTORATIVE DENTISTRY MARKET FOR CLASS I CAVITIES, BY COUNTRY, 2021–2028 (USD MILLION)
    6.3 CLASS II 
           6.3.1 RISING PREVALENCE OF CARIES TO PROPEL MARKET GROWTH
                    TABLE 24 RESTORATIVE DENTISTRY MARKET FOR CLASS II CAVITIES, BY COUNTRY, 2021–2028 (USD MILLION)
    6.4 CLASS III 
           6.4.1 LIFESTYLE CHANGES TO DRIVE INCIDENCE OF CAVITIES
                    TABLE 25 RESTORATIVE DENTISTRY MARKET FOR CLASS III CAVITIES, BY COUNTRY, 2021–2028 (USD MILLION)
    6.5 CLASS IV 
           6.5.1 US TO HOLD LARGEST MARKET SHARE
                    TABLE 26 RESTORATIVE DENTISTRY MARKET FOR CLASS IV CAVITIES, BY COUNTRY, 2021–2028 (USD MILLION)
    6.6 CLASS V 
           6.6.1 PLAQUE AND BACTERIAL BUILDUP TO DRIVE PREVALENCE OF CLASS V CAVITIES
                    TABLE 27 RESTORATIVE DENTISTRY MARKET FOR CLASS V CAVITIES, BY COUNTRY, 2021–2028 (USD MILLION)
    6.7 CLASS VI 
           6.7.1 ACID EROSION AND AGE-CAUSED TOOTH DAMAGE TO AFFECT INCIDENCE
                    TABLE 28 RESTORATIVE DENTISTRY MARKET FOR CLASS V CAVITIES, BY COUNTRY, 2021–2028 (USD MILLION)
 
7 RESTORATIVE DENTISTRY MARKET, BY PRODUCT (Page No. - 110)
    7.1 INTRODUCTION 
          TABLE 29 RESTORATIVE DENTISTRY MARKET, BY PRODUCT, 2021–2028 (USD MILLION)
    7.2 MATERIALS 
          TABLE 30 RESTORATIVE DENTISTRY MATERIALS MARKET, BY TYPE, 2021–2028 (USD MILLION)
          TABLE 31 RESTORATIVE DENTISTRY MATERIALS MARKET, BY COUNTRY, 2021–2028 (USD MILLION)
           7.2.1 DIRECT RESTORATIVE MATERIALS
                    TABLE 32 DIRECT RESTORATIVE MATERIALS MARKET, BY TYPE, 2021–2028 (USD MILLION)
                    TABLE 33 DIRECT RESTORATIVE MATERIALS MARKET, BY COUNTRY, 2021–2028 (USD MILLION)
                    7.2.1.1 Amalgams
                               7.2.1.1.1 Decreasing adoption of dental amalgams to drive market
                                              TABLE 34 AMALGAMS OFFERED BY KEY MARKET PLAYERS
                                              TABLE 35 AMALGAMS MARKET, BY COUNTRY, 2021–2028 (USD MILLION)
                    7.2.1.2 Composites
                               7.2.1.2.1 Need for minimal tooth preparation and accurate color matching with natural teeth to propel market growth
                                              TABLE 36 COMPOSITES OFFERED BY KEY MARKET PLAYERS
                                              TABLE 37 COMPOSITES MARKET, BY COUNTRY, 2021–2028 (USD MILLION)
                    7.2.1.3 Glass ionomer cements
                               7.2.1.3.1 Low load-bearing strength to restrain adoption
                                              TABLE 38 GLASS IONOMER CEMENTS OFFERED BY KEY MARKET PLAYERS
                                              TABLE 39 GLASS IONOMER CEMENTS MARKET, BY COUNTRY, 2021–2028 (USD MILLION)
                    7.2.1.4 Other direct restorative materials
                                TABLE 40 APPLICATIONS OF DENTAL CEMENT AND OTHER MATERIALS
                                TABLE 41 OTHER DIRECT RESTORATIVE MATERIALS MARKET, BY COUNTRY, 2021–2028 (USD MILLION)
           7.2.2 INDIRECT RESTORATIVE MATERIALS
                    TABLE 42 INDIRECT RESTORATIVE MATERIALS MARKET, BY TYPE, 2021–2028 (USD MILLION)
                    TABLE 43 INDIRECT RESTORATIVE MATERIALS MARKET, BY COUNTRY, 2021–2028 (USD MILLION)
                    7.2.2.1 Metals
                               7.2.2.1.1 High biocompatibility and corrosion resistance to drive demand
                                              TABLE 44 METAL RESTORATIVE MATERIALS OFFERED BY KEY MARKET PLAYERS
                                              TABLE 45 METALS MARKET, BY COUNTRY, 2021–2028 (USD MILLION)
                    7.2.2.2 Ceramics
                               7.2.2.2.1 Aesthetics and translucency to support adoption
                                              TABLE 46 CERAMIC RESTORATIVE MATERIALS OFFERED BY KEY MARKET PLAYERS
                                              TABLE 47 CERAMICS MARKET, BY COUNTRY, 2021–2028 (USD MILLION)
    7.3 INSTRUMENTS 
          TABLE 48 RESTORATIVE DENTISTRY INSTRUMENTS MARKET, BY TYPE, 2021–2028 (USD MILLION)
          TABLE 49 RESTORATIVE DENTISTRY INSTRUMENTS MARKET, BY COUNTRY, 2021–2028 (USD MILLION)
           7.3.1 ROTARY INSTRUMENTS
                    7.3.1.1 Rising demand for cosmetic dentistry to boost uptake of rotary instruments
                                TABLE 50 ROTARY INSTRUMENTS MARKET, BY COUNTRY, 2021–2028 (USD MILLION)
           7.3.2 HAND INSTRUMENTS
                    7.3.2.1 Introduction of advanced technologies to fuel adoption
                                TABLE 51 HAND INSTRUMENTS MARKET, BY COUNTRY, 2021–2028 (USD MILLION)
    7.4 EQUIPMENT 
          TABLE 52 RESTORATIVE DENTISTRY EQUIPMENT MARKET, BY TYPE, 2021–2028 (USD MILLION)
          TABLE 53 RESTORATIVE DENTISTRY EQUIPMENT MARKET, BY COUNTRY, 2021–2028 (USD MILLION)
           7.4.1 DIAGNOSTIC EQUIPMENT
                    7.4.1.1 Dental X-rays
                               7.4.1.1.1 High image quality and data generation to boost adoption
                                              TABLE 54 DENTAL X-RAYS MARKET, BY COUNTRY, 2021–2028 (USD MILLION)
                    7.4.1.2 Intraoral scanners
                               7.4.1.2.1 Convenience and ease of use to drive demand
                                              TABLE 55 INTRAORAL SCANNERS OFFERED BY KEY PLAYERS
                                              TABLE 56 INTRAORAL SCANNERS MARKET, BY COUNTRY, 2021–2028 (USD MILLION)
                    7.4.1.3 Other diagnostic equipment
                                TABLE 57 OTHER DIAGNOSTIC EQUIPMENT MARKET, BY COUNTRY, 2021–2028 (USD MILLION)
           7.4.2 FABRICATION EQUIPMENT
                    7.4.2.1 Light-curing equipment
                               7.4.2.1.1 High efficiency and power to drive adoption
                                              TABLE 58 LIGHT-CURING EQUIPMENT OFFERED BY KEY MARKET PLAYERS
                                              TABLE 59 LIGHT-CURING EQUIPMENT MARKET, BY COUNTRY, 2021–2028 (USD MILLION)
                    7.4.2.2 Mixing devices
                               7.4.2.2.1 Mixing precision to support end-user demand
                                              TABLE 60 MIXING DEVICES OFFERED BY KEY MARKET PLAYERS
                                              TABLE 61 MIXING DEVICES MARKET, BY COUNTRY, 2021–2028 (USD MILLION)
                    7.4.2.3 CAD/CAM systems
                               7.4.2.3.1 Limited applications in indirect restorations to limit usage
                                              TABLE 62 CAD/CAM SYSTEMS OFFERED BY KEY MARKET PLAYERS
                                              TABLE 63 CAD/CAM SYSTEMS MARKET, BY COUNTRY, 2021–2028 (USD MILLION)
                    7.4.2.4 Furnaces
                               7.4.2.4.1 Rising use of customized dental materials to drive market
                                              TABLE 64 FURNACES OFFERED BY KEY MARKET PLAYERS
                                              TABLE 65 FURNACES MARKET, BY COUNTRY, 2021–2028 (USD MILLION)
                    7.4.2.5 Dental 3D printer
                               7.4.2.5.1 Workflow enhancements and benefits of digitization to boost adoption
                                              TABLE 66 DENTAL 3D PRINTERS MARKET, BY COUNTRY, 2021–2028 (USD MILLION)
 
8 RESTORATIVE DENTISTRY MARKET, BY END USER (Page No. - 143)
    8.1 INTRODUCTION 
          TABLE 67 RESTORATIVE DENTISTRY MARKET, BY END USER, 2021–2028 (USD MILLION)
    8.2 DENTAL HOSPITALS & CLINICS 
           8.2.1 RAPID ADOPTION OF ADVANCED TECHNOLOGY TO DRIVE MARKET
                    TABLE 68 NUMBER OF DENTAL CLINICS IN 2020 VS. 2022, BY COUNTRY
                    TABLE 69 RESTORATIVE DENTISTRY MARKET FOR DENTAL HOSPITALS & CLINICS, BY COUNTRY, 2021–2028 (USD MILLION)
    8.3 DENTAL LABORATORIES 
           8.3.1 HIGHER ACCURACY OF 3D PRINTED AND CAD/CAM MILLED INDIRECT RESTORATIONS TO PROPEL SEGMENT GROWTH
                    TABLE 70 RESTORATIVE DENTISTRY MARKET FOR DENTAL LABORATORIES, BY COUNTRY, 2021–2028 (USD MILLION)
    8.4 OTHER END USERS 
          TABLE 71 TOP 10 NIDCR GRANTS TO US DENTAL INSTITUTIONS (USD MILLION)
          TABLE 72 RESTORATIVE DENTISTRY MARKET FOR OTHER END USERS, BY COUNTRY, 2021–2028 (USD MILLION)
 
9 RESTORATIVE DENTISTRY MARKET, BY REGION (Page No. - 150)
    9.1 INTRODUCTION 
          FIGURE 34 RESTORATIVE DENTISTRY MARKET: GEOGRAPHIC SNAPSHOT
          TABLE 73 RESTORATIVE DENTISTRY MARKET, BY REGION, 2021–2028 (USD MILLION)
    9.2 EUROPE 
           9.2.1 EUROPE: RECESSION IMPACT
                    FIGURE 35 EUROPE: RESTORATIVE DENTISTRY MARKET SNAPSHOT
                    TABLE 74 EUROPE: RESTORATIVE DENTISTRY MARKET, BY COUNTRY, 2021–2028 (USD MILLION)
                    TABLE 75 EUROPE: RESTORATIVE DENTISTRY MARKET, BY PRODUCT, 2021–2028 (USD MILLION)
                    TABLE 76 EUROPE: RESTORATIVE DENTISTRY MATERIALS MARKET, BY TYPE, 2021–2028 (USD MILLION)
                    TABLE 77 EUROPE: DIRECT RESTORATIVE MATERIALS MARKET, BY TYPE, 2021–2028 (USD MILLION)
                    TABLE 78 EUROPE: INDIRECT RESTORATIVE MATERIALS MARKET, BY TYPE, 2021–2028 (USD MILLION)
                    TABLE 79 EUROPE: RESTORATIVE DENTISTRY INSTRUMENTS MARKET, BY TYPE, 2021–2028 (USD MILLION)
                    TABLE 80 EUROPE: RESTORATIVE DENTISTRY EQUIPMENT MARKET, BY TYPE, 2021–2028 (USD MILLION)
                    TABLE 81 EUROPE: DIAGNOSTIC EQUIPMENT MARKET, BY TYPE, 2021–2028 (USD MILLION)
                    TABLE 82 EUROPE: FABRICATION EQUIPMENT MARKET, BY TYPE, 2021–2028 (USD MILLION)
                    TABLE 83 EUROPE: RESTORATIVE DENTISTRY MARKET, BY TYPE OF CAVITY, 2021–2028 (USD MILLION)
                    TABLE 84 EUROPE: RESTORATIVE DENTISTRY MARKET, BY END USER, 2021–2028 (USD MILLION)
           9.2.2 GERMANY
                    9.2.2.1 Favorable government policies for reimbursements to drive demand for restorative dentistry
                                TABLE 85 GERMANY: MACROECONOMIC INDICATORS
                                TABLE 86 GERMANY: RESTORATIVE DENTISTRY MARKET, BY PRODUCT, 2021–2028 (USD MILLION)
                                TABLE 87 GERMANY: RESTORATIVE DENTISTRY MATERIALS MARKET, BY TYPE, 2021–2028 (USD MILLION)
                                TABLE 88 GERMANY: DIRECT RESTORATIVE MATERIALS MARKET, BY TYPE, 2021–2028 (USD MILLION)
                                TABLE 89 GERMANY: INDIRECT RESTORATIVE MATERIALS MARKET, BY TYPE, 2021–2028 (USD MILLION)
                                TABLE 90 GERMANY: RESTORATIVE DENTISTRY INSTRUMENTS MARKET, BY TYPE, 2021–2028 (USD MILLION)
                                TABLE 91 GERMANY: RESTORATIVE DENTISTRY EQUIPMENT MARKET, BY TYPE, 2021–2028 (USD MILLION)
                                TABLE 92 GERMANY: DIAGNOSTIC EQUIPMENT MARKET, BY TYPE, 2021–2028 (USD MILLION)
                                TABLE 93 GERMANY: FABRICATION EQUIPMENT MARKET, BY TYPE, 2021–2028 (USD MILLION)
                                TABLE 94 GERMANY: RESTORATIVE DENTISTRY MARKET, BY TYPE OF CAVITY, 2021–2028 (USD MILLION)
                                TABLE 95 GERMANY: RESTORATIVE DENTISTRY MARKET, BY END USER, 2021–2028 (USD MILLION)
           9.2.3 UK
                    9.2.3.1 Increasing incidence of dental disorders to drive market
                                TABLE 96 UK: MACROECONOMIC INDICATORS
                                TABLE 97 UK: RESTORATIVE DENTISTRY MARKET, BY PRODUCT, 2021–2028 (USD MILLION)
                                TABLE 98 UK: RESTORATIVE DENTISTRY MATERIALS MARKET, BY TYPE, 2021–2028 (USD MILLION)
                                TABLE 99 UK: DIRECT RESTORATIVE MATERIALS MARKET, BY TYPE, 2021–2028 (USD MILLION)
                                TABLE 100 UK: INDIRECT RESTORATIVE MATERIALS MARKET, BY TYPE, 2021–2028 (USD MILLION)
                                TABLE 101 UK: RESTORATIVE DENTISTRY INSTRUMENTS MARKET, BY TYPE, 2021–2028 (USD MILLION)
                                TABLE 102 UK: RESTORATIVE DENTISTRY EQUIPMENT MARKET, BY TYPE, 2021–2028 (USD MILLION)
                                TABLE 103 UK: DIAGNOSTIC EQUIPMENT MARKET, BY TYPE, 2021–2028 (USD MILLION)
                                TABLE 104 UK: FABRICATION EQUIPMENT MARKET, BY TYPE, 2021–2028 (USD MILLION)
                                TABLE 105 UK: RESTORATIVE DENTISTRY MARKET, BY TYPE OF CAVITY, 2021–2028 (USD MILLION)
                                TABLE 106 UK: RESTORATIVE DENTISTRY MARKET, BY END USER, 2021–2028 (USD MILLION)
           9.2.4 FRANCE
                    9.2.4.1 Favorable government healthcare strategies to fuel market demand for restorative dentistry
                                TABLE 107 FRANCE: MACROECONOMIC INDICATORS
                                TABLE 108 FRANCE: RESTORATIVE DENTISTRY MARKET, BY PRODUCT, 2021–2028 (USD MILLION)
                                TABLE 109 FRANCE: RESTORATIVE DENTISTRY MATERIALS MARKET, BY TYPE, 2021–2028 (USD MILLION)
                                TABLE 110 FRANCE: DIRECT RESTORATIVE MATERIALS MARKET, BY TYPE, 2021–2028 (USD MILLION)
                                TABLE 111 FRANCE: INDIRECT RESTORATIVE MATERIALS MARKET, BY TYPE, 2021–2028 (USD MILLION)
                                TABLE 112 FRANCE: RESTORATIVE DENTISTRY INSTRUMENTS MARKET, BY TYPE, 2021–2028 (USD MILLION)
                                TABLE 113 FRANCE: RESTORATIVE DENTISTRY EQUIPMENT MARKET, BY TYPE, 2021–2028 (USD MILLION)
                                TABLE 114 FRANCE: DIAGNOSTIC EQUIPMENT MARKET, BY TYPE, 2021–2028 (USD MILLION)
                                TABLE 115 FRANCE: FABRICATION EQUIPMENT MARKET, BY TYPE, 2021–2028 (USD MILLION)
                                TABLE 116 FRANCE: RESTORATIVE DENTISTRY MARKET, BY TYPE OF CAVITY, 2021–2028 (USD MILLION)
                                TABLE 117 FRANCE: RESTORATIVE DENTISTRY MARKET, BY END USER, 2021–2028 (USD MILLION)
           9.2.5 ITALY
                    9.2.5.1 Low-cost treatments and growing penetration of dental products to drive market
                                TABLE 118 ITALY: MACROECONOMIC INDICATORS
                                TABLE 119 ITALY: RESTORATIVE DENTISTRY MARKET, BY PRODUCT, 2021–2028 (USD MILLION)
                                TABLE 120 ITALY: RESTORATIVE DENTISTRY MATERIALS MARKET, BY TYPE, 2021–2028 (USD MILLION)
                                TABLE 121 ITALY: DIRECT RESTORATIVE MATERIALS MARKET, BY TYPE, 2021–2028 (USD MILLION)
                                TABLE 122 ITALY: INDIRECT RESTORATIVE MATERIALS MARKET, BY TYPE, 2021–2028 (USD MILLION)
                                TABLE 123 ITALY: RESTORATIVE DENTISTRY INSTRUMENTS MARKET, BY TYPE, 2021–2028 (USD MILLION)
                                TABLE 124 ITALY: RESTORATIVE DENTISTRY EQUIPMENT MARKET, BY TYPE, 2021–2028 (USD MILLION)
                                TABLE 125 ITALY: DIAGNOSTIC EQUIPMENT MARKET, BY TYPE, 2021–2028 (USD MILLION)
                                TABLE 126 ITALY: FABRICATION EQUIPMENT MARKET, BY TYPE, 2021–2028 (USD MILLION)
                                TABLE 127 ITALY: RESTORATIVE DENTISTRY MARKET, BY TYPE OF CAVITY, 2021–2028 (USD MILLION)
                                TABLE 128 ITALY: RESTORATIVE DENTISTRY MARKET, BY END USER, 2021–2028 (USD MILLION)
           9.2.6 SPAIN
                    9.2.6.1 Increasing demand for cosmetic dentistry and growing medical tourism to support market growth
                                TABLE 129 SPAIN: MACROECONOMIC INDICATORS
                                TABLE 130 SPAIN: RESTORATIVE DENTISTRY MARKET, BY PRODUCT, 2021–2028 (USD MILLION)
                                TABLE 131 SPAIN: RESTORATIVE DENTISTRY MATERIALS MARKET, BY TYPE, 2021–2028 (USD MILLION)
                                TABLE 132 SPAIN: DIRECT RESTORATIVE MATERIALS MARKET, BY TYPE, 2021–2028 (USD MILLION)
                                TABLE 133 SPAIN: INDIRECT RESTORATIVE MATERIALS MARKET, BY TYPE, 2021–2028 (USD MILLION)
                                TABLE 134 SPAIN: RESTORATIVE DENTISTRY INSTRUMENTS MARKET, BY TYPE, 2021–2028 (USD MILLION)
                                TABLE 135 SPAIN: RESTORATIVE DENTISTRY EQUIPMENT MARKET, BY TYPE, 2021–2028 (USD MILLION)
                                TABLE 136 SPAIN: DIAGNOSTIC EQUIPMENT MARKET, BY TYPE, 2021–2028 (USD MILLION)
                                TABLE 137 SPAIN: FABRICATION EQUIPMENT MARKET, BY TYPE, 2021–2028 (USD MILLION)
                                TABLE 138 SPAIN: RESTORATIVE DENTISTRY MARKET, BY TYPE OF CAVITY, 2021–2028 (USD MILLION)
                                TABLE 139 SPAIN: RESTORATIVE DENTISTRY MARKET, BY END USER, 2021–2028 (USD MILLION)
           9.2.7 REST OF EUROPE
                    TABLE 140 REST OF EUROPE: RESTORATIVE DENTISTRY MARKET, BY PRODUCT, 2021–2028 (USD MILLION)
                    TABLE 141 REST OF EUROPE: RESTORATIVE DENTISTRY MATERIALS MARKET, BY TYPE, 2021–2028 (USD MILLION)
                    TABLE 142 REST OF EUROPE: DIRECT RESTORATIVE MATERIALS MARKET, BY TYPE, 2021–2028 (USD MILLION)
                    TABLE 143 REST OF EUROPE: INDIRECT RESTORATIVE MATERIALS MARKET, BY TYPE, 2021–2028 (USD MILLION)
                    TABLE 144 REST OF EUROPE: RESTORATIVE DENTISTRY INSTRUMENTS MARKET, BY TYPE, 2021–2028 (USD MILLION)
                    TABLE 145 REST OF EUROPE: RESTORATIVE DENTISTRY EQUIPMENT MARKET, BY TYPE, 2021–2028 (USD MILLION)
                    TABLE 146 REST OF EUROPE: DIAGNOSTIC EQUIPMENT MARKET, BY TYPE, 2021–2028 (USD MILLION)
                    TABLE 147 REST OF EUROPE: FABRICATION EQUIPMENT MARKET, BY TYPE, 2021–2028 (USD MILLION)
                    TABLE 148 REST OF EUROPE: RESTORATIVE DENTISTRY MARKET, BY TYPE OF CAVITY, 2021–2028 (USD MILLION)
                    TABLE 149 REST OF EUROPE: RESTORATIVE DENTISTRY MARKET, BY END USER, 2021–2028 (USD MILLION)
    9.3 NORTH AMERICA 
           9.3.1 NORTH AMERICA: RECESSION IMPACT
                    TABLE 150 NORTH AMERICA: RESTORATIVE DENTISTRY MARKET, BY COUNTRY, 2021–2028 (USD MILLION)
                    TABLE 151 NORTH AMERICA: RESTORATIVE DENTISTRY MARKET, BY PRODUCT, 2021–2028 (USD MILLION)
                    TABLE 152 NORTH AMERICA: RESTORATIVE DENTISTRY MATERIALS MARKET, BY TYPE, 2021–2028 (USD MILLION)
                    TABLE 153 NORTH AMERICA: DIRECT RESTORATIVE MATERIALS MARKET, BY TYPE, 2021–2028 (USD MILLION)
                    TABLE 154 NORTH AMERICA: INDIRECT RESTORATIVE MATERIALS MARKET, BY TYPE, 2021–2028 (USD MILLION)
                    TABLE 155 NORTH AMERICA: RESTORATIVE DENTISTRY INSTRUMENTS MARKET, BY TYPE, 2021–2028 (USD MILLION)
                    TABLE 156 NORTH AMERICA: RESTORATIVE DENTISTRY EQUIPMENT MARKET, BY TYPE, 2021–2028 (USD MILLION)
                    TABLE 157 NORTH AMERICA: DIAGNOSTIC EQUIPMENT MARKET, BY TYPE, 2021–2028 (USD MILLION)
                    TABLE 158 NORTH AMERICA: FABRICATION EQUIPMENT MARKET, BY TYPE, 2021–2028 (USD MILLION)
                    TABLE 159 NORTH AMERICA: RESTORATIVE DENTISTRY MARKET, BY TYPE OF CAVITY, 2021–2028 (USD MILLION)
                    TABLE 160 NORTH AMERICA: RESTORATIVE DENTISTRY MARKET, BY END USER, 2021–2028 (USD MILLION)
           9.3.2 US
                    9.3.2.1 US to dominate restorative dentistry market in North America during forecast period
                                FIGURE 36 US: RISE IN DENTAL EXPENDITURE, 2010–2022
                                TABLE 161 US: MACROECONOMIC INDICATORS
                                TABLE 162 US: RESTORATIVE DENTISTRY MARKET, BY PRODUCT, 2021–2028 (USD MILLION)
                                TABLE 163 US: RESTORATIVE DENTISTRY MATERIALS MARKET, BY TYPE, 2021–2028 (USD MILLION)
                                TABLE 164 US: DIRECT RESTORATIVE MATERIALS MARKET, BY TYPE, 2021–2028 (USD MILLION)
                                TABLE 165 US: INDIRECT RESTORATIVE MATERIALS MARKET, BY TYPE, 2021–2028 (USD MILLION)
                                TABLE 166 US: RESTORATIVE DENTISTRY INSTRUMENTS MARKET, BY TYPE, 2021–2028 (USD MILLION)
                                TABLE 167 US: RESTORATIVE DENTISTRY EQUIPMENT MARKET, BY TYPE, 2021–2028 (USD MILLION)
                                TABLE 168 US: DIAGNOSTIC EQUIPMENT MARKET, BY TYPE, 2021–2028 (USD MILLION)
                                TABLE 169 US: FABRICATION EQUIPMENT MARKET, BY TYPE, 2021–2028 (USD MILLION)
                                TABLE 170 US: RESTORATIVE DENTISTRY MARKET, BY TYPE OF CAVITY, 2021–2028 (USD MILLION)
                                TABLE 171 US: RESTORATIVE DENTISTRY MARKET, BY END USER, 2021–2028 (USD MILLION)
           9.3.3 CANADA
                    9.3.3.1 Rising incidence of dental caries to drive demand for restorative dentistry in Canada
                                TABLE 172 CANADA: MACROECONOMIC INDICATORS
                                TABLE 173 CANADA: RESTORATIVE DENTISTRY MARKET, BY PRODUCT, 2021–2028 (USD MILLION)
                                TABLE 174 CANADA: RESTORATIVE DENTISTRY MATERIALS MARKET, BY TYPE, 2021–2028 (USD MILLION)
                                TABLE 175 CANADA: DIRECT RESTORATIVE MATERIALS MARKET, BY TYPE, 2021–2028 (USD MILLION)
                                TABLE 176 CANADA: INDIRECT RESTORATIVE MATERIALS MARKET, BY TYPE, 2021–2028 (USD MILLION)
                                TABLE 177 CANADA: RESTORATIVE DENTISTRY INSTRUMENTS MARKET, BY TYPE, 2021–2028 (USD MILLION)
                                TABLE 178 CANADA: RESTORATIVE DENTISTRY EQUIPMENT MARKET, BY TYPE, 2021–2028 (USD MILLION)
                                TABLE 179 CANADA: DIAGNOSTIC EQUIPMENT MARKET, BY TYPE, 2021–2028 (USD MILLION)
                                TABLE 180 CANADA: FABRICATION EQUIPMENT MARKET, BY TYPE, 2021–2028 (USD MILLION)
                                TABLE 181 CANADA: RESTORATIVE DENTISTRY MARKET, BY TYPE OF CAVITY, 2021–2028 (USD MILLION)
                                TABLE 182 CANADA: RESTORATIVE DENTISTRY MARKET, BY END USER, 2021–2028 (USD MILLION)
    9.4 ASIA PACIFIC 
           9.4.1 ASIA PACIFIC: RECESSION IMPACT
                    FIGURE 37 ASIA PACIFIC: RESTORATIVE DENTISTRY MARKET SNAPSHOT
                    TABLE 183 ASIA PACIFIC: RESTORATIVE DENTISTRY MARKET, BY COUNTRY, 2021–2028 (USD MILLION)
                    TABLE 184 ASIA PACIFIC: RESTORATIVE DENTISTRY MARKET, BY PRODUCT, 2021–2028 (USD MILLION)
                    TABLE 185 ASIA PACIFIC: RESTORATIVE DENTISTRY MATERIALS MARKET, BY TYPE, 2021–2028 (USD MILLION)
                    TABLE 186 ASIA PACIFIC: DIRECT RESTORATIVE MATERIALS MARKET, BY TYPE, 2021–2028 (USD MILLION)
                    TABLE 187 ASIA PACIFIC: INDIRECT RESTORATIVE MATERIALS MARKET, BY TYPE, 2021–2028 (USD MILLION)
                    TABLE 188 ASIA PACIFIC: RESTORATIVE DENTISTRY INSTRUMENTS MARKET, BY TYPE, 2021–2028 (USD MILLION)
                    TABLE 189 ASIA PACIFIC: RESTORATIVE DENTISTRY EQUIPMENT MARKET, BY TYPE, 2021–2028 (USD MILLION)
                    TABLE 190 ASIA PACIFIC: DIAGNOSTIC EQUIPMENT MARKET, BY TYPE, 2021–2028 (USD MILLION)
                    TABLE 191 ASIA PACIFIC: FABRICATION EQUIPMENT MARKET, BY TYPE, 2021–2028 (USD MILLION)
                    TABLE 192 ASIA PACIFIC: RESTORATIVE DENTISTRY MARKET, BY TYPE OF CAVITY, 2021–2028 (USD MILLION)
                    TABLE 193 ASIA PACIFIC: RESTORATIVE DENTISTRY MARKET, BY END USER, 2021–2028 (USD MILLION)
           9.4.2 JAPAN
                    9.4.2.1 Rising geriatric population and favorable reimbursement scenario to support market growth in Japan
                                TABLE 194 JAPAN: MACROECONOMIC INDICATORS
                                TABLE 195 JAPAN: RESTORATIVE DENTISTRY MARKET, BY PRODUCT, 2021–2028 (USD MILLION)
                                TABLE 196 JAPAN: RESTORATIVE DENTISTRY MATERIALS MARKET, BY TYPE, 2021–2028 (USD MILLION)
                                TABLE 197 JAPAN: DIRECT RESTORATIVE MATERIALS MARKET, BY TYPE, 2021–2028 (USD MILLION)
                                TABLE 198 JAPAN: INDIRECT RESTORATIVE MATERIALS MARKET, BY TYPE, 2021–2028 (USD MILLION)
                                TABLE 199 JAPAN: RESTORATIVE DENTISTRY INSTRUMENTS MARKET, BY TYPE, 2021–2028 (USD MILLION)
                                TABLE 200 JAPAN: RESTORATIVE DENTISTRY EQUIPMENT MARKET, BY TYPE, 2021–2028 (USD MILLION)
                                TABLE 201 JAPAN: DIAGNOSTIC EQUIPMENT MARKET, BY TYPE, 2021–2028 (USD MILLION)
                                TABLE 202 JAPAN: FABRICATION EQUIPMENT MARKET, BY TYPE, 2021–2028 (USD MILLION)
                                TABLE 203 JAPAN: RESTORATIVE DENTISTRY MARKET, BY TYPE OF CAVITY, 2021–2028 (USD MILLION)
                                TABLE 204 JAPAN: RESTORATIVE DENTISTRY MARKET, BY END USER, 2021–2028 (USD MILLION)
           9.4.3 CHINA
                    9.4.3.1 Growing prevalence of dental diseases to drive market growth in China
                                TABLE 205 CHINA: MACROECONOMIC INDICATORS
                                TABLE 206 CHINA: RESTORATIVE DENTISTRY MARKET, BY PRODUCT, 2021–2028 (USD MILLION)
                                TABLE 207 CHINA: RESTORATIVE DENTISTRY MATERIALS MARKET, BY TYPE, 2021–2028 (USD MILLION)
                                TABLE 208 CHINA: DIRECT RESTORATIVE MATERIALS MARKET, BY TYPE, 2021–2028 (USD MILLION)
                                TABLE 209 CHINA: INDIRECT RESTORATIVE MATERIALS MARKET, BY TYPE, 2021–2028 (USD MILLION)
                                TABLE 210 CHINA: RESTORATIVE DENTISTRY INSTRUMENTS MARKET, BY TYPE, 2021–2028 (USD MILLION)
                                TABLE 211 CHINA: RESTORATIVE DENTISTRY EQUIPMENT MARKET, BY TYPE, 2021–2028 (USD MILLION)
                                TABLE 212 CHINA: DIAGNOSTIC EQUIPMENT MARKET, BY TYPE, 2021–2028 (USD MILLION)
                                TABLE 213 CHINA: FABRICATION EQUIPMENT MARKET, BY TYPE, 2021–2028 (USD MILLION)
                                TABLE 214 CHINA: RESTORATIVE DENTISTRY MARKET, BY TYPE OF CAVITY, 2021–2028 (USD MILLION)
                                TABLE 215 CHINA: RESTORATIVE DENTISTRY MARKET, BY END USER, 2021–2028 (USD MILLION)
           9.4.4 INDIA
                    9.4.4.1 Growing opportunities for dental tourism to drive market demand for restorative dentistry in India
                                TABLE 216 INDIA: MACROECONOMIC INDICATORS
                                TABLE 217 INDIA: RESTORATIVE DENTISTRY MARKET, BY PRODUCT, 2021–2028 (USD MILLION)
                                TABLE 218 INDIA: RESTORATIVE DENTISTRY MATERIALS MARKET, BY TYPE, 2021–2028 (USD MILLION)
                                TABLE 219 INDIA: DIRECT RESTORATIVE MATERIALS MARKET, BY TYPE, 2021–2028 (USD MILLION)
                                TABLE 220 INDIA: INDIRECT RESTORATIVE MATERIALS MARKET, BY TYPE, 2021–2028 (USD MILLION)
                                TABLE 221 INDIA: RESTORATIVE DENTISTRY INSTRUMENTS MARKET, BY TYPE, 2021–2028 (USD MILLION)
                                TABLE 222 INDIA: RESTORATIVE DENTISTRY EQUIPMENT MARKET, BY TYPE, 2021–2028 (USD MILLION)
                                TABLE 223 INDIA: DIAGNOSTIC EQUIPMENT MARKET, BY TYPE, 2021–2028 (USD MILLION)
                                TABLE 224 INDIA: FABRICATION EQUIPMENT MARKET, BY TYPE, 2021–2028 (USD MILLION)
                                TABLE 225 INDIA: RESTORATIVE DENTISTRY MARKET, BY TYPE OF CAVITY, 2021–2028 (USD MILLION)
                                TABLE 226 INDIA: RESTORATIVE DENTISTRY MARKET, BY END USER, 2021–2028 (USD MILLION)
           9.4.5 SOUTH KOREA
                    9.4.5.1 Significant growth opportunities due to increasing geriatric population to drive demand
                                TABLE 227 SOUTH KOREA: MACROECONOMIC INDICATORS
                                TABLE 228 SOUTH KOREA: RESTORATIVE DENTISTRY MARKET, BY PRODUCT, 2021–2028 (USD MILLION)
                                TABLE 229 SOUTH KOREA: RESTORATIVE DENTISTRY MATERIALS MARKET, BY TYPE, 2021–2028 (USD MILLION)
                                TABLE 230 SOUTH KOREA: DIRECT RESTORATIVE MATERIALS MARKET, BY TYPE, 2021–2028 (USD MILLION)
                                TABLE 231 SOUTH KOREA: INDIRECT RESTORATIVE MATERIALS MARKET, BY TYPE, 2021–2028 (USD MILLION)
                                TABLE 232 SOUTH KOREA: RESTORATIVE DENTISTRY INSTRUMENTS MARKET, BY TYPE, 2021–2028 (USD MILLION)
                                TABLE 233 SOUTH KOREA: RESTORATIVE DENTISTRY EQUIPMENT MARKET, BY TYPE, 2021–2028 (USD MILLION)
                                TABLE 234 SOUTH KOREA: DIAGNOSTIC EQUIPMENT MARKET, BY TYPE, 2021–2028 (USD MILLION)
                                TABLE 235 SOUTH KOREA: FABRICATION EQUIPMENT MARKET, BY TYPE, 2021–2028 (USD MILLION)
                                TABLE 236 SOUTH KOREA: RESTORATIVE DENTISTRY MARKET, BY TYPE OF CAVITY, 2021–2028 (USD MILLION)
                                TABLE 237 SOUTH KOREA: RESTORATIVE DENTISTRY MARKET, BY END USER, 2021–2028 (USD MILLION)
           9.4.6 AUSTRALIA
                    9.4.6.1 Growing prevalence of dental diseases to support market
                                TABLE 238 AUSTRALIA: MACROECONOMIC INDICATORS
                                TABLE 239 AUSTRALIA: RESTORATIVE DENTISTRY MARKET, BY PRODUCT, 2021–2028 (USD MILLION)
                                TABLE 240 AUSTRALIA: RESTORATIVE DENTISTRY MATERIALS MARKET, BY TYPE, 2021–2028 (USD MILLION)
                                TABLE 241 AUSTRALIA: DIRECT RESTORATIVE MATERIALS MARKET, BY TYPE, 2021–2028 (USD MILLION)
                                TABLE 242 AUSTRALIA: INDIRECT RESTORATIVE MATERIALS MARKET, BY TYPE, 2021–2028 (USD MILLION)
                                TABLE 243 AUSTRALIA: RESTORATIVE DENTISTRY INSTRUMENTS MARKET, BY TYPE, 2021–2028 (USD MILLION)
                                TABLE 244 AUSTRALIA: RESTORATIVE DENTISTRY EQUIPMENT MARKET, BY TYPE, 2021–2028 (USD MILLION)
                                TABLE 245 AUSTRALIA: DIAGNOSTIC EQUIPMENT MARKET, BY TYPE, 2021–2028 (USD MILLION)
                                TABLE 246 AUSTRALIA: FABRICATION EQUIPMENT MARKET, BY TYPE, 2021–2028 (USD MILLION)
                                TABLE 247 AUSTRALIA: RESTORATIVE DENTISTRY MARKET, BY TYPE OF CAVITY, 2021–2028 (USD MILLION)
                                TABLE 248 AUSTRALIA: RESTORATIVE DENTISTRY MARKET, BY END USER, 2021–2028 (USD MILLION)
           9.4.7 REST OF ASIA PACIFIC
                    TABLE 249 REST OF ASIA PACIFIC: RESTORATIVE DENTISTRY MARKET, BY PRODUCT, 2021–2028 (USD MILLION)
                    TABLE 250 REST OF ASIA PACIFIC: RESTORATIVE DENTISTRY MATERIALS MARKET, BY TYPE, 2021–2028 (USD MILLION)
                    TABLE 251 REST OF ASIA PACIFIC: DIRECT RESTORATIVE MATERIALS MARKET, BY TYPE, 2021–2028 (USD MILLION)
                    TABLE 252 REST OF ASIA PACIFIC: INDIRECT RESTORATIVE MATERIALS MARKET, BY TYPE, 2021–2028 (USD MILLION)
                    TABLE 253 REST OF ASIA PACIFIC: RESTORATIVE DENTISTRY INSTRUMENTS MARKET, BY TYPE, 2021–2028 (USD MILLION)
                    TABLE 254 REST OF ASIA PACIFIC: RESTORATIVE DENTISTRY EQUIPMENT MARKET, BY TYPE, 2021–2028 (USD MILLION)
                    TABLE 255 REST OF ASIA PACIFIC: DIAGNOSTIC EQUIPMENT MARKET, BY TYPE, 2021–2028 (USD MILLION)
                    TABLE 256 REST OF ASIA PACIFIC: FABRICATION EQUIPMENT MARKET, BY TYPE, 2021–2028 (USD MILLION)
                    TABLE 257 REST OF ASIA PACIFIC: RESTORATIVE DENTISTRY MARKET, BY TYPE OF CAVITY, 2021–2028 (USD MILLION)
                    TABLE 258 REST OF ASIA PACIFIC: RESTORATIVE DENTISTRY MARKET, BY END USER, 2021–2028 (USD MILLION)
    9.5 LATIN AMERICA 
           9.5.1 LATIN AMERICA: RECESSION IMPACT
                    TABLE 259 LATIN AMERICA: RESTORATIVE DENTISTRY MARKET, BY COUNTRY, 2021–2028 (USD MILLION)
                    TABLE 260 LATIN AMERICA: RESTORATIVE DENTISTRY MARKET, BY PRODUCT, 2021–2028 (USD MILLION)
                    TABLE 261 LATIN AMERICA: RESTORATIVE DENTISTRY MATERIALS MARKET, BY TYPE, 2021–2028 (USD MILLION)
                    TABLE 262 LATIN AMERICA: DIRECT RESTORATIVE MATERIALS MARKET, BY TYPE, 2021–2028 (USD MILLION)
                    TABLE 263 LATIN AMERICA: INDIRECT RESTORATIVE MATERIALS MARKET, BY TYPE, 2021–2028 (USD MILLION)
                    TABLE 264 LATIN AMERICA: RESTORATIVE DENTISTRY INSTRUMENTS MARKET, BY TYPE, 2021–2028 (USD MILLION)
                    TABLE 265 LATIN AMERICA: RESTORATIVE DENTISTRY EQUIPMENT MARKET, BY TYPE, 2021–2028 (USD MILLION)
                    TABLE 266 LATIN AMERICA: DIAGNOSTIC EQUIPMENT MARKET, BY TYPE, 2021–2028 (USD MILLION)
                    TABLE 267 LATIN AMERICA: FABRICATION EQUIPMENT MARKET, BY TYPE, 2021–2028 (USD MILLION)
                    TABLE 268 LATIN AMERICA: RESTORATIVE DENTISTRY MARKET, BY TYPE OF CAVITY, 2021–2028 (USD MILLION)
                    TABLE 269 LATIN AMERICA: RESTORATIVE DENTISTRY MARKET, BY END USER, 2021–2028 (USD MILLION)
           9.5.2 BRAZIL
                    9.5.2.1 Rising investments in R&D and growing popularity of restorative dentistry to promote market growth
                                TABLE 270 BRAZIL: RESTORATIVE DENTISTRY MARKET, BY PRODUCT, 2021–2028 (USD MILLION)
                                TABLE 271 BRAZIL: RESTORATIVE DENTISTRY MATERIALS MARKET, BY TYPE, 2021–2028 (USD MILLION)
                                TABLE 272 BRAZIL: DIRECT RESTORATIVE MATERIALS MARKET, BY TYPE, 2021–2028 (USD MILLION)
                                TABLE 273 BRAZIL: INDIRECT RESTORATIVE MATERIALS MARKET, BY TYPE, 2021–2028 (USD MILLION)
                                TABLE 274 BRAZIL: RESTORATIVE DENTISTRY INSTRUMENTS MARKET, BY TYPE, 2021–2028 (USD MILLION)
                                TABLE 275 BRAZIL: RESTORATIVE DENTISTRY EQUIPMENT MARKET, BY TYPE, 2021–2028 (USD MILLION)
                                TABLE 276 BRAZIL: DIAGNOSTIC EQUIPMENT MARKET, BY TYPE, 2021–2028 (USD MILLION)
                                TABLE 277 BRAZIL: FABRICATION EQUIPMENT MARKET, BY TYPE, 2021–2028 (USD MILLION)
                                TABLE 278 BRAZIL: RESTORATIVE DENTISTRY MARKET, BY TYPE OF CAVITY, 2021–2028 (USD MILLION)
                                TABLE 279 BRAZIL: RESTORATIVE DENTISTRY MARKET, BY END USER, 2021–2028 (USD MILLION)
           9.5.3 MEXICO
                    9.5.3.1 Growing medical tourism to promote market growth
                                TABLE 280 MEXICO: RESTORATIVE DENTISTRY MARKET, BY PRODUCT, 2021–2028 (USD MILLION)
                                TABLE 281 MEXICO: RESTORATIVE DENTISTRY MATERIALS MARKET, BY TYPE, 2021–2028 (USD MILLION)
                                TABLE 282 MEXICO: DIRECT RESTORATIVE MATERIALS MARKET, BY TYPE, 2021–2028 (USD MILLION)
                                TABLE 283 MEXICO: INDIRECT RESTORATIVE MATERIALS MARKET, BY TYPE, 2021–2028 (USD MILLION)
                                TABLE 284 MEXICO: RESTORATIVE DENTISTRY INSTRUMENTS MARKET, BY TYPE, 2021–2028 (USD MILLION)
                                TABLE 285 MEXICO: RESTORATIVE DENTISTRY EQUIPMENT MARKET, BY TYPE, 2021–2028 (USD MILLION)
                                TABLE 286 MEXICO: DIAGNOSTIC EQUIPMENT MARKET, BY TYPE, 2021–2028 (USD MILLION)
                                TABLE 287 MEXICO: FABRICATION EQUIPMENT MARKET, BY TYPE, 2021–2028 (USD MILLION)
                                TABLE 288 MEXICO: RESTORATIVE DENTISTRY MARKET, BY TYPE OF CAVITY, 2021–2028 (USD MILLION)
                                TABLE 289 MEXICO: RESTORATIVE DENTISTRY MARKET, BY END USER, 2021–2028 (USD MILLION)
           9.5.4 REST OF LATIN AMERICA
                    TABLE 290 REST OF LATIN AMERICA: RESTORATIVE DENTISTRY MARKET, BY PRODUCT, 2021–2028 (USD MILLION)
                    TABLE 291 REST OF LATIN AMERICA: RESTORATIVE DENTISTRY MATERIALS MARKET, BY TYPE, 2021–2028 (USD MILLION)
                    TABLE 292 REST OF LATIN AMERICA: DIRECT RESTORATIVE MATERIALS MARKET, BY TYPE, 2021–2028 (USD MILLION)
                    TABLE 293 REST OF LATIN AMERICA: INDIRECT RESTORATIVE MATERIALS MARKET, BY TYPE, 2021–2028 (USD MILLION)
                    TABLE 294 REST OF LATIN AMERICA: RESTORATIVE DENTISTRY INSTRUMENTS MARKET, BY TYPE, 2021–2028 (USD MILLION)
                    TABLE 295 REST OF LATIN AMERICA: RESTORATIVE DENTISTRY EQUIPMENT MARKET, BY TYPE, 2021–2028 (USD MILLION)
                    TABLE 296 REST OF LATIN AMERICA: DIAGNOSTIC EQUIPMENT MARKET, BY TYPE, 2021–2028 (USD MILLION)
                    TABLE 297 REST OF LATIN AMERICA: FABRICATION EQUIPMENT MARKET, BY TYPE, 2021–2028 (USD MILLION)
                    TABLE 298 REST OF LATIN AMERICA: RESTORATIVE DENTISTRY MARKET, BY TYPE OF CAVITY, 2021–2028 (USD MILLION)
                    TABLE 299 REST OF LATIN AMERICA: RESTORATIVE DENTISTRY MARKET, BY END USER, 2021–2028 (USD MILLION)
    9.6 MIDDLE EAST & AFRICA 
           9.6.1 GROWING AWARENESS ABOUT DENTAL HYGIENE & ADVANCED TECHNOLOGIES TO DRIVE MARKET DEMAND
           9.6.2 MIDDLE EAST & AFRICA: RECESSION IMPACT
                    TABLE 300 MIDDLE EAST & AFRICA: RESTORATIVE DENTISTRY MARKET, BY PRODUCT, 2021–2028 (USD MILLION)
                    TABLE 301 MIDDLE EAST & AFRICA: RESTORATIVE DENTISTRY MATERIALS MARKET, BY TYPE, 2021–2028 (USD MILLION)
                    TABLE 302 MIDDLE EAST & AFRICA: DIRECT RESTORATIVE MATERIALS MARKET, BY TYPE, 2021–2028 (USD MILLION)
                    TABLE 303 MIDDLE EAST & AFRICA: INDIRECT RESTORATIVE MATERIALS MARKET, BY TYPE, 2021–2028 (USD MILLION)
                    TABLE 304 MIDDLE EAST & AFRICA: RESTORATIVE DENTISTRY INSTRUMENTS MARKET, BY TYPE, 2021–2028 (USD MILLION)
                    TABLE 305 MIDDLE EAST & AFRICA: RESTORATIVE DENTISTRY EQUIPMENT MARKET, BY TYPE, 2021–2028 (USD MILLION)
                    TABLE 306 MIDDLE EAST & AFRICA: DIAGNOSTIC EQUIPMENT MARKET, BY TYPE, 2021–2028 (USD MILLION)
                    TABLE 307 MIDDLE EAST & AFRICA: FABRICATION EQUIPMENT MARKET, BY TYPE, 2021–2028 (USD MILLION)
                    TABLE 308 MIDDLE EAST & AFRICA: RESTORATIVE DENTISTRY MARKET, BY TYPE OF CAVITY, 2021–2028 (USD MILLION)
                    TABLE 309 MIDDLE EAST & AFRICA: RESTORATIVE DENTISTRY MARKET, BY END USER, 2021–2028 (USD MILLION)
 
10 COMPETITIVE LANDSCAPE (Page No. - 248)
     10.1 INTRODUCTION 
     10.2 KEY STRATEGIES/RIGHT TO WIN 
             TABLE 310 KEY STRATEGIES ADOPTED BY MAJOR PLAYERS IN RESTORATIVE DENTISTRY MARKET, JANUARY 2020–OCTOBER 2023
     10.3 REVENUE SHARE ANALYSIS 
             FIGURE 38 REVENUE ANALYSIS OF KEY PLAYERS
     10.4 MARKET SHARE ANALYSIS 
             FIGURE 39 RESTORATIVE DENTISTRY MARKET SHARE OF MATERIALS, BY KEY PLAYER, 2022
             FIGURE 40 RESTORATIVE DENTISTRY MARKET SHARE OF INSTRUMENTS, BY KEY PLAYER, 2022
             FIGURE 41 RESTORATIVE DENTISTRY MARKET SHARE OF EQUIPMENT, BY KEY PLAYER, 2022
     10.5 COMPANY EVALUATION MATRIX 
             10.5.1 STARS
             10.5.2 EMERGING LEADERS
             10.5.3 PERVASIVE PLAYERS
             10.5.4 PARTICIPANTS
                        FIGURE 42 COMPANY EVALUATION MATRIX, 2022
             10.5.5 COMPANY FOOTPRINT
                        TABLE 311 OVERALL COMPANY FOOTPRINT (25 COMPANIES)
                        TABLE 312 PRODUCT FOOTPRINT (25 COMPANIES)
                        TABLE 313 END-USER FOOTPRINT (25 COMPANIES)
                        TABLE 314 REGIONAL FOOTPRINT (25 COMPANIES)
     10.6 START-UP/SME EVALUATION MATRIX 
             10.6.1 PROGRESSIVE COMPANIES
             10.6.2 RESPONSIVE COMPANIES
             10.6.3 DYNAMIC COMPANIES
             10.6.4 STARTING BLOCKS
                        FIGURE 43 START-UP/SME EVALUATION MATRIX, 2022
             10.6.5 COMPETITIVE BENCHMARKING
     10.7 COMPETITIVE SCENARIOS AND TRENDS 
             10.7.1 PRODUCT LAUNCHES & APPROVALS, 2020–2023
                        TABLE 315 KEY PRODUCT LAUNCHES & APPROVALS, JANUARY 2020 TO OCTOBER 2023
             10.7.2 KEY DEALS
                        TABLE 316 KEY DEALS, JANUARY 2020–OCTOBER 2023
             10.7.3 OTHER KEY DEVELOPMENTS
                        TABLE 317 OTHER KEY DEVELOPMENTS, JANUARY 2020–OCTOBER 2023
 
11 COMPANY PROFILES (Page No. - 265)
(Business Overview, Products/Services/Solutions Offered, Recent Developments, and MnM View (Key strengths/Right to Win, Strategic Choices Made, and Weaknesses and Competitive Threats))*
     11.1 KEY PLAYERS 
             11.1.1 ENVISTA HOLDINGS CORPORATION
                        TABLE 318 ENVISTA HOLDINGS CORPORATION: COMPANY OVERVIEW
                        FIGURE 44 COMPANY SNAPSHOT: ENVISTA HOLDINGS CORPORATION (2022)
             11.1.2 DENTSPLY SIRONA INC.
                        TABLE 319 DENTSPLY SIRONA INC.: COMPANY OVERVIEW
                        FIGURE 45 COMPANY SNAPSHOT: DENTSPLY SIRONA INC. (2022)
             11.1.3 3M
                        TABLE 320 3M: COMPANY OVERVIEW
                        FIGURE 46 COMPANY SNAPSHOT: 3M (2022)
             11.1.4 COSMEDENT
                        TABLE 321 COSMEDENT: COMPANY OVERVIEW
             11.1.5 COLTENE GROUP
                        TABLE 322 COLTENE GROUP: COMPANY OVERVIEW
                        FIGURE 47 COMPANY SNAPSHOT: COLTENE GROUP (2022)
             11.1.6 MITSUI CHEMICALS, INC.
                        TABLE 323 MITSUI CHEMICALS, INC.: COMPANY OVERVIEW
                        FIGURE 48 COMPANY SNAPSHOT: MITSUI CHEMICALS, INC. (2022)
             11.1.7 GC CORPORATION
                        TABLE 324 GC CORPORATION: COMPANY OVERVIEW
             11.1.8 TOKUYAMA DENTAL CORPORATION
                        TABLE 325 TOKUYAMA DENTAL CORPORATION: COMPANY OVERVIEW
             11.1.9 IVOCLAR VIVADENT
                        TABLE 326 IVOCLAR VIVADENT: COMPANY OVERVIEW
             11.1.10 J. MORITA CORP.
                        TABLE 327 J. MORITA CORP.: COMPANY OVERVIEW
     11.2 OTHER PLAYERS 
             11.2.1 SEPTODONT HOLDING
                        TABLE 328 SEPTODONT HOLDING: COMPANY OVERVIEW
             11.2.2 VOCO GMBH
                        TABLE 329 VOCO GMBH: COMPANY OVERVIEW
             11.2.3 BEGO GMBH & CO. KG
                        TABLE 330 BEGO GMBH & CO. KG: COMPANY OVERVIEW
             11.2.4 KURARAY CO., LTD.
                        TABLE 331 KURARAY CO., LTD.: COMPANY OVERVIEW
                        FIGURE 49 COMPANY SNAPSHOT: KURARAY CO., LTD. (2022)
             11.2.5 DMG CHEMISCH-PHARMAZEUTISCHE FABRIK GMBH
                        TABLE 332 DMG CHEMISCH-PHARMAZEUTISCHE FABRIK GMBH: COMPANY OVERVIEW
             11.2.6 PARKELL, INC.
                        TABLE 333 PARKELL, INC.: COMPANY OVERVIEW
             11.2.7 DIADENT GROUP INTERNATIONAL
                        TABLE 334 DIADENT GROUP INTERNATIONAL: COMPANY OVERVIEW
             11.2.8 ULTRADENT PRODUCTS, INC.
                        TABLE 335 ULTRADENT PRODUCTS, INC.: COMPANY OVERVIEW
             11.2.9 BRASSELER USA
                        TABLE 336 BRASSELER USA: COMPANY OVERVIEW
             11.2.10 SHOFU INC.
                        TABLE 337 SHOFU INC.: COMPANY OVERVIEW
             11.2.11 SDI LIMITED
                        TABLE 338 SDI LIMITED: COMPANY OVERVIEW
                        FIGURE 50 COMPANY SNAPSHOT: SDI LIMITED (2022)
             11.2.12 ZHERMACK SPA
             11.2.13 DENTAURUM GMBH & CO. KG
             11.2.14 BISCO, INC.
             11.2.15 DENTAL TECHNOLOGIES INC.
                        TABLE 339 DENTAL TECHNOLOGIES INC.: COMPANY OVERVIEW
 
*Details on Business Overview, Products/Services/Solutions Offered, Recent Developments, and MnM View (Key strengths/Right to Win, Strategic Choices Made, and Weaknesses and Competitive Threats) might not be captured in case of unlisted companies.
 
12 APPENDIX (Page No. - 329)
     12.1 DISCUSSION GUIDE 
     12.2 KNOWLEDGESTORE: MARKETSANDMARKETS’ SUBSCRIPTION PORTAL 
     12.3 CUSTOMIZATION OPTIONS 
     12.4 RELATED REPORTS 
     12.5 AUTHOR DETAILS 

The study involved four major activities to estimate the current size of the Restorative dentistry market. Exhaustive secondary research was carried out to collect information on the market and its different subsegments. The next step was to validate these findings, assumptions, and sizing with industry experts across the value chain through primary research. Top-down and bottom-up approaches were employed to estimate the complete market size. Thereafter, market breakdown and data triangulation procedures were used to estimate the size of segments and subsegments.

Secondary Research

This research study involved using various secondary sources; directories; databases such as Bloomberg Business, Factiva, and Wall Street Journal; white papers; annual reports; companies house documents; investor presentations; and SEC filings of companies. The secondary research approach has been used to identify and collect information useful for the extensive, technical, market-oriented, and commercial study of the restorative dentistry market. It was also used to obtain important information about key players, market classification, and segmentation according to industry trends and key developments related to market perspectives. A database of the key industry leaders has also been prepared using secondary research.

Primary Research

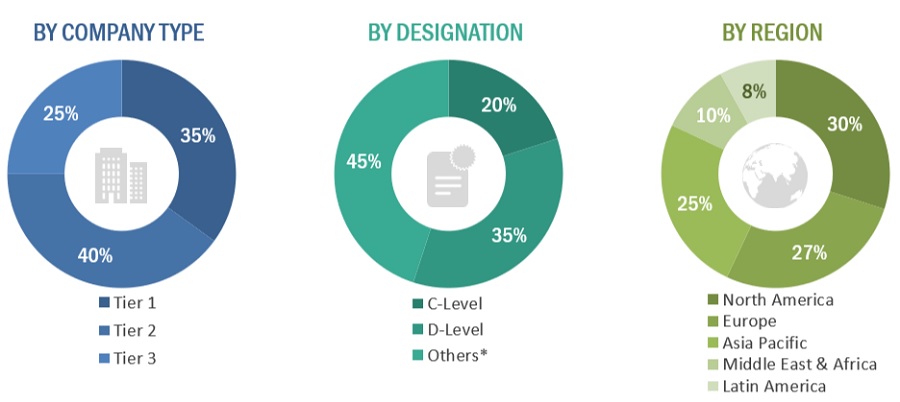
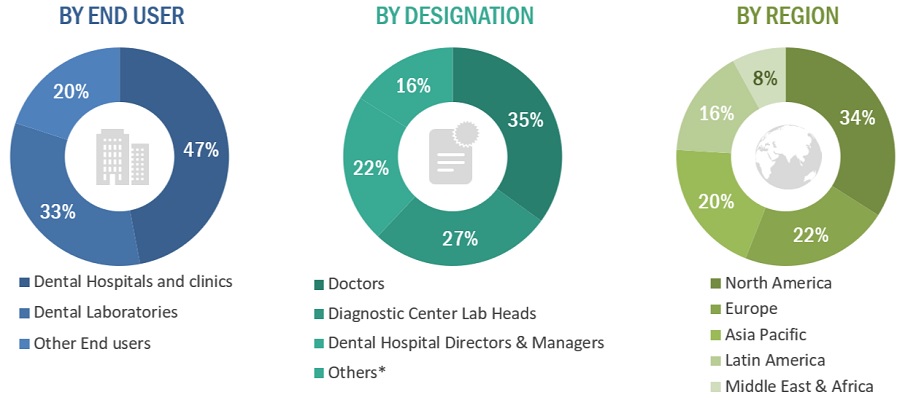
The restorative dentistry market comprises several stakeholders such as manufactures, distributers, In the primary research approach, various sources from both the supply and demand sides have been interviewed to obtain qualitative and quantitative information pertaining to this report. The following is the breakdown of primary respondents:

Primary Interviews by Supply Side :
Restorative dentistry Market Size, and Share

To know about the assumptions considered for the study, download the pdf brochure

Primary Interviews by Demand side:
Restorative dentistry Market Size, and Share

Restorative dentistry Market Size, and Share

To know about the assumptions considered for the study, Request for Free Sample Report

Market Size Estimation

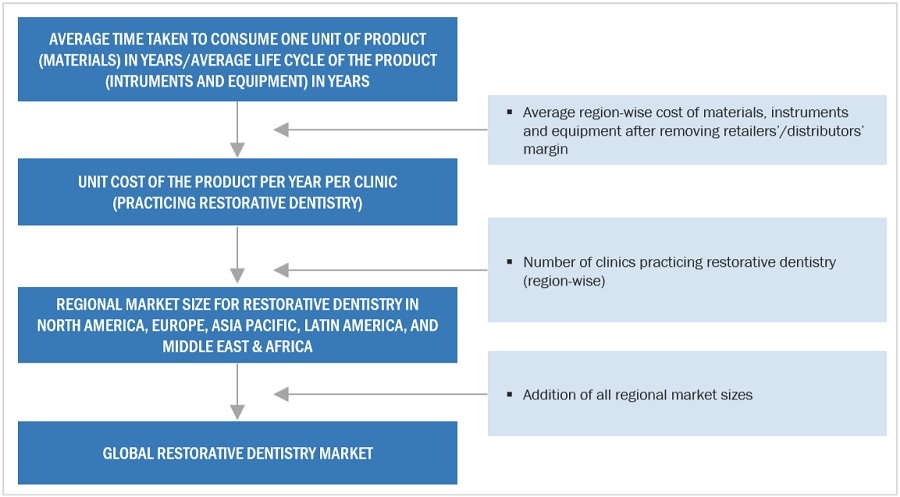
Both top-down and bottom-up approaches were used to estimate and validate the total size of the restorative dentistry market. These methods were also used extensively to estimate the size of various subsegments in the market. The research methodology used to estimate the market size includes the following:

  • The key players in the industry and markets have been identified through extensive secondary research
  • The industry’s supply chain and market size, in terms of value, have been determined through primary and secondary research
  • All percentage shares, splits, and breakdowns have been determined using secondary sources and verified through primary sources

Restorative dentistry Market Size, and Share

Data Triangulation

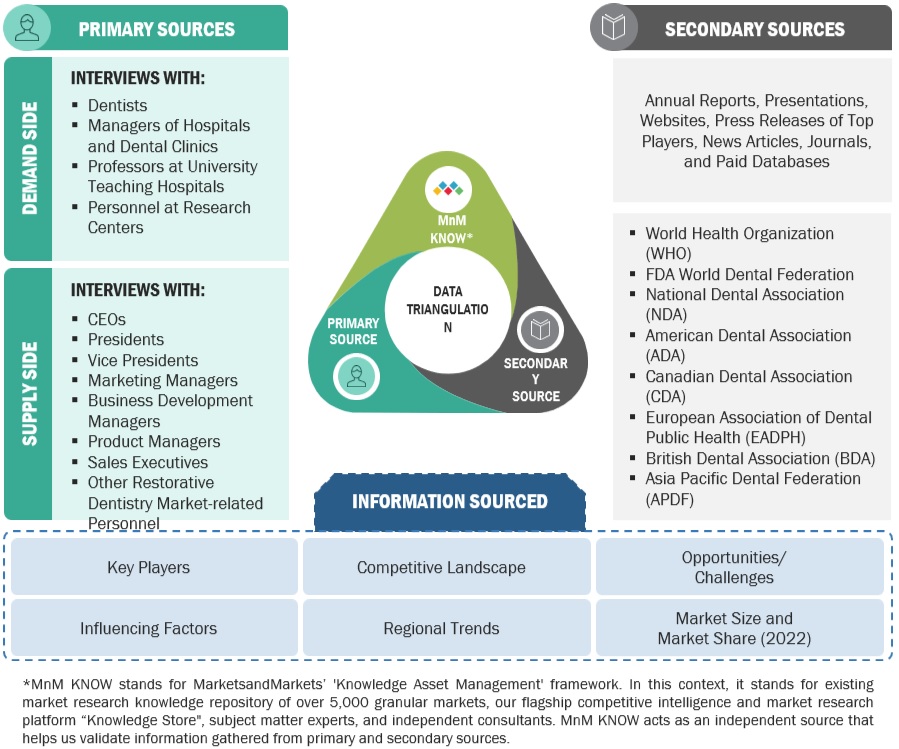
After arriving at the overall size of the global restorative dentistry market through the above-mentioned methodology, this market was split into several segments and subsegments. The data triangulation and market breakdown procedures were employed, wherever applicable, to complete the overall market engineering process and arrive at the exact market value data for the key segments and subsegments. The extrapolated market data was triangulated by studying various macro indicators and regional trends from both demand- and supply-side participants.
Restorative dentistry Market Size, and Share

Market Definition

Restorative dentistry is a branch of dentistry that focuses on restoring the structure, function, and esthetics of the natural teeth, the lack of which results from dental caries, or dental injuries. Dental restoration procedures include class 1, 2, 3, 4, 5 and 6 cavity fillings (depending on the affected surface of the tooth) using various types of restorative materials, which maybe directly or indirectly placed.

Key stakeholders

  • Dental consumable manufacturers
  • Suppliers and distributors of dental consumables
  • Dental research institutes
  • Dental laboratories
  • Healthcare services providers (Hospitals and public & private clinics)
  • Government associations
  • Market research and consulting firms
  • Venture capitalists and investors

Report Objectives

  • To define, describe, and forecast the global restorative dentistry market on the basis of product, type of cavity, end user and region.
  • To provide detailed information regarding the major factors influencing the market growth (such as drivers, restraints, opportunities, and challenges)
  • To strategically analyze micromarkets1 with respect to individual growth trends, future prospects, and contributions to the overall market
  • To analyze the opportunities in the market for key stakeholders and provide details of the competitive landscape for major market leaders
  • To forecast the size of the market segments with respect to five main regions, namely, North America (the US and Canada), Europe (Germany, the UK, France, Italy, Spain, and Rest of Europe), Asia Pacific (Japan, China, India, Australia, South Korea, and Rest of Asia Pacific), Latin America (Brazil, Mexico, and Rest of Latin America), and the Middle East & Africa
  • To profile the key market players and comprehensively analyze their market shares and core competencies
  • To track and analyze competitive developments such as mergers and acquisitions, new product developments, partnerships, agreements, collaborations, and expansions in the global restorative dentistry market

Available Customizations

With the given market data, MarketsandMarkets offers customizations as per your company’s specific needs. The following customization options are available for the global restorative dentistry market report

Product Analysis

  • Product Matrix, which gives a detailed comparison of the product portfolios of the top five global players.

Company Information

  • Detailed analysis and profiling of additional market players (up to 5 OEMs)

Geographic Analysis

  • Further breakdown of the Rest of Europe restorative dentistry market into Belgium, Austria,s
  • Denmark, Greece, Poland, and Russia, among other countries
  • Further breakdown of the Rest of Asia Pacific restorative dentistry market into New Zealand, Vietnam, Philippines, Singapore, Malaysia, Thailand, and Indonesia, among other countries
  • Further breakdown of the Rest of Latin America restorative dentistry market into Argentina, and Colombia, among other countries.
Custom Market Research Services

We will customize the research for you, in case the report listed above does not meet with your exact requirements. Our custom research will comprehensively cover the business information you require to help you arrive at strategic and profitable business decisions.

Request Customization

Instant Answers with GPT - Ask Now!

Ask real questions. Get complete answers !
Report Code
MD 5593
Published ON
Nov, 2023
Choose License Type
BUY NOW
  • SHARE
X
Request Customization
Speak to Analyst
Speak to Analyst
OR FACE-TO-FACE MEETING
PERSONALIZE THIS RESEARCH
  • Triangulate with your Own Data
  • Get Data as per your Format and Definition
  • Gain a Deeper Dive on a Specific Application, Geography, Customer or Competitor
  • Any level of Personalization
REQUEST A FREE CUSTOMIZATION
LET US HELP YOU!
  • What are the Known and Unknown Adjacencies Impacting the Restorative Dentistry Market
  • What will your New Revenue Sources be?
  • Who will be your Top Customer; what will make them switch?
  • Defend your Market Share or Win Competitors
  • Get a Scorecard for Target Partners
CUSTOMIZED WORKSHOP REQUEST
  • Call Us
  • +1-888-600-6441 (Corporate office hours)
  • +1-888-600-6441 (US/Can toll free)
  • +44-800-368-9399 (UK office hours)
CONNECT WITH US
ABOUT TRUST ONLINE
©2024 MarketsandMarkets Research Private Ltd. All rights reserved
DMCA.com Protection Status
Website Feedback