Secure Multiparty Computation (SMPC) Market

Secure Multiparty Computation (SMPC) Market by Offering (Solutions and Services), Deployment Mode (Cloud and On-premises), Vertical (BFSI, IT & ITeS, Government, Healthcare, and Retail & E-commerce) and Region - Global Forecast to 2029

Report Code: TC 9038 Jun, 2024, by marketsandmarkets.com

[154 Pages Report] The global secure multiparty computation market size is projected to grow from USD 824 million in 2024 to USD 1,412 million by 2029 at a Compound Annual Growth Rate (CAGR) of 11.4% during the forecast period. Demand for private key security with SMPC and data privacy regulations compliance are driving significant growth in the SMPC market.

Secure Multiparty Computation (SMPC)  Market

To know about the assumptions considered for the study, Request for Free Sample Report

Secure Multiparty Computation (SMPC)  Market Opportunities

To know about the assumptions considered for the study, download the pdf brochure

Secure Multiparty Computation Market Dynamics

Driver: Demand for private key security with SMPC

SMPC breaks down private keys into shares, encrypts them, and distributes them across multiple parties and eliminates the risk of unauthorized access. These parties can then compute their portion of the key without ever revealing the full key or the encryption to each other. This decentralized approach of the key makes it more difficult for attackers to steal the private key. Even if an attacker hacks one party, they wouldn't have access to the entire key and would need to compromise multiple parties simultaneously, significantly increasing the difficulty of a successful attack. This enhanced security through distributed key storage allows secure online storage of digital assets, eliminating the need for tiresome cold storage solutions and enabling smoother transfers. Additionally, it also enables multiple individuals to access a wallet without the concern of any one of them acting maliciously and absconding with the digital assets it holds.

Restraint: increased computation time

Opportunity: Increased adoption of AI and ML

The growing adoption of Artificial Intelligence (AI) and Machine Learning (ML) technologies presents a lucrative opportunity for the Secure Multiparty Computation (SMPC) market. With organizations increasingly relying on AI and ML algorithms to derive insights from vast datasets, safeguarding the privacy and security of sensitive information becomes essential. AI models can be trained on sensitive data from multiple parties without exposing the data itself. SMPC ensures that data remains encrypted during the training process, preserving privacy and confidentiality. These technologies can be beneficial in various industries like financial institutions can use AI and SMPC to integrate and analyze data from different sources securely. This helps in identifying fraud patterns and developing comprehensive risk mitigation strategies.

Challenge: Lack of skilled professionals in SMPC technology

SMPC involves complex cryptographic protocols and secure computation techniques, demanding specialized knowledge and expertise for effective implementation. However, there is a shortage in professionals possessing the required skillset and experience in SMPC technology, making it challenging for organizations to find qualified staff to develop, deploy, and manage SMPC solutions.

The lack of proficient professionals acts as a barrier for the adoption of SMPC across various industries and sectors. Without access to skilled talent, organizations may find it difficult to address the technical complexities associated with implementing SMPC solutions, resulting in delays in implementation and decreased innovation within the market.

Secure Multiparty Computation Market Ecosystem

Top Companies in Secure Multiparty Computation (SMPC)  Market

By vertical, BFSI is expected to grow at the highest CAGR during the forecast period.

The activities of fraudsters are becoming increasingly sophisticated and pervasive. However, technological advancements are keeping pace to counter these threats. While greater collaboration among stakeholders is essential, it often poses significant challenges. This is where SMPC, a technology that preserves privacy, becomes crucial. SMPC enables companies and financial institutions to engage with targeted individuals without jeopardizing their confidential information, thereby fostering trust and paving the way for advanced solutions that provide peace of mind to all involved parties. In the realm of fraud detection and prevention, MPC allows the secure utilization of confidential data across banks, regulators, and jurisdictions. This ensures regulatory compliance and maintains competitive integrity, all while upholding individuals' privacy rights.

By deployment mode, cloud segment is expected to grow at the highest CAGR during the forecast period.

Leveraging the cloud for SMPC offers a compelling solution for data analysis in today's privacy-conscious world. With SMPC in the cloud, multiple parties can collaborate on tasks involving confidential data without any party ever seeing the raw information of others. This enables valuable data insights to be extracted from combined datasets across different organizations, such as healthcare institutions analyzing disease patterns or financial institutions jointly detecting fraud. Cloud-based SMPC fosters secure collaboration while adhering to data privacy regulations and keeping sensitive information within each party's control.

By region, North America accounts for the highest market size during the forecast period.

North America is expected to hold the largest market share in the SMPC market due to its heightened security concerns and technological advancements. With rising data security threats and incidents, there's a pressing need for sophisticated and integrated data security solutions, which SMPC addresses by offering a comprehensive approach. Additionally, the growing adoption of cloud computation in the region, with their scalability, affordability, and easier deployment, further contributes to the market growth. Moreover, collaborations between leading SMPC providers and technology partners have introduced innovative integrations, enhancing SMPC capabilities and making them more appealing to North American organizations. Furthermore, companies are focusing on advancing SMPC technology in critical sectors such as government, and healthcare, driving the adoption of secure computation solutions in the region. These factors collectively position North America at the forefront of SMPC market growth and adoption.

North American Secure Multiparty Computation (SMPC)  Market Size, and Share

Key players

The key players in the SMPC market are Microsoft (US), IBM (US), Google (US), Fireblocks (US), Blockdaemon (US), Qredo (British Virgin Islands), Penta Security (South Korea), Zengo (Israel), Inpher (US), CYBAVO (Singapore), Liminal Custody (Singapore), Spatium (Singapore), Silence Laboratories (Singapore), Sharemind (Estonia), Atato (Singapore), Web3Auth (Singapore), Partisia Blockchain (Switzerland), Orochi Network (Singapore), Binance (Malta), Pyte (US), Roseman Labs (Netherlands), MPCVault (US), DuoKey (Switzerland), Linksight (Netherlands), HyperBC (Dubai), and others.

Get online access to the report on the World's First Market Intelligence Cloud

  • Easy to Download Historical Data & Forecast Numbers
  • Company Analysis Dashboard for high growth potential opportunities
  • Research Analyst Access for customization & queries
  • Competitor Analysis with Interactive dashboard
  • Latest News, Updates & Trend analysis
Request Sample

Scope of the Report

Report Metrics

Details

Market size available for years

  • 2018-2029

Base year considered

  • 2023

Forecast period

  • 2024–2029

Forecast units

  • Value (USD Million/USD Billion) 

Segments Covered

  • Offering, Deployment Mode, Vertical, And Region

Geographies covered

  • North America, Europe, Asia Pacific, and Rest of World

Companies covered

  • Major vendors in the global secure multiparty computation market Microsoft (US), IBM (US), Google (US), Fireblocks (US), Blockdaemon (US), Qredo (British Virgin Islands), Penta Security (South Korea), Zengo (Israel), Inpher (US), CYBAVO (Singapore), Liminal Custody (Singapore), Spatium (Singapore), Silence Laboratories (Singapore), Sharemind (Estonia), Atato (Singapore), Web3Auth (Singapore), Partisia Blockchain (Switzerland), Orochi Network (Singapore), Binance (Malta), Pyte (US), Roseman Labs (Netherlands), MPCVault (US), DuoKey (Switzerland), Linksight (Netherlands), HyperBC (Dubai).   

Secure Multiparty Computation (SMPC) Market Highlights

This research report categorizes the Secure Multiparty Computation (SMPC) Market to forecast revenues and analyze trends in each of the following submarkets:

Segment

Subsegment

By Offering:

  • Solution
  • Services

By Deployment Mode:

  • Cloud
  • On-Premises

By Vertical:

  • Banking, Financial Services, and Insurance (BFSI)
  • IT & ITeS
  • Government
  • Healthcare
  • Retail and eCommerce

By Region:

  • North America
  • Europe
  • Asia Pacific
  • Rest of World

Recent Developments

  • In October 2022, an enterprise-ready privacy-enhanced data collaboration platform has been released by Duality Technologies, the industry leader in secure data collaboration for businesses. It allows businesses to exchange and collaboratively analyze sensitive data while maintaining privacy and regulatory compliance. To calculate on data without revealing it, Duality easily interacts with OpenFHE, the top open-source fully homomorphic encryption library. These consist of differential privacy, federated learning, multiparty computation, completely homomorphic encryption, and more.
  • In October 2022, Google Cloud launches Confidential Space to enhance joint data analysis and ML model training. Verifiable attestation provided by Confidential Space can assist in guaranteeing that all partners safely approve while never disclosing their secret signing keys to outside parties, such as the platform operator. An auditable signing procedure can involve dispersed collaborators that rely on multiparty computation (MPC).
  • In February 2021, The pioneer in cryptographic key management and security solutions, Unbound Security, announced the opening of Unbound MPC Labs, a research project to enhance multiparty computation research (MPC) and its commercial applications.

Frequently Asked Questions (FAQ):

To speak to our analyst for a discussion on the above findings, click Speak to Analyst

TABLE OF CONTENTS
 
1 INTRODUCTION (Page No. - 17)
    1.1 STUDY OBJECTIVES 
    1.2 MARKET DEFINITION 
           1.2.1 INCLUSIONS AND EXCLUSIONS
    1.3 STUDY SCOPE 
           1.3.1 MARKET SEGMENTATION
           1.3.2 REGIONS COVERED
    1.4 YEARS CONSIDERED 
    1.5 CURRENCY CONSIDERED 
           TABLE 1 USD EXCHANGE RATES, 2020–2023
    1.6 STAKEHOLDERS 
 
2 RESEARCH METHODOLOGY (Page No. - 21)
    2.1 RESEARCH DATA 
           FIGURE 1 SECURE MULTIPARTY COMPUTATION MARKET: RESEARCH DESIGN
           2.1.1 SECONDARY DATA
           2.1.2 PRIMARY DATA
                    2.1.2.1 Breakup of primary profiles
                    2.1.2.2 Key industry insights
    2.2 MARKET BREAKUP AND DATA TRIANGULATION 
    2.3 MARKET SIZE ESTIMATION 
           2.3.1 REVENUE ESTIMATES
                    FIGURE 2 APPROACH 1 (SUPPLY SIDE): REVENUE OF SMPC VENDORS FROM SOLUTIONS/SERVICES
                    FIGURE 3 MARKET SIZE ESTIMATION METHODOLOGY—APPROACH 1, SUPPLY-SIDE ANALYSIS
                    FIGURE 4 APPROACH 2, BOTTOM-UP (SUPPLY SIDE): COLLECTIVE REVENUE FROM ALL SOLUTIONS AND SERVICES OF SMPC VENDORS
           2.3.2 DEMAND-SIDE ANALYSIS
                    FIGURE 5 MARKET SIZE ESTIMATION METHODOLOGY—APPROACH 3, TOP-DOWN (DEMAND SIDE)
    2.4 MARKET FORECAST 
           TABLE 2 SECURE MULTIPARTY COMPUTATION MARKET: FACTOR ANALYSIS
    2.5 RESEARCH ASSUMPTIONS 
    2.6 LIMITATIONS AND RISK ASSESSMENT 
    2.7 RECESSION IMPACT ANALYSIS 
 
3 EXECUTIVE SUMMARY (Page No. - 31)
    TABLE 3 SECURE MULTIPARTY COMPUTATION MARKET AND GROWTH RATE, 2018–2023 (USD MILLION, Y-O-Y %) 
    TABLE 4 MARKET AND GROWTH RATE, 2024–2029 (USD MILLION, Y-O-Y %) 
    FIGURE 6 GLOBAL MARKET SIZE AND Y-O-Y GROWTH RATE 
    FIGURE 7 SEGMENTS WITH HIGH GROWTH RATES DURING FORECAST PERIOD 
    FIGURE 8 NORTH AMERICA TO ACCOUNT FOR LARGEST SHARE IN 2024 
 
4 PREMIUM INSIGHTS (Page No. - 35)
    4.1 ATTRACTIVE OPPORTUNITIES FOR PLAYERS IN SECURE MULTIPARTY COMPUTATION MARKET 
           FIGURE 9 RISE IN DATA BREACH TO DRIVE DEMAND FOR SECURE COMPUTATION
    4.2 MARKET, BY OFFERING, 2024 
           FIGURE 10 SOLUTIONS SEGMENT TO ACCOUNT FOR LARGER MARKET DURING FORECAST PERIOD
    4.3 MARKET, BY DEPLOYMENT MODE, 2024 
           FIGURE 11 CLOUD SEGMENT TO ACCOUNT FOR LARGER MARKET DURING FORECAST PERIOD
    4.4 MARKET, BY VERTICAL AND REGION 
           FIGURE 12 HEALTHCARE VERTICAL AND NORTH AMERICA TO ACCOUNT FOR SIGNIFICANT SHARES IN 2024
    4.5 MARKET INVESTMENT SCENARIO 
           FIGURE 13 ASIA PACIFIC TO EMERGE AS BEST MARKET FOR INVESTMENTS DURING FORECAST PERIOD
 
5 MARKET OVERVIEW AND INDUSTRY TRENDS (Page No. - 38)
    5.1 INTRODUCTION 
    5.2 MARKET DYNAMICS 
           FIGURE 14 DRIVERS, RESTRAINTS, OPPORTUNITIES, AND CHALLENGES: SECURE MULTIPARTY COMPUTATION MARKET
           5.2.1 DRIVERS
                    5.2.1.1 Demand for private key security with SMPC
                    5.2.1.2 Data privacy regulations compliance
           5.2.2 RESTRAINTS
                    5.2.2.1 Increased computational time
                    5.2.2.2 High communication costs involved in key decentralization (or distribution)
           5.2.3 OPPORTUNITIES
                    5.2.3.1 Adoption of AI and ML
                    5.2.3.2 Integration with cloud computing platforms
           5.2.4 CHALLENGES
                    5.2.4.1 Limited industry awareness
                    5.2.4.2 Lack of skilled professionals in SMPC technology
    5.3 VALUE CHAIN ANALYSIS 
           FIGURE 15 SECURE MULTIPARTY COMPUTATION MARKET: VALUE CHAIN ANALYSIS
           5.3.1 RESEARCH AND DEVELOPMENT
           5.3.2 PLANNING AND DESIGNING
           5.3.3 TESTING AND QUALITY ASSURANCE
           5.3.4 SYSTEM INTEGRATION
           5.3.5 DISTRIBUTORS/RESELLERS
           5.3.6 END USERS
    5.4 ECOSYSTEM 
           FIGURE 16 SECURE MULTIPARTY COMPUTATION MARKET: ECOSYSTEM
           TABLE 5 MARKET: ECOSYSTEM
    5.5 PORTER’S FIVE FORCES ANALYSIS 
           FIGURE 17 PORTER’S FIVE FORCES ANALYSIS: MARKET
           TABLE 6 PORTER’S FIVE FORCES IMPACT ON MARKET
           5.5.1 THREAT OF NEW ENTRANTS
           5.5.2 THREAT OF SUBSTITUTES
           5.5.3 BARGAINING POWER OF SUPPLIERS
           5.5.4 BARGAINING POWER OF BUYERS
           5.5.5 INTENSITY OF COMPETITIVE RIVALRY
    5.6 PRICING ANALYSIS 
           5.6.1 AVERAGE SELLING PRICE TREND OF MARKET PLAYERS, BY SOLUTION
                    FIGURE 18 AVERAGE SELLING PRICE TREND OF MARKET PLAYERS, BY SOLUTION
                    TABLE 7 AVERAGE SELLING PRICE TREND OF MARKET PLAYERS, BY SOLUTION
           5.6.2 INDICATIVE PRICING ANALYSIS, BY VENDOR
                    TABLE 8 PRICING MODEL OF GOOGLE CONFIDENTIAL COMPUTING
    5.7 TECHNOLOGY ANALYSIS 
           5.7.1 KEY TECHNOLOGIES
                    5.7.1.1 Cryptography
           5.7.2 COMPLEMENTARY TECHNOLOGIES
                    5.7.2.1 Cloud Computing
                    5.7.2.2 AI and ML
           5.7.3 ADJACENT TECHNOLOGIES
                    5.7.3.1 Blockchain
    5.8 PATENT ANALYSIS 
           FIGURE 19 NUMBER OF PATENTS GRANTED FOR SECURE MULTIPARTY COMPUTATION MARKET, 2014–2024
           FIGURE 20 REGIONAL ANALYSIS OF PATENTS GRANTED FOR MARKET
           5.8.1 LIST OF TOP PATENTS IN MARKET, 2023–2024
    5.9 TRENDS AND DISRUPTIONS IMPACTING CUSTOMERS’ BUSINESSES 
           FIGURE 21 REVENUE SHIFT FOR MARKET VENDORS
    5.1 KEY STAKEHOLDERS & BUYING CRITERIA 
           5.10.1 KEY STAKEHOLDERS IN BUYING PROCESS
                    FIGURE 22 INFLUENCE OF STAKEHOLDERS ON BUYING PROCESS FOR TOP THREE VERTICALS
                    TABLE 9 INFLUENCE OF STAKEHOLDERS ON BUYING PROCESS FOR TOP THREE VERTICALS
           5.10.2 BUYING CRITERIA
                    FIGURE 23 KEY BUYING CRITERIA FOR TOP THREE VERTICALS
                    TABLE 10 KEY BUYING CRITERIA FOR TOP THREE VERTICALS
    5.11 REGULATORY LANDSCAPE 
           5.11.1 HEALTH INSURANCE PORTABILITY AND ACCOUNTABILITY ACT (HIPPA)
           5.11.2 FEDERAL TRADE COMMISSION (FTC)
           5.11.3 GRAMM-LEACH-BLILEY ACT (GLBA)
           5.11.4 REGULATORY BODIES, GOVERNMENT AGENCIES, AND OTHER ORGANIZATIONS
                    TABLE 11 NORTH AMERICA: LIST OF REGULATORY BODIES, GOVERNMENT AGENCIES, AND OTHER ORGANIZATIONS
                    TABLE 12 EUROPE: LIST OF REGULATORY BODIES, GOVERNMENT AGENCIES, AND OTHER ORGANIZATIONS
                    TABLE 13 ASIA PACIFIC: LIST OF REGULATORY BODIES, GOVERNMENT AGENCIES, AND OTHER ORGANIZATIONS
                    TABLE 14 ROW: LIST OF REGULATORY BODIES, GOVERNMENT AGENCIES, AND OTHER ORGANIZATIONS
    5.12 KEY CONFERENCES & EVENTS IN 2024–2025 
                    TABLE 15 SECURE MULTIPARTY COMPUTATION MARKET: DETAILED LIST OF CONFERENCES & EVENTS
    5.13 BUSINESS MODEL ANALYSIS 
                    TABLE 16 BUSINESS MODEL
    5.14 INVESTMENT LANDSCAPE 
                    FIGURE 24 LEADING GLOBAL SECURE MULTIPARTY COMPUTATION STARTUPS AND SMES, BY NUMBER OF INVESTORS AND FUNDING ROUNDS, 2023
 
6 SECURE MULTIPARTY COMPUTATION MARKET, BY OFFERING (Page No. - 60)
    6.1 INTRODUCTION 
           FIGURE 25 SOLUTIONS TO GROW AT HIGHER CAGR DURING FORECAST PERIOD
           6.1.1 OFFERING: SECURE MULTIPARTY COMPUTATION MARKET DRIVERS
                    TABLE 17 MARKET, BY OFFERING, 2018–2023 (USD MILLION)
                    TABLE 18 MARKET, BY OFFERING, 2024–2029 (USD MILLION)
    6.2 SOLUTIONS 
           6.2.1 NEED FOR ENHANCED DATA PRIVACY AND SECURE COLLABORATION TO DRIVE SMPC ADOPTION
                    TABLE 19 SOLUTIONS: MARKET, BY REGION, 2018–2023 (USD MILLION)
                    TABLE 20 SOLUTIONS: MARKET, BY REGION, 2024–2029 (USD MILLION)
    6.3 SERVICES 
           6.3.1 SERVICES TO FURNISH NECESSARY TOOLS AND RESOURCES FOR CONSTRUCTING CUSTOM SMPC SOLUTIONS
                    TABLE 21 SERVICES: MARKET, BY REGION, 2018–2023 (USD MILLION)
                    TABLE 22 SERVICES: MARKET, BY REGION, 2024–2029 (USD MILLION)
7 SECURE MULTIPARTY COMPUTATION MARKET, BY DEPLOYMENT MODE (Page No. - 65)
    7.1 INTRODUCTION 
           FIGURE 26 CLOUD SEGMENT TO ACCOUNT FOR LARGEST MARKET BY 2029
           7.1.1 DEPLOYMENT MODE: MARKET DRIVERS
                    TABLE 23 MARKET, BY DEPLOYMENT MODE, 2018–2023 (USD MILLION)
                    TABLE 24 MARKET, BY DEPLOYMENT MODE, 2024–2029 (USD MILLION)
    7.2 CLOUD 
           7.2.1 CLOUD-BASED SMPC TO OFFER POWERFUL AND COST-EFFECTIVE SOLUTIONS FOR SECURE DATA COLLABORATION
                    TABLE 25 CLOUD: MARKET, BY REGION, 2018–2023 (USD MILLION)
                    TABLE 26 CLOUD: MARKET, BY REGION, 2024–2029 (USD MILLION)
    7.3 ON-PREMISES 
           7.3.1 ON-PREMISE SMPC TO OFFER MORE CONTROL AND SECURITY FOR SPECIFIC USE CASES
                    TABLE 27 ON-PREMISES: MARKET, BY REGION, 2018–2023 (USD MILLION)
                    TABLE 28 ON-PREMISES: MARKET, BY REGION, 2024–2029 (USD MILLION)
 
8 SECURE MULTIPARTY COMPUTATION MARKET, BY VERTICAL (Page No. - 70)
    8.1 INTRODUCTION 
           FIGURE 27 BFSI SEGMENT TO ACCOUNT FOR LARGEST MARKET DURING FORECAST PERIOD
           8.1.1 VERTICAL: MARKET DRIVERS
                    TABLE 29 MARKET, BY VERTICAL, 2018–2023 (USD MILLION)
                    TABLE 30 MARKET, BY VERTICAL, 2024–2029 (USD MILLION)
    8.2 BFSI 
           8.2.1 SMPC TECHNOLOGY TO ENHANCE BANKS' EXISTING PRACTICES FOR FRAUD DETECTION
                    TABLE 31 BFSI: MARKET, BY REGION, 2018–2023 (USD MILLION)
                    TABLE 32 BFSI: MARKET, BY REGION, 2024–2029 (USD MILLION)
    8.3 IT & ITES 
           8.3.1 SMPC TO EMPOWER ORGANIZATIONS TO PERFORM ANALYTICS SECURELY ON COMBINED DATASETS FROM MULTIPLE CLIENTS
                    TABLE 33 IT & ITES: MARKET, BY REGION, 2018–2023 (USD MILLION)
                    TABLE 34 IT & ITES: MARKET, BY REGION, 2024–2029 (USD MILLION)
    8.4 GOVERNMENT 
           8.4.1 SMPC TO BE USED IN GOVERNMENT POLICYMAKING BY ENABLING SECURE AND CONFIDENTIAL ANALYSIS OF SENSITIVE DATA
                    TABLE 35 GOVERNMENT: MARKET, BY REGION, 2018–2023 (USD MILLION)
                    TABLE 36 GOVERNMENT: MARKET, BY REGION, 2024–2029 (USD MILLION)
    8.5 HEALTHCARE 
           8.5.1 NEED FOR INTEGRATION IN HEALTHCARE VERTICAL TO DRIVE MARKET GROWTH
                    TABLE 37 HEALTHCARE: SECURE MULTIPARTY COMPUTATION MARKET, BY REGION, 2018–2023 (USD MILLION)
                    TABLE 38 HEALTHCARE: MARKET, BY REGION, 2024–2029 (USD MILLION)
    8.6 RETAIL & E-COMMERCE 
           8.6.1 SMPC TO PROTECT CONSUMER PRIVACY WHILE PROMOTING INNOVATION IN TARGETED MARKETING CAMPAIGNS AND PRODUCT DEVELOPMENT
                    TABLE 39 RETAIL & E-COMMERCE: MARKET, BY REGION, 2018–2023 (USD MILLION)
                    TABLE 40 RETAIL & E-COMMERCE: MARKET, BY REGION, 2024–2029 (USD MILLION)
 
9 SECURE MULTIPARTY COMPUTATION MARKET, BY REGION (Page No. - 79)
    9.1 INTRODUCTION 
           FIGURE 28 ASIA PACIFIC TO GROW AT HIGHEST CAGR DURING FORECAST PERIOD
           TABLE 41 SECURE MULTIPARTY COMPUTATION MARKET, BY REGION, 2018–2023 (USD MILLION)
           TABLE 42 MARKET, BY REGION, 2024–2029 (USD MILLION)
    9.2 NORTH AMERICA 
           9.2.1 NORTH AMERICA: MARKET DRIVERS
                    FIGURE 29 NORTH AMERICA: SECURE MULTIPARTY COMPUTATION MARKET SNAPSHOT
                    TABLE 43 NORTH AMERICA: MARKET, BY OFFERING, 2018–2023 (USD MILLION)
                    TABLE 44 NORTH AMERICA: MARKET, BY OFFERING, 2024–2029 (USD MILLION)
                    TABLE 45 NORTH AMERICA: MARKET, BY DEPLOYMENT MODE, 2018–2023 (USD MILLION)
                    TABLE 46 NORTH AMERICA: MARKET, BY DEPLOYMENT MODE, 2024–2029 (USD MILLION)
                    TABLE 47 NORTH AMERICA: MARKET, BY VERTICAL, 2018–2023 (USD MILLION)
                    TABLE 48 NORTH AMERICA: MARKET, BY VERTICAL, 2024–2029 (USD MILLION)
           9.2.2 US
                    9.2.2.1 Presence of several SMPC providers in US to drive market
           9.2.3 CANADA
                    9.2.3.1 Rising cyber threats to drive adoption of SMPC solutions in US
    9.3 EUROPE 
           9.3.1 EUROPE: MARKET DRIVERS
                    TABLE 49 EUROPE: SECURE MULTIPARTY COMPUTATION MARKET, BY OFFERING, 2018–2023 (USD MILLION)
                    TABLE 50 EUROPE: MARKET, BY OFFERING, 2024–2029 (USD MILLION)
                    TABLE 51 EUROPE: MARKET, BY DEPLOYMENT MODE, 2018–2023 (USD MILLION)
                    TABLE 52 EUROPE: MARKET, BY DEPLOYMENT MODE, 2024–2029 (USD MILLION)
                    TABLE 53 EUROPE: MARKET, BY VERTICAL, 2018–2023 (USD MILLION)
                    TABLE 54 EUROPE: SECURE MULTIPARTY COMPUTATION MARKET, BY VERTICAL, 2024–2029 (USD MILLION)
           9.3.2 UK
                    9.3.2.1 Organizations recognizing importance of data privacy, security, and compliance to drive market growth
           9.3.3 GERMANY
                    9.3.3.1 Increasing digitalization to fuel growth of secure computing technologies
           9.3.4 ITALY
                    9.3.4.1 Various universities and companies focusing on SMPC research to drive market growth
           9.3.5 REST OF EUROPE
    9.4 ASIA PACIFIC 
           9.4.1 ASIA PACIFIC: MARKET DRIVERS
                    FIGURE 30 ASIA PACIFIC: SECURE MULTIPARTY COMPUTATION MARKET SNAPSHOT
                    TABLE 55 ASIA PACIFIC: MARKET, BY OFFERING, 2018–2023 (USD MILLION)
                    TABLE 56 ASIA PACIFIC: MARKET, BY OFFERING, 2024–2029 (USD MILLION)
                    TABLE 57 ASIA PACIFIC: MARKET, BY DEPLOYMENT MODE, 2018–2023 (USD MILLION)
                    TABLE 58 ASIA PACIFIC: MARKET, BY DEPLOYMENT MODE, 2024–2029 (USD MILLION)
                    TABLE 59 ASIA PACIFIC: MARKET, BY VERTICAL, 2018–2023 (USD MILLION)
                    TABLE 60 ASIA PACIFIC: SECURE MULTIPARTY COMPUTATION MARKET, BY VERTICAL, 2024–2029 (USD MILLION)
           9.4.2 CHINA
                    9.4.2.1 Rapid digitalization of various industries to fuel market growth
           9.4.3 JAPAN
                    9.4.3.1 Criticality of maintaining confidentiality of shared data to drive demand for SMPC solutions
           9.4.4 INDIA
                    9.4.4.1 Advancements in cryptographic research and computational power to make SMPC more practical and efficient
           9.4.5 REST OF ASIA PACIFIC
    9.5 REST OF THE WORLD (ROW) 
           9.5.1 ROW: MARKET DRIVERS
                    TABLE 61 ROW: SECURE MULTIPARTY COMPUTATION MARKET, BY OFFERING, 2018–2023 (USD MILLION)
                    TABLE 62 ROW: MARKET, BY OFFERING, 2024–2029 (USD MILLION)
                    TABLE 63 ROW: MARKET, BY DEPLOYMENT MODE, 2018–2023 (USD MILLION)
                    TABLE 64 ROW: MARKET, BY DEPLOYMENT MODE, 2024–2029 (USD MILLION)
                    TABLE 65 ROW: MARKET, BY VERTICAL, 2018–2023 (USD MILLION)
                    TABLE 66 ROW: MARKET, BY VERTICAL, 2024–2029 (USD MILLION)
 
10 COMPETITIVE LANDSCAPE (Page No. - 96)
     10.1 KEY PLAYER STRATEGIES/RIGHT TO WIN 
     10.2 BRAND COMPARISON 
               FIGURE 31 SECURE MULTIPARTY COMPUTATION MARKET: COMPARISON OF VENDORS’ BRANDS
               10.3 COMPANY VALUATION AND FINANCIAL METRICS
               FIGURE 32 MARKET: COMPANY VALUATION AND FINANCIAL METRICS
     10.4 REVENUE ANALYSIS 
               FIGURE 33 SEGMENTAL REVENUE ANALYSIS OF KEY MARKET PLAYERS, 2020–2023 (USD MILLION)
     10.5 MARKET SHARE ANALYSIS 
               FIGURE 34 SHARE OF LEADING COMPANIES IN MARKET
               TABLE 67 SECURE MULTIPARTY COMPUTATION MARKET: DEGREE OF COMPETITION
               FIGURE 35 RANKING OF KEY PLAYERS
     10.6 COMPANY EVALUATION MATRIX, 2023 
             10.6.1 STARS
             10.6.2 EMERGING LEADERS
             10.6.3 PERVASIVE PLAYERS
             10.6.4 PARTICIPANTS
                       FIGURE 36 COMPANY EVALUATION MATRIX, 2023
             10.6.5 COMPANY FOOTPRINT
                       10.6.5.1 Company footprint
                                   FIGURE 37 SECURE MULTIPARTY COMPUTATION MARKET: COMPANY FOOTPRINT
                       10.6.5.2 Regional footprint
                                   TABLE 68 MARKET: REGIONAL FOOTPRINT
                       10.6.5.3 Offering footprint
                                   TABLE 69 MARKET: OFFERING FOOTPRINT
                       10.6.5.4 Deployment mode footprint
                                   TABLE 70 MARKET: DEPLOYMENT MODE FOOTPRINT
                       10.6.5.5 Vertical footprint
                                   TABLE 71 MARKET: VERTICAL FOOTPRINT
     10.7 COMPETITIVE SCENARIO 
             10.7.1 PRODUCT LAUNCHES
                       TABLE 72 SECURE MULTIPARTY COMPUTATION MARKET: PRODUCT LAUNCHES, JANUARY 2021–MAY 2024
             10.7.2 DEALS
                       TABLE 73 SECURE MULTIPARTY COMPUTATION MARKET: DEALS, JANUARY 2021–MAY 2024
 
11 COMPANY PROFILES (Page No. - 110)
     11.1 KEY PLAYERS 
(Business Overview, Products/Solutions/Services offered, Recent Developments, MnM View)*
             11.1.1 MICROSOFT
                       TABLE 74 MICROSOFT: COMPANY OVERVIEW
                                   FIGURE 38 MICROSOFT: COMPANY SNAPSHOT
                                   TABLE 75 MICROSOFT: PRODUCTS/SOLUTIONS/SERVICES OFFERED
             11.1.2 IBM
                       TABLE 76 IBM: COMPANY OVERVIEW
                       FIGURE 39 IBM: COMPANY SNAPSHOT
                       TABLE 77 IBM: PRODUCTS/SOLUTIONS/SERVICES OFFERED
             11.1.3 GOOGLE
                       TABLE 78 GOOGLE: COMPANY OVERVIEW
                       FIGURE 40 GOOGLE: COMPANY SNAPSHOT
                       TABLE 79 GOOGLE: PRODUCTS/SOLUTIONS/SERVICES OFFERED
                       TABLE 80 GOOGLE: PRODUCT LAUNCHES
             11.1.4 FIREBLOCKS
                       TABLE 81 FIREBLOCKS: COMPANY OVERVIEW
                       TABLE 82 FIREBLOCKS: PRODUCTS/SOLUTIONS/SERVICES OFFERED
             11.1.5 BLOCKDAEMON
                       TABLE 83 BLOCKDAEMON: COMPANY OVERVIEW
                       TABLE 84 BLOCKDAEMON: PRODUCTS/SOLUTIONS/SERVICES OFFERED
                       TABLE 85 BLOCKDAEMON: DEALS
             11.1.6 QREDO
                       TABLE 86 QREDO: COMPANY OVERVIEW
                       TABLE 87 QREDO: PRODUCTS/SOLUTIONS/SERVICES OFFERED
                       TABLE 88 QREDO: DEALS
             11.1.7 PENTA SECURITY
                       TABLE 89 PENTA SECURITY: COMPANY OVERVIEW
                       TABLE 90 PENTA SECURITY: PRODUCTS/SOLUTIONS/SERVICES OFFERED
             11.1.8 ZENGO
                       TABLE 91 ZENGO: COMPANY OVERVIEW
                       TABLE 92 ZENGO: PRODUCTS/SOLUTIONS/SERVICES OFFERED
                       TABLE 93 ZENGO: DEALS
             11.1.9 INPHER
                       TABLE 94 INPHER: BUSINESS OVERVIEW
                       TABLE 95 INPHER: PRODUCTS/SOLUTIONS/SERVICES OFFERED
             11.1.10 CYBAVO
                                   TABLE 96 CYBAVO: COMPANY OVERVIEW
                                   TABLE 97 CYBAVO: PRODUCTS/SOLUTIONS/SERVICES OFFERED
                                   TABLE 98 CYBAVO: DEALS
             11.1.11 LIMINAL CUSTODY
             11.1.12 SPATIUM
             11.1.13 SILENCE LABORATORIES
             11.1.14 KRAYON DIGITAL
             11.1.15 ATATO
             11.1.16 WEB3AUTH
             11.1.17 PARTISIA BLOCKCHAIN
             11.1.18 OROCHI NETWORK
             11.1.19 BINANCE
             11.1.20 PYTE
             11.1.21 ROSEMAN LABS
             11.1.22 MPCVAULT
             11.1.23 DUOKEY
             11.1.24 LINKSIGHT
             11.1.25 HYPERBC
*Details on Business Overview, Products/Solutions/Services offered, Recent Developments, MnM View might not be captured in case of unlisted companies.
 
12 ADJACENT MARKETS (Page No. - 144)
     12.1 INTRODUCTION 
               TABLE 99 ADJACENT MARKETS AND FORECASTS
     12.2 LIMITATIONS 
     12.3 CONFIDENTIAL COMPUTING MARKET 
               TABLE 100 CONFIDENTIAL COMPUTING MARKET, BY COMPONENT, 2019–2022 (USD MILLION)
               TABLE 101 CONFIDENTIAL COMPUTING MARKET, BY COMPONENT, 2023–2028 (USD MILLION)
               TABLE 102 CONFIDENTIAL COMPUTING MARKET, BY REGION, 2019–2022 (USD MILLION)
               TABLE 103 CONFIDENTIAL COMPUTING MARKET, BY REGION, 2023–2028 (USD MILLION)
     12.4 QUANTUM CRYPTOGRAPHY MARKET 
               TABLE 104 QUANTUM CRYPTOGRAPHY MARKET, BY OFFERING, 2017–2022 (USD MILLION)
               TABLE 105 QUANTUM CRYPTOGRAPHY MARKET, BY OFFERING, 2023–2028 (USD MILLION)
               TABLE 106 QUANTUM CRYPTOGRAPHY MARKET, BY REGION, 2017–2022 (USD MILLION)
               TABLE 107 QUANTUM CRYPTOGRAPHY MARKET, BY REGION, 2023–2028 (USD MILLION)
 
13 APPENDIX (Page No. - 148)
     13.1 DISCUSSION GUIDE 
     13.2 KNOWLEDGESTORE: MARKETSANDMARKETS’ SUBSCRIPTION PORTAL 
     13.3 CUSTOMIZATION OPTIONS 
     13.4 RELATED REPORTS 
     13.5 AUTHOR DETAILS 

The study involved major activities in estimating the current market size for the secure multiparty computation market. Exhaustive secondary research was done to collect information on the secure multiparty computation industry. The next step was to validate these findings, assumptions, and sizing with industry experts across the value chain using primary research. Different approaches, such as top-down and bottom-up, were employed to estimate the total market size. After that, the market breakup and data triangulation procedures were used to estimate the market size of the segments and subsegments of the secure multiparty computation market.

Secondary Research

The market for the companies offering secure multiparty computation solutions and services is arrived at by secondary data available through paid and unpaid sources, analyzing the product portfolios of the major companies in the ecosystem, and rating the companies by their performance and quality. Various sources were referred to in the secondary research process to identify and collect information for this study. The secondary sources include annual reports, press releases, investor presentations of companies, white papers, journals, certified publications, and articles from recognized authors, directories, and databases.

In the secondary research process, various secondary sources were referred to for identifying and collecting information related to the study. Secondary sources included annual reports, press releases, and investor presentations of secure multiparty computation vendors, forums, certified publications, and whitepapers. The secondary research was used to obtain critical information on the industry’s value chain, the total pool of key players, market classification, and segmentation from the market and technology-oriented perspectives.

Primary Research

In the primary research process, various primary sources from both the supply and demand sides were interviewed to obtain qualitative and quantitative information for this report. The primary sources from the supply side included industry experts, such as Chief Executive Officers (CEOs), Vice Presidents (VPs), marketing directors, technology and innovation directors, and related key executives from various key companies and organizations operating in the secure multiparty computation market.

After the complete market engineering (calculations for market statistics, market breakdown, market size estimations, market forecasting, and data triangulation), extensive primary research was conducted to gather information and verify and validate the critical numbers arrived at. Primary research was also conducted to identify the segmentation types, industry trends, competitive landscape of secure multiparty computation solutions offered by various market players, and key market dynamics, such as drivers, restraints, opportunities, challenges, industry trends, and key player strategies.

In the complete market engineering process, the top-down and bottom-up approaches were extensively used, along with several data triangulation methods, to perform the market estimation and market forecasting for the overall market segments and subsegments listed in this report. Extensive qualitative and quantitative analysis was performed on the complete market engineering process to list the key information/insights throughout the report.

Following is the breakup of the primary study:
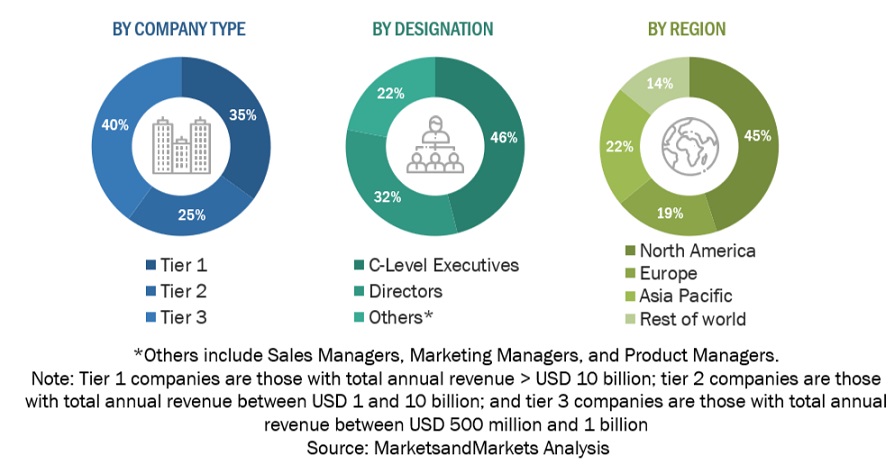
Secure Multiparty Computation (SMPC)  Market Size, and Share

To know about the assumptions considered for the study, download the pdf brochure

Market Size Estimation

Top-down and bottom-up approaches were used to estimate and validate the size of the global secure multiparty computation market and estimate the size of various other dependent sub-segments in the overall secure multiparty computation market. The research methodology used to estimate the market size includes the following details: key players in the market were identified through secondary research, and their market shares in the respective regions were determined through primary and secondary research. This entire procedure included the study of the annual and financial reports of the top market players, and extensive interviews were conducted for key insights from the industry leaders, such as CEOs, VPs, directors, and marketing executives.

All percentage splits and breakdowns were determined using secondary sources and verified through primary sources. All possible parameters that affect the market covered in this research study have been accounted for, viewed in extensive detail, verified through primary research, and analyzed to get the final quantitative and qualitative data. This data is consolidated and added to detailed inputs and analysis from MarketsandMarkets.

Infographic Depicting Market Size Estimation Methodology - Approaches
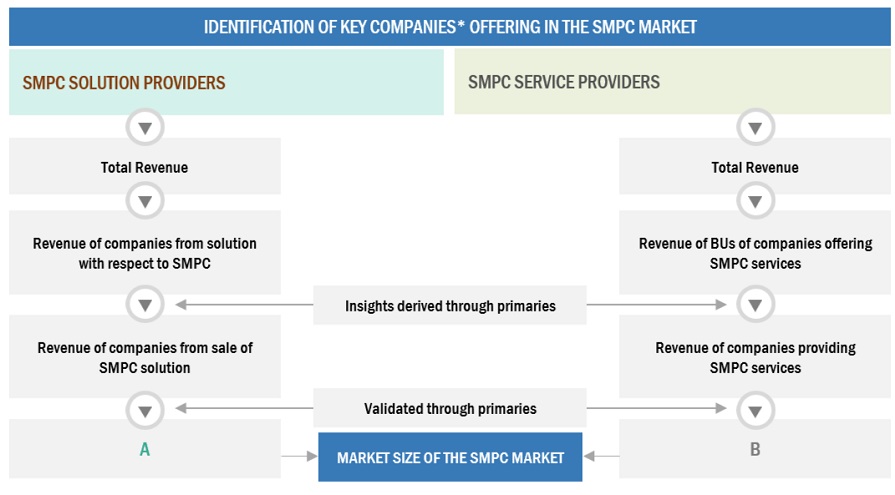
Secure Multiparty Computation (SMPC) Market Size Estimation

To know about the assumptions considered for the study, Request for Free Sample Report

Data Triangulation

After arriving at the overall market size using the market size estimation processes explained above, the market was split into several segments and subsegments. The data triangulation and market breakup procedures were employed, wherever applicable, to complete the overall market engineering process and arrive at the exact statistics of each market segment and subsegment. The data was triangulated by studying various factors and trends from both the demand and supply sides.

Market Definition

Secure Multi-Party Computation (SMPC) is a cryptographic technique that allows several parties to jointly perform a computation using their private inputs. SMPC allows several parties, each with their own confidential data, to jointly perform a computation in such a way that none of them disclose their private data or any other related confidential information.

Key Stakeholders

  • Government agencies
  • SMPC vendors
  • Independent solution vendors
  • Consulting firms
  • System integrators
  • Value-Added Resellers (VARs)
  • Information Technology (IT) security agencies
  • Managed Security Service Providers (MSSPs)
  • Raw material/component suppliers
  • Research organizations and consulting companies
  • Government bodies, such as regulating authorities and policymakers
  • Venture capitalists and private equity firms

Report Objectives

  • To define, describe, and forecast the secure multiparty computation market based on - offering,  deployment mode, vertical, and region.
  • To define, describe, and forecast the SMPC market by offering, deployment mode, vertical, and region
  • To provide detailed information about the major factors (drivers, restraints, opportunities, and challenges) influencing the market growth
  • To analyze the opportunities for stakeholders by identifying the high-growth segments of the SMPC market
  • To forecast the market size of the segments with respect to five main regions: North America, Europe, Asia Pacific (APAC), and Rest of World
  • To analyze subsegments of the market with respect to individual growth trends, prospects, and contributions to the overall market
  • To profile the key players of the SMPC market and comprehensively analyze their market size and core competencies
  • To track and analyze the competitive developments, such as product enhancements and new product launches, acquisitions, and partnerships and collaborations in the SMPC market globally

Customization Options

With the given market data, MarketsandMarkets offers customizations based on company-specific needs. The following customization options are available for the report:

Company Information

  • Detailed analysis and profiling of additional market players (up to 5)
Custom Market Research Services

We will customize the research for you, in case the report listed above does not meet with your exact requirements. Our custom research will comprehensively cover the business information you require to help you arrive at strategic and profitable business decisions.

Request Customization
Report Code
TC 9038
Published ON
Jun, 2024
Choose License Type
BUY NOW
  • SHARE
X
Request Customization
Speak to Analyst
Speak to Analyst
OR FACE-TO-FACE MEETING
PERSONALIZE THIS RESEARCH
  • Triangulate with your Own Data
  • Get Data as per your Format and Definition
  • Gain a Deeper Dive on a Specific Application, Geography, Customer or Competitor
  • Any level of Personalization
REQUEST A FREE CUSTOMIZATION
LET US HELP YOU!
  • What are the Known and Unknown Adjacencies Impacting the Secure Multiparty Computation (SMPC) Market
  • What will your New Revenue Sources be?
  • Who will be your Top Customer; what will make them switch?
  • Defend your Market Share or Win Competitors
  • Get a Scorecard for Target Partners
CUSTOMIZED WORKSHOP REQUEST
  • Call Us
  • +1-888-600-6441 (Corporate office hours)
  • +1-888-600-6441 (US/Can toll free)
  • +44-800-368-9399 (UK office hours)
CONNECT WITH US
ABOUT TRUST ONLINE
©2024 MarketsandMarkets Research Private Ltd. All rights reserved
DMCA.com Protection Status
Website Feedback