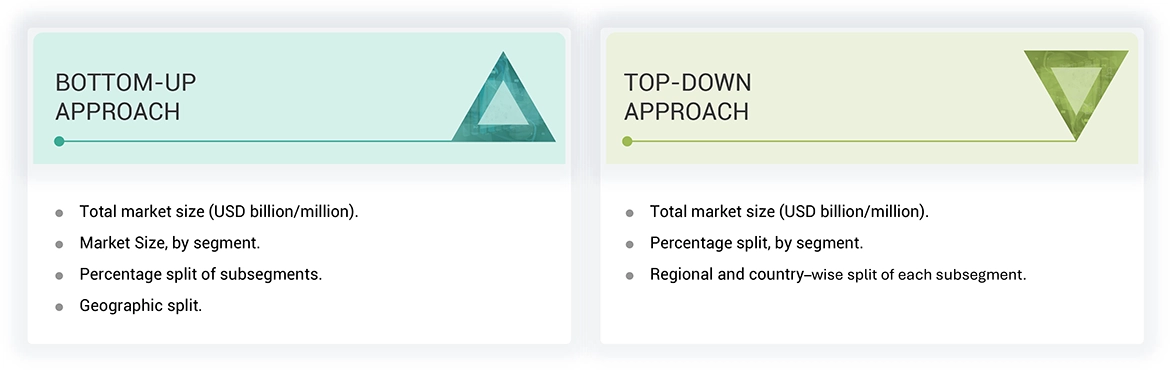
The study involved major activities in estimating the current market size for the steam trap market. Exhaustive secondary research was done to collect information on the steam trap industry. The next step was to validate these findings, assumptions, and sizing with industry experts across the value chain using primary research. Different approaches, such as top-down and bottom-up, were employed to estimate the total market size. After that, the market breakup and data triangulation procedures were used to estimate the market size of the segments and subsegments of the steam trap market.
Secondary Research
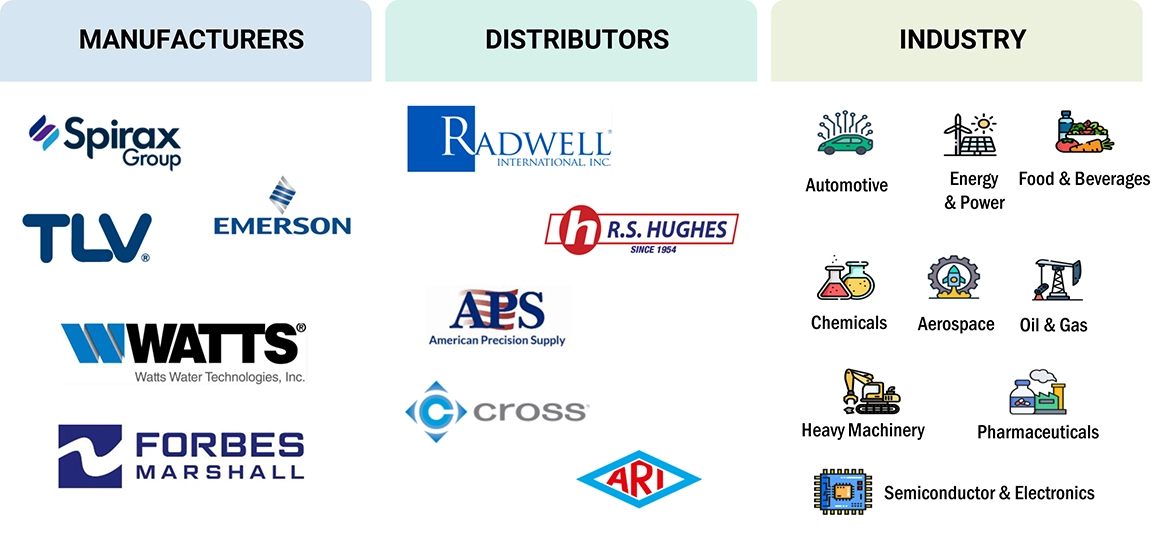
The market for the companies offering steam trap is arrived at by secondary data available through paid and unpaid sources, analyzing the product portfolios of the major companies in the ecosystem, and rating the companies by their performance and quality. Various sources were referred to in the secondary research process to identify and collect information for this study. The secondary sources include annual reports, press releases, investor presentations of companies, white papers, journals, certified publications, and articles from recognized authors, directories, and databases. In the secondary research process, various secondary sources were referred to for identifying and collecting information related to the study. Secondary sources included annual reports, press releases, and investor presentations of vendors, forums, certified publications, and whitepapers. The secondary research was used to obtain critical information on the industry's value chain, the total pool of key players, market classification, and segmentation from the market and technology-oriented perspectives.
Primary Research
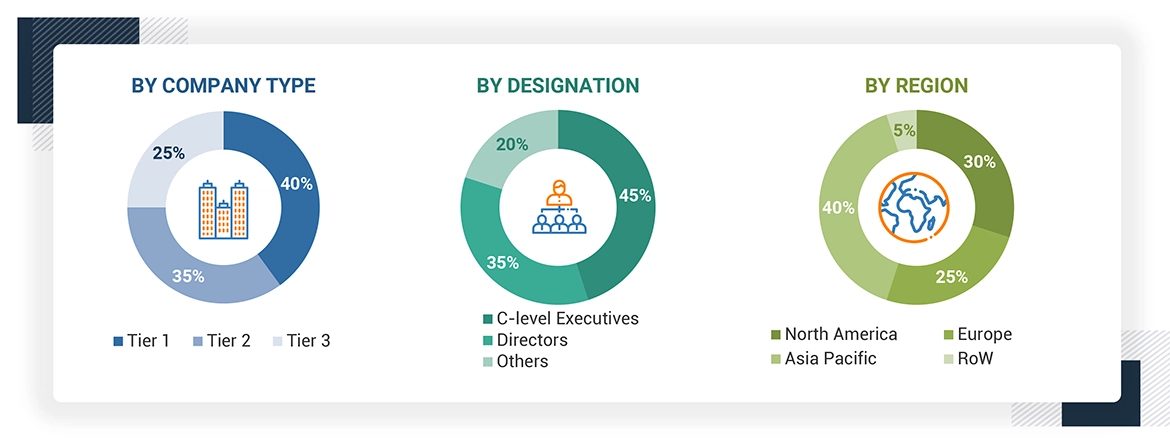
Extensive primary research has been conducted after understanding and analyzing the current scenario of the steam trap market through secondary research. Several primary interviews have been conducted with the key opinion leaders from the demand and supply sides across four main regions—North America, Europe, Asia Pacific, and the Rest of Europe. Approximately 30% of the primary interviews were conducted with the demand-side respondents, while approximately 70% were conducted with the supply-side respondents. The primary data has been collected through questionnaires, emails, and telephone interviews.
After interacting with industry experts, brief sessions were conducted with highly experienced independent consultants to reinforce the findings from our primary. This, along with the in-house subject matter experts’ opinions, has led us to the findings as described in the remainder of this report. The breakdown of primary respondents is as follows:
About the assumptions considered for the study, To know download the pdf brochure


 HIGHEST CAGR MARKET IN 2024
 INDIA FASTEST-GROWING MARKET IN THE REGION
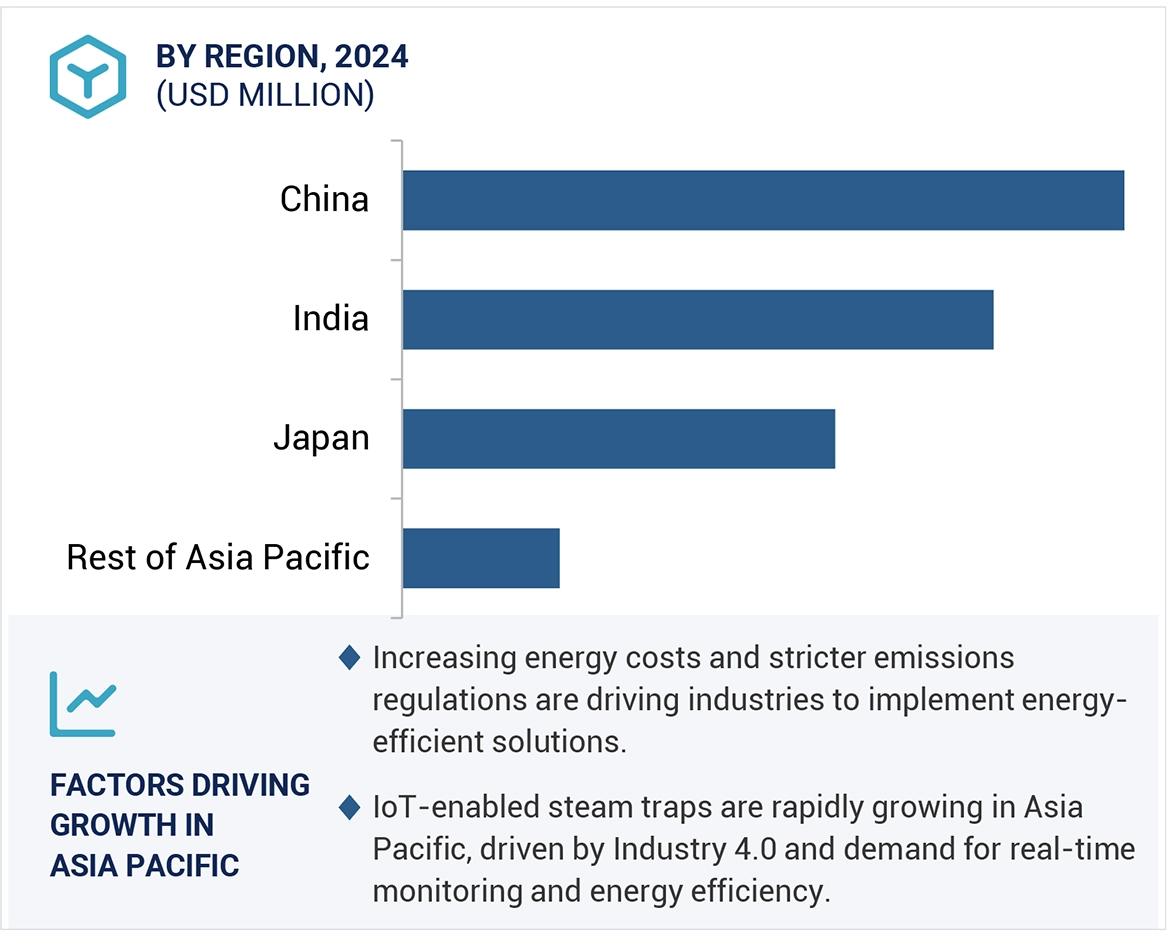


Growth opportunities and latent adjacency in Steam Trap Market