Synthetic Latex Polymers Market

Synthetic Latex Polymers Market by Type (Styrene Acrylic, Acrylic, Styrene Butadiene, Vinyl Acetate Ethylene, Polyvinyl Acetate, Vinyl Acetate Copolymer), Application (Paints & Coatings, Adhesives & Sealants, Nonwovens), & Region - Global Forecast to 2029

Report Code: CH 5909 May, 2024, by marketsandmarkets.com

Updated on : June 11, 2024

Synthetic Latex Polymers Market

The global synthetic latex polymers market is valued at USD 40.6 billion in 2024 and is projected to reach USD 53.2 billion by 2029, growing at 5.5% cagr from 2024 to 2029. The synthetic latex polymers market is projected to grow significantly in the coming years. Synthetic latex polymers, often referred to as simply synthetic latex, are artificially produced materials composed of polymer particles dispersed in water. These polymers are created through a process called emulsion polymerization, where monomers such as styrene, butadiene, acrylic acid, vinyl acetate, or ethylene undergo polymerization in an aqueous medium with the aid of surfactants or colloids. This process results in the formation of stable latex emulsions containing polymer particles suspended in water.

Global Synthetic Latex Polymers Market Trend

Synthetic Latex Polymers Market

To know about the assumptions considered for the study, Request for Free Sample Report

Synthetic Latex Polymers Market

Synthetic Latex Polymers Market Dynamics

Driver: Increasing demand in the paints and coatings industry

The increasing demand for synthetic latex polymers in the paints and coatings industry is driven by their outstanding performance, environmental advantages, cost efficiency, and compliance with evolving market trends and regulatory standards. These polymers provide excellent durability, flexibility, and adhesion, resulting in long-lasting, high-quality finishes suitable for both interior and exterior uses. Their superior water resistance and low emissions of volatile organic compounds (VOCs) make them ideal for healthier indoor environments and adhering to strict environmental regulations. Furthermore, their non-toxic nature ensures safer options for both applicators and occupants.

Restraint: Volatility in raw materials prices

Volatility in raw material prices presents a significant restraint for the synthetic latex polymers market, impacting both producers and consumers across the supply chain. Petrochemicals serve as the primary raw materials for synthetic latex polymer production, and their prices are highly susceptible to fluctuations influenced by diverse factors including supply-demand dynamics, geopolitical tensions, and macroeconomic conditions. Sudden spikes or declines in raw material prices disrupt the cost structures of synthetic latex polymer manufacturers, introducing uncertainty into production planning and profitability projections. This unpredictability poses challenges for producers in passing on increased costs to consumers, particularly in fiercely competitive markets where price sensitivity is high, potentially compressing profit margins and hindering financial stability. Furthermore, the volatility in raw material prices can act as a deterrent to investments in capacity expansion or new product development initiatives, restraining industry growth and innovation.

Opportunity: Growing demand in the electronics industry

The growing demand in the electronic industries presents significant opportunities for the synthetic latex polymers market due to their versatile applications in electronic components, manufacturing processes, and device protection. Synthetic latex polymers offer several key advantages that align with the evolving needs of the electronics sector, including superior adhesion, insulation properties, and moisture resistance. These polymers are commonly used in the production of coatings, adhesives, and encapsulants for electronic devices, providing protection against moisture, dust, and mechanical stress. With the increasing complexity and miniaturization of electronic components, there is a rising demand for advanced materials that can offer precise control over properties such as thermal conductivity, dielectric strength, and chemical resistance.

Challenges: Fluctuating Crude Oil Prices

Fluctuating crude oil prices pose a significant challenge for the synthetic latex polymers market due to their reliance on petrochemical-derived raw materials. Synthetic latex polymers are primarily manufactured using petroleum-based feedstocks such as styrene, butadiene, and acrylate monomers, which are directly impacted by changes in crude oil prices. When crude oil prices experience sudden spikes or declines, it directly affects the cost structure of synthetic latex polymer production, creating uncertainty for manufacturers. Abrupt increases in crude oil prices lead to higher production costs for synthetic latex polymers, which can be challenging for producers to absorb or pass on to consumers, particularly in competitive markets where price sensitivity is high. On the other hand, sharp declines in crude oil prices may initially reduce raw material costs, but this may not translate into proportional savings for synthetic latex polymer manufacturers due to factors such as inventory management, contractual obligations, and market dynamics.

Synthetic Latex Polymers Market Ecosystem

Synthetic Latex Polymers Market Ecosystem

By type, styrene acrylic is the second fastest in the synthetic latex polymers market, in 2023.

Styrene acrylic synthetic latex polymers offer improved adhesion, durability, and resistance to water in coatings and adhesives, making them well-suited for the construction industry. Particularly in the paints & coatings sector, styrene acrylic latex is gaining prominence in building construction and roof coatings due to its versatility, heat sealability, salt stability, and water resistance. The styrene acrylic segment is projected to dominate the market in the coming years owing to the growing demand for weatherproof coatings.

By application, adhesives & sealants segment is the second fastest growing application in the synthetic latex polymers market, in 2023.

Synthetic latex polymers are primarily utilized in adhesives and sealants owing to their exceptional properties. Within the construction sector, synthetic latex polymers assume a pivotal role in enhancing the efficacy of adhesives and sealants by boosting adhesion, water resistance, and flexibility in cements and asphalts. This ensures the formation of sturdier and longer-lasting bonds. Moreover, the adaptability of synthetic latex polymers permits one- or two-sided application, in contrast to natural latex, which necessitates two-sided application consistently. This renders synthetic latex polymers more convenient and effective for adhesive and sealant applications.

Asia Pacific accounted for the largest market share in the synthetic latex polymers market, in terms of value.

The Asia-Pacific region, encompassing countries such as China, India, and Japan, is witnessing notable urbanization and construction advancement, driving substantial demand for synthetic latex polymers across diverse applications including paints & coatings, textiles, adhesives & sealants, and non-woven fabrics. Notably, key synthetic latex polymer producers such as BASF SE, Dow, Arkema Group, LG Chem, and KUMHO PETROCHEMICAL are concentrated in the Asia-Pacific, underscoring the region's prominence in the market. In Southeast Asia, countries such as Thailand, Malaysia, and Indonesia hold significant shares of synthetic latex polymers consumption, with specific variants such as acrylonitrile-butadiene (AB nitrile) and styrene acrylics commanding the market, affirming the region's robust position in the synthetic latex polymers sector.

Synthetic Latex Polymers Market by Region

To know about the assumptions considered for the study, download the pdf brochure

Synthetic Latex Polymers Market Players

Some of the key players operating in the synthetic latex polymers market include Arkema (France), Wacker Chemie AG (Germany), Synthomer PLC (UK), LG Chem (South Korea), Celanese (US), Trinseo (US), Dow (US), BASF SE (Germany), Apcotex (India), ARLANXEO (The Netherlands), H.B. Fuller (US), Asahi Kasei Corporation (Japan), The Lubrizol Corporation (US), and ZEON CORPORATION (Japan) among others.

These companies have adopted various organic as well as inorganic growth strategies between 2019 and 2024 to strengthen their positions in the market. The new product launch is the key growth strategy adopted by these leading players to enhance regional presence and develop product portfolios to meet the growing demand for synthetic latex polymers from emerging economies.

Synthetic Latex Polymers Market Report Scope

Report Metric

Details

Years considered for the study

2020-2029

Base Year

2023

Forecast period

2024–2029

Units considered

Units; Value (USD Million)

Segments

Type, Application, and Region

Regions

Asia Pacific, North America, Europe, Middle East & Africa, and South America

Companies

Arkema (France), Wacker Chemie AG (Germany), Synthomer PLC (UK), LG Chem (South Korea), Celanese (US), Trinseo (US), Dow (US), BASF SE (Germany), Apcotex (India), ARLANXEO (The Netherlands), H.B. Fuller (US), Asahi Kasei Corporation (Japan), The Lubrizol Corporation (US), and ZEON CORPORATION (Japan).

This report categorizes the global synthetic latex polymers market based on material, type, end-use industry, and region.

Based on the type:
  • Styrene Acrylic
  • Acrylic
  • Styrene Butadiene
  • Vinyl Acetate Ethylene
  • Polvinyl Acetate
  • Vinyl Acetate Copolymer
  • Other Types
Based on the application:
  • Paints & Coatings
  • Adhesives & Sealants
  • Nonwovens
  • Paper & Paperboard
  • Carpet
  • Other Application
Based on the region:
  • Asia Pacific
  • Europe
  • North America
  • South America
  • Middle East & Africa

Recent Developments

  • In March 2024, Trinseo launched LIGOS C 9484, a vinyl acrylic latex binder designed for architectural coatings. The product helped the company to deliver a strong hiding performance, leveling properties, and excellent washability. It makes coating applications extremely durable.
  • In July 2022, Arkema acquired Polimeros Especiales, a Mexico-based producer of waterborne resins for various applications. This acquisition is part of Arkema's strategy to expand its coating solutions segment in growing markets and low-volatile organic compound solutions.
  • In April 2024, Celanese has expanded its business by starting a new vinyl acetate ethylene (VAE) unit in Nanjing, China. The newly established VAE unit enhanced the capacity by 70 kt, empowering the acetyl chain segment to effectively meet the rising regional demand for both VAE and downstream RDP products in Asia.

Frequently Asked Questions (FAQ):

To speak to our analyst for a discussion on the above findings, click Speak to Analyst

TABLE OF CONTENTS
 
1 INTRODUCTION (Page No. - 29)
    1.1 STUDY OBJECTIVES 
    1.2 MARKET DEFINITION 
    1.3 STUDY SCOPE 
           1.3.1 MARKET SEGMENTATION
           1.3.2 INCLUSIONS & EXCLUSIONS
           1.3.3 REGIONS COVERED
           1.3.4 YEARS CONSIDERED
           1.3.5 CURRENCY CONSIDERED
           1.3.6 UNITS CONSIDERED
    1.4 STAKEHOLDERS 
    1.5 IMPACT OF RECESSION 
 
2 RESEARCH METHODOLOGY (Page No. - 33)
    2.1 RESEARCH DATA 
          FIGURE 1 SYNTHETIC LATEX POLYMERS MARKET: RESEARCH DESIGN
           2.1.1 SECONDARY DATA
                    2.1.1.1 Key data from secondary sources
           2.1.2 PRIMARY DATA
                    2.1.2.1 Key data from primary sources
                    2.1.2.2 Breakdown of interviews with experts
    2.2 MARKET SIZE ESTIMATION 
           2.2.1 BOTTOM-UP APPROACH
                    FIGURE 2 SYNTHETIC LATEX POLYMERS MARKET: BOTTOM-UP APPROACH
           2.2.2 TOP-DOWN APPROACH
                    FIGURE 3 SYNTHETIC LATEX POLYMERS MARKET: TOP-DOWN APPROACH
    2.3 FORECAST NUMBER CALCULATION 
          FIGURE 4 DEMAND-SIDE FORECAST PROJECTIONS
    2.4 DATA TRIANGULATION 
          FIGURE 5 SYNTHETIC LATEX POLYMERS MARKET: DATA TRIANGULATION
    2.5 FACTOR ANALYSIS 
    2.6 ASSUMPTIONS 
    2.7 LIMITATIONS & RISKS 
    2.8 IMPACT OF RECESSION 
 
3 EXECUTIVE SUMMARY (Page No. - 41)
    FIGURE 6 STYRENE ACRYLIC SEGMENT TO ACCOUNT FOR LARGEST SHARE OF SYNTHETIC LATEX POLYMERS MARKET
    FIGURE 7 ADHESIVES & SEALANTS TO BE LARGEST APPLICATION SEGMENT IN SYNTHETIC LATEX POLYMERS MARKET
    FIGURE 8 ASIA PACIFIC TO BE FASTEST-GROWING MARKET DURING FORECAST PERIOD
 
4 PREMIUM INSIGHTS (Page No. - 44)
    4.1 ATTRACTIVE OPPORTUNITIES FOR PLAYERS IN SYNTHETIC LATEX POLYMERS MARKET 
          FIGURE 9 ASIA PACIFIC MARKET TO WITNESS HIGH GROWTH DURING FORECAST PERIOD
    4.2 SYNTHETIC LATEX POLYMERS MARKET, BY TYPE 
          FIGURE 10 STYRENE ACRYLIC TYPE SEGMENT TO LEAD SYNTHETIC LATEX POLYMERS MARKET DURING FORECAST PERIOD
    4.3 SYNTHETIC LATEX POLYMERS MARKET, BY APPLICATION 
          FIGURE 11 PAINTS & COATINGS TO BE LARGEST APPLICATION DURING FORECAST PERIOD
    4.4 SYNTHETIC LATEX POLYMERS MARKET, BY COUNTRY 
          FIGURE 12 MARKET IN INDIA TO GROW AT HIGHEST CAGR DURING FORECAST PERIOD
 
5 MARKET OVERVIEW (Page No. - 46)
    5.1 INTRODUCTION 
    5.2 MARKET DYNAMICS 
          FIGURE 13 DRIVERS, RESTRAINTS, OPPORTUNITIES, AND CHALLENGES IN SYNTHETIC LATEX POLYMERS MARKET
           5.2.1 DRIVERS
                    5.2.1.1 Increasing demand from paints & coatings industry
                    5.2.1.2 Rapid urbanization and infrastructure projects in emerging economies
                    5.2.1.3 Stringent environmental regulations regarding VOC emissions
                    5.2.1.4 Rising demand for bio-based, eco-friendly, and biodegradable synthetic latex polymers
           5.2.2 RESTRAINTS
                    5.2.2.1 Volatility in raw material prices
                    5.2.2.2 Competition from natural latex and bio-based alternatives
           5.2.3 OPPORTUNITIES
                    5.2.3.1 Growing demand from electronics industry
                    5.2.3.2 Increasing focus on green building and sustainable practices
           5.2.4 CHALLENGES
                    5.2.4.1 Fluctuating crude oil prices
    5.3 PORTER’S FIVE FORCES ANALYSIS 
          FIGURE 14 PORTER’S FIVE FORCES ANALYSIS OF SYNTHETIC LATEX POLYMERS MARKET
           5.3.1 THREAT OF SUBSTITUTES
           5.3.2 BARGAINING POWER OF SUPPLIERS
           5.3.3 THREAT OF NEW ENTRANTS
           5.3.4 BARGAINING POWER OF BUYERS
           5.3.5 INTENSITY OF COMPETITIVE RIVALRY
                    TABLE 1 SYNTHETIC LATEX POLYMERS MARKET: PORTER’S FIVE FORCES ANALYSIS
    5.4 MACROECONOMIC INDICATORS 
           5.4.1 GLOBAL GDP TRENDS
                    TABLE 2 TRENDS OF PER CAPITA GDP, 2020–2023 (USD)
                    TABLE 3 GDP GROWTH ESTIMATE AND PROJECTION FOR KEY COUNTRIES, 2024–2027
 
6 INDUSTRY TRENDS (Page No. - 56)
    6.1 INTRODUCTION 
    6.2 SUPPLY CHAIN ANALYSIS 
          FIGURE 15 SYNTHETIC LATEX POLYMERS MARKET: VALUE CHAIN ANALYSIS
           6.2.1 RAW MATERIAL SOURCING
           6.2.2 MANUFACTURING
           6.2.3 DISTRIBUTION
           6.2.4 END USERS
                    TABLE 4 SYNTHETIC LATEX POLYMERS MARKET: VALUE CHAIN STAKEHOLDERS
    6.3 TRADE ANALYSIS 
           6.3.1 IMPORT SCENARIO
                    FIGURE 16 IMPORT OF SYNTHETIC LATEX POLYMERS, BY KEY COUNTRY, 2019–2023 (USD MILLION)
           6.3.2 EXPORT SCENARIO
                    FIGURE 17 EXPORT OF SYNTHETIC LATEX POLYMERS, BY KEY COUNTRY, 2019–2023 (USD MILLION)
    6.4 PRICING ANALYSIS 
           6.4.1 AVERAGE SELLING PRICE TREND, BY REGION
                    FIGURE 18 AVERAGE SELLING PRICE, BY REGION (USD/KG)
           6.4.2 AVERAGE SELLING PRICE, BY TYPE
                    FIGURE 19 AVERAGE SELLING PRICE, BY TYPE (USD/KG)
           6.4.3 AVERAGE SELLING PRICE TREND OF KEY PLAYERS, BY APPLICATION
                    FIGURE 20 AVERAGE SELLING PRICE, BY KEY MARKET PLAYERS (USD/KG)
    6.5 ECOSYSTEM ANALYSIS/MARKET MAP 
          FIGURE 21 SYNTHETIC LATEX POLYMERS MARKET: ECOSYSTEM
          TABLE 5 SYNTHETIC LATEX POLYMERS MARKET: ROLE IN ECOSYSTEM
    6.6 KEY CONFERENCES & EVENTS, 2024–2025 
          TABLE 6 SYNTHETIC LATEX POLYMERS MARKET: KEY CONFERENCES & EVENTS, 2024–2025
    6.7 PATENT ANALYSIS 
           6.7.1 METHODOLOGY
           6.7.2 PATENT TYPES
                    FIGURE 22 SYNTHETIC LATEX POLYMERS MARKET: GRANTED PATENTS
           6.7.3 PUBLICATION TRENDS IN LAST 12 YEARS
                    FIGURE 23 NUMBER OF PATENTS YEAR-WISE BETWEEN 2013 AND 2023
           6.7.4 INSIGHTS
           6.7.5 LEGAL STATUS OF PATENTS
           6.7.6 JURISDICTION ANALYSIS
                    FIGURE 24 TOP JURISDICTION, BY PATENT
           6.7.7 TOP APPLICANTS
                    FIGURE 25 TOP 10 PATENT APPLICANTS
                    TABLE 7 TOP 10 PATENT OWNERS DURING LAST TWELVE YEARS
    6.8 TECHNOLOGY ANALYSIS 
           6.8.1 SYNTHETIC POLYMER NANOCOMPOSITE LATEX
           6.8.2 CARBOXYLATED STYRENE BUTADIENE RUBBER LATEX
 
7 SYNTHETIC LATEX POLYMERS MARKET, BY TYPE (Page No. - 68)
    7.1 INTRODUCTION 
          FIGURE 26 STYRENE ACRYLICS TO BE LARGEST SEGMENT IN SYNTHETIC LATEX POLYMERS MARKET
          TABLE 8 SYNTHETIC LATEX POLYMERS MARKET, BY TYPE, 2020–2023 (KILOTON)
          TABLE 9 SYNTHETIC LATEX POLYMERS MARKET, BY TYPE, 2024–2029 (KILOTON)
          TABLE 10 SYNTHETIC LATEX POLYMERS MARKET, BY TYPE, 2020–2023 (USD MILLION)
          TABLE 11 SYNTHETIC LATEX POLYMERS MARKET, BY TYPE, 2024–2029 (USD MILLION)
    7.2 STYRENE ACRYLIC 
           7.2.1 RESISTANCE TO WATER AND MOISTURE TO DRIVE MARKET
    7.3 ACRYLICS 
           7.3.1 TRANSPARENCY, RESISTANCE TO BREAKAGE, AND ELASTICITY TO DRIVE MARKET
    7.4 STYRENE BUTADIENE 
           7.4.1 ASPHALT, ROAD PAVING, WATERPROOFING, AND GENERAL CONSTRUCTION APPLICATIONS TO DRIVE MARKET
    7.5 VINYL ACETATE ETHYLENE 
           7.5.1 STRONG ADHESION, FILM-FORMING ABILITY, RESISTANCE TO UV LIGHT AND WATER, FLEXIBILITY, AND TOUGHNESS TO DRIVE MARKET
    7.6 POLYVINYL ACETATE 
           7.6.1 STRONG BONDING CAPABILITY WITH DIVERSE SUBSTRATES TO DRIVE MARKET
    7.7 VINYL ACETATE COPOLYMER 
           7.7.1 EXCELLENT ADHESION, FLEXIBILITY, WATER RESISTANCE, AND DURABILITY TO DRIVE MARKET
    7.8 OTHER TYPES 
 
8 SYNTHETIC LATEX POLYMERS MARKET, BY APPLICATION (Page No. - 74)
    8.1 INTRODUCTION 
          FIGURE 27 ADHESIVES & SEALANTS APPLICATION TO ACCOUNT FOR LARGEST MARKET SHARE IN 2024
          TABLE 12 SYNTHETIC LATEX POLYMERS MARKET, BY APPLICATION, 2020–2023 (KILOTON)
          TABLE 13 SYNTHETIC LATEX POLYMERS MARKET, BY APPLICATION, 2024–2029 (KILOTON)
          TABLE 14 SYNTHETIC LATEX POLYMERS MARKET, BY APPLICATION, 2020–2023 (USD MILLION)
          TABLE 15 SYNTHETIC LATEX POLYMERS MARKET, BY APPLICATION, 2024–2029 (USD MILLION)
    8.2 PAINTS & COATINGS 
           8.2.1 LONG-LASTING COATINGS RESISTING PEELING, CRACKING, AND FLAKING TO DRIVE MARKET
    8.3 ADHESIVES & SEALANTS 
           8.3.1 ENHANCED BONDING STRENGTH, SUSTAINABILITY, AND COST-EFFECTIVENESS TO DRIVE MARKET
    8.4 PAPER & PAPERBOARD 
           8.4.1 GLOSSY SURFACE, PRINT PRECISION, WATER AND OIL RESISTANCE, INCREASING FUNCTIONALITY, AND VISUAL APPEAL TO DRIVE MARKET
    8.5 NONWOVENS 
           8.5.1 EXCELLENT ADHESION WHILE MAINTAINING SOFTNESS AND FLEXIBILITY OF FABRIC TO DRIVE MARKET
    8.6 CARPETS 
           8.6.1 COMFORT, CUSHIONING, AND SOUND DAMPENING PROPERTIES TO DRIVE MARKET
    8.7 OTHER APPLICATIONS 
 
9 SYNTHETIC LATEX POLYMERS MARKET, BY REGION (Page No. - 80)
    9.1 INTRODUCTION 
          FIGURE 28 INDIA TO BE FASTEST-GROWING MARKET DURING FORECAST PERIOD
          TABLE 16 SYNTHETIC LATEX POLYMERS MARKET, BY REGION, 2020–2023 (KILOTON)
          TABLE 17 SYNTHETIC LATEX POLYMERS MARKET, BY REGION, 2024–2029 (KILOTON)
          TABLE 18 SYNTHETIC LATEX POLYMERS MARKET, BY REGION, 2020–2023 (USD MILLION)
          TABLE 19 SYNTHETIC LATEX POLYMERS MARKET, BY REGION, 2024–2029 (USD MILLION)
    9.2 NORTH AMERICA 
           9.2.1 IMPACT OF RECESSION
                    FIGURE 29 NORTH AMERICA: SYNTHETIC LATEX POLYMERS MARKET SNAPSHOT
                    TABLE 20 NORTH AMERICA: SYNTHETIC LATEX POLYMERS MARKET, BY COUNTRY, 2020–2023 (KILOTON)
                    TABLE 21 NORTH AMERICA: SYNTHETIC LATEX POLYMERS MARKET, BY COUNTRY, 2024–2029 (KILOTON)
                    TABLE 22 NORTH AMERICA: SYNTHETIC LATEX POLYMERS MARKET, BY COUNTRY, 2020–2023 (USD MILLION)
                    TABLE 23 NORTH AMERICA: SYNTHETIC LATEX POLYMERS MARKET, BY COUNTRY, 2024–2029 (USD MILLION)
                    TABLE 24 NORTH AMERICA: SYNTHETIC LATEX POLYMERS MARKET, BY APPLICATION, 2020–2023 (KILOTON)
                    TABLE 25 NORTH AMERICA: SYNTHETIC LATEX POLYMERS MARKET, BY APPLICATION, 2024–2029 (KILOTON)
                    TABLE 26 NORTH AMERICA: SYNTHETIC LATEX POLYMERS MARKET, BY APPLICATION, 2020–2023 (USD MILLION)
                    TABLE 27 NORTH AMERICA: SYNTHETIC LATEX POLYMERS MARKET, BY APPLICATION, 2024–2029 (USD MILLION)
           9.2.2 US
                    9.2.2.1 Increasing industrial applications and shift toward sustainable and environmentally friendly materials to drive market
                                TABLE 28 US: SYNTHETIC LATEX POLYMERS MARKET, BY APPLICATION, 2020–2023 (KILOTON)
                                TABLE 29 US: SYNTHETIC LATEX POLYMERS MARKET, BY APPLICATION, 2024–2029 (KILOTON)
                                TABLE 30 US: SYNTHETIC LATEX POLYMERS MARKET, BY APPLICATION, 2020–2023 (USD MILLION)
                                TABLE 31 US: SYNTHETIC LATEX POLYMERS MARKET, BY APPLICATION, 2024–2029 (USD MILLION)
           9.2.3 CANADA
                    9.2.3.1 Significant investments through Infrastructure Canada to drive market
                                TABLE 32 CANADA: SYNTHETIC LATEX POLYMERS MARKET, BY APPLICATION, 2020–2023 (KILOTON)
                                TABLE 33 CANADA: SYNTHETIC LATEX POLYMERS MARKET, BY APPLICATION, 2024–2029 (KILOTON)
                                TABLE 34 CANADA: SYNTHETIC LATEX POLYMERS MARKET, BY APPLICATION, 2020–2023 (USD MILLION)
                                TABLE 35 CANADA: SYNTHETIC LATEX POLYMERS MARKET, BY APPLICATION, 2024–2029 (USD MILLION)
           9.2.4 MEXICO
                    9.2.4.1 Infrastructure projects and large packaging industry to drive market
                                TABLE 36 MEXICO: SYNTHETIC LATEX POLYMERS MARKET, BY APPLICATION, 2020–2023 (KILOTON)
                                TABLE 37 MEXICO: SYNTHETIC LATEX POLYMERS MARKET, BY APPLICATION, 2024–2029 (KILOTON)
                                TABLE 38 MEXICO: SYNTHETIC LATEX POLYMERS MARKET, BY APPLICATION, 2020–2023 (USD MILLION)
                                TABLE 39 MEXICO: SYNTHETIC LATEX POLYMERS MARKET, BY APPLICATION, 2024–2029 (USD MILLION)
    9.3 ASIA PACIFIC 
           9.3.1 IMPACT OF RECESSION
                    FIGURE 30 ASIA PACIFIC: SYNTHETIC LATEX POLYMERS MARKET SNAPSHOT
                    TABLE 40 ASIA PACIFIC: SYNTHETIC LATEX POLYMERS MARKET, BY COUNTRY, 2020–2023 (KILOTON)
                    TABLE 41 ASIA PACIFIC: SYNTHETIC LATEX POLYMERS MARKET, BY COUNTRY, 2024–2029 (KILOTON)
                    TABLE 42 ASIA PACIFIC: SYNTHETIC LATEX POLYMERS MARKET, BY COUNTRY, 2020–2023 (USD MILLION)
                    TABLE 43 ASIA PACIFIC: SYNTHETIC LATEX POLYMERS MARKET, BY COUNTRY, 2024–2029 (USD MILLION)
                    TABLE 44 ASIA PACIFIC: SYNTHETIC LATEX POLYMERS MARKET, BY APPLICATION, 2020–2023 (KILOTON)
                    TABLE 45 ASIA PACIFIC: SYNTHETIC LATEX POLYMERS MARKET, BY APPLICATION, 2024–2029 (KILOTON)
                    TABLE 46 ASIA PACIFIC: SYNTHETIC LATEX POLYMERS MARKET, BY APPLICATION, 2020–2023 (USD MILLION)
                    TABLE 47 ASIA PACIFIC: SYNTHETIC LATEX POLYMERS MARKET, BY APPLICATION, 2024–2029 (USD MILLION)
           9.3.2 CHINA
                    9.3.2.1 Urbanization and infrastructure projects to drive market
                                TABLE 48 CHINA: SYNTHETIC LATEX POLYMERS MARKET, BY APPLICATION, 2020–2023 (KILOTON)
                                TABLE 49 CHINA: SYNTHETIC LATEX POLYMERS MARKET, BY APPLICATION, 2024–2029 (KILOTON)
                                TABLE 50 CHINA: SYNTHETIC LATEX POLYMERS MARKET, BY APPLICATION, 2020–2023 (USD MILLION)
                                TABLE 51 CHINA: SYNTHETIC LATEX POLYMERS MARKET, BY APPLICATION, 2024–2029 (USD MILLION)
           9.3.3 JAPAN
                    9.3.3.1 Manufacture of high-quality electronic components to drive market
                                TABLE 52 JAPAN: SYNTHETIC LATEX POLYMERS MARKET, BY APPLICATION, 2020–2023 (KILOTON)
                                TABLE 53 JAPAN: SYNTHETIC LATEX POLYMERS MARKET, BY APPLICATION, 2024–2029 (KILOTON)
                                TABLE 54 JAPAN: SYNTHETIC LATEX POLYMERS MARKET, BY APPLICATION, 2020–2023 (USD MILLION)
                                TABLE 55 JAPAN: SYNTHETIC LATEX POLYMERS MARKET, BY APPLICATION, 2024–2029 (USD MILLION)
           9.3.4 INDIA
                    9.3.4.1 Rapid urbanization and booming e-commerce industry to drive market
                                TABLE 56 INDIA: SYNTHETIC LATEX POLYMERS MARKET, BY APPLICATION, 2020–2023 (KILOTON)
                                TABLE 57 INDIA: SYNTHETIC LATEX POLYMERS MARKET, BY APPLICATION, 2024–2029 (KILOTON)
                                TABLE 58 INDIA: SYNTHETIC LATEX POLYMERS MARKET, BY APPLICATION, 2020–2023 (USD MILLION)
                                TABLE 59 INDIA: SYNTHETIC LATEX POLYMERS MARKET, BY APPLICATION, 2024–2029 (USD MILLION)
           9.3.5 MALAYSIA
                    9.3.5.1 Expanding paper & paperboard industry to boost market
                                TABLE 60 MALAYSIA: SYNTHETIC LATEX POLYMERS MARKET, BY APPLICATION, 2020–2023 (KILOTON)
                                TABLE 61 MALAYSIA: SYNTHETIC LATEX POLYMERS MARKET, BY APPLICATION, 2024–2029 (KILOTON)
                                TABLE 62 MALAYSIA: SYNTHETIC LATEX POLYMERS MARKET, BY APPLICATION, 2020–2023 (USD MILLION)
                                TABLE 63 MALAYSIA: SYNTHETIC LATEX POLYMERS MARKET, BY APPLICATION, 2024–2029 (USD MILLION)
           9.3.6 THAILAND
                    9.3.6.1 Extensive demand from textiles, automotive, construction, and packaging industries to boost market
                                TABLE 64 THAILAND: SYNTHETIC LATEX POLYMERS MARKET, BY APPLICATION, 2020–2023 (KILOTON)
                                TABLE 65 THAILAND: SYNTHETIC LATEX POLYMERS MARKET, BY APPLICATION, 2024–2029 (KILOTON)
                                TABLE 66 THAILAND: SYNTHETIC LATEX POLYMERS MARKET, BY APPLICATION, 2020–2023 (USD MILLION)
                                TABLE 67 THAILAND: SYNTHETIC LATEX POLYMERS MARKET, BY APPLICATION, 2024–2029 (USD MILLION)
           9.3.7 REST OF ASIA PACIFIC
                    TABLE 68 REST OF ASIA PACIFIC: SYNTHETIC LATEX POLYMERS MARKET, BY APPLICATION, 2020–2023 (KILOTON)
                    TABLE 69 REST OF ASIA PACIFIC: SYNTHETIC LATEX POLYMERS MARKET, BY APPLICATION, 2024–2029 (KILOTON)
                    TABLE 70 REST OF ASIA PACIFIC: SYNTHETIC LATEX POLYMERS MARKET, BY APPLICATION, 2020–2023 (USD MILLION)
                    TABLE 71 REST OF ASIA PACIFIC: SYNTHETIC LATEX POLYMERS MARKET, BY APPLICATION, 2024–2029 (USD MILLION)
    9.4 EUROPE 
           9.4.1 IMPACT OF RECESSION
                    FIGURE 31 EUROPE: SYNTHETIC LATEX POLYMERS MARKET SNAPSHOT
                    TABLE 72 EUROPE: SYNTHETIC LATEX POLYMERS MARKET, BY COUNTRY, 2020–2023 (KILOTON)
                    TABLE 73 EUROPE: SYNTHETIC LATEX POLYMERS MARKET, BY COUNTRY, 2024–2029 (KILOTON)
                    TABLE 74 EUROPE: SYNTHETIC LATEX POLYMERS MARKET, BY COUNTRY, 2020–2023 (USD MILLION)
                    TABLE 75 EUROPE: SYNTHETIC LATEX POLYMERS MARKET, BY COUNTRY, 2024–2029 (USD MILLION)
                    TABLE 76 EUROPE: SYNTHETIC LATEX POLYMERS MARKET, BY APPLICATION, 2020–2023 (KILOTON)
                    TABLE 77 EUROPE: SYNTHETIC LATEX POLYMERS MARKET, BY APPLICATION, 2024–2029 (KILOTON)
                    TABLE 78 EUROPE: SYNTHETIC LATEX POLYMERS MARKET, BY APPLICATION, 2020–2023 (USD MILLION)
                    TABLE 79 EUROPE: SYNTHETIC LATEX POLYMERS MARKET, BY APPLICATION, 2024–2029 (USD MILLION)
           9.4.2 GERMANY
                    9.4.2.1 Large automotive sector to drive market
                                TABLE 80 GERMANY: SYNTHETIC LATEX POLYMERS MARKET, BY APPLICATION, 2020–2023 (KILOTON)
                                TABLE 81 GERMANY: SYNTHETIC LATEX POLYMERS MARKET, BY APPLICATION, 2024–2029 (KILOTON)
                                TABLE 82 GERMANY: SYNTHETIC LATEX POLYMERS MARKET, BY APPLICATION, 2020–2023 (USD MILLION)
                                TABLE 83 GERMANY: SYNTHETIC LATEX POLYMERS MARKET, BY APPLICATION, 2024–2029 (USD MILLION)
           9.4.3 FRANCE
                    9.4.3.1 Large number of construction projects to drive market
                                TABLE 84 FRANCE: SYNTHETIC LATEX POLYMERS MARKET, BY APPLICATION, 2020–2023 (KILOTON)
                                TABLE 85 FRANCE: SYNTHETIC LATEX POLYMERS MARKET, BY APPLICATION, 2024–2029 (KILOTON)
                                TABLE 86 FRANCE: SYNTHETIC LATEX POLYMERS MARKET, BY APPLICATION, 2020–2023 (USD MILLION)
                                TABLE 87 FRANCE: SYNTHETIC LATEX POLYMERS MARKET, BY APPLICATION, 2024–2029 (USD MILLION)
           9.4.4 UK
                    9.4.4.1 Demand from construction, automotive, and aerospace sectors to boost market
                                TABLE 88 UK: SYNTHETIC LATEX POLYMERS MARKET, BY APPLICATION, 2020–2023 (KILOTON)
                                TABLE 89 UK: SYNTHETIC LATEX POLYMERS MARKET, BY APPLICATION, 2024–2029 (KILOTON)
                                TABLE 90 UK: SYNTHETIC LATEX POLYMERS MARKET, BY APPLICATION, 2020–2023 (USD MILLION)
                                TABLE 91 UK: SYNTHETIC LATEX POLYMERS MARKET, BY APPLICATION, 2024–2029 (USD MILLION)
           9.4.5 ITALY
                    9.4.5.1 Automotive, construction, textile, and food & beverage industries to drive market
                                TABLE 92 ITALY: SYNTHETIC LATEX POLYMERS MARKET, BY APPLICATION, 2020–2023 (KILOTON)
                                TABLE 93 ITALY: SYNTHETIC LATEX POLYMERS MARKET, BY APPLICATION, 2024–2029 (KILOTON)
                                TABLE 94 ITALY: SYNTHETIC LATEX POLYMERS MARKET, BY APPLICATION, 2020–2023 (USD MILLION)
                                TABLE 95 ITALY: SYNTHETIC LATEX POLYMERS MARKET, BY APPLICATION, 2024–2029 (USD MILLION)
           9.4.6 RUSSIA
                    9.4.6.1 Demand for adhesives, sealants, and coatings for building materials to drive market
                                TABLE 96 RUSSIA: SYNTHETIC LATEX POLYMERS MARKET, BY APPLICATION, 2020–2023 (KILOTON)
                                TABLE 97 RUSSIA: SYNTHETIC LATEX POLYMERS MARKET, BY APPLICATION, 2024–2029 (KILOTON)
                                TABLE 98 RUSSIA: SYNTHETIC LATEX POLYMERS MARKET, BY APPLICATION, 2020–2023 (USD MILLION)
                                TABLE 99 RUSSIA: SYNTHETIC LATEX POLYMERS MARKET, BY APPLICATION, 2024–2029 (USD MILLION)
           9.4.7 REST OF EUROPE
                    TABLE 100 REST OF EUROPE: SYNTHETIC LATEX POLYMERS MARKET, BY APPLICATION, 2020–2023 (KILOTON)
                    TABLE 101 REST OF EUROPE: SYNTHETIC LATEX POLYMERS MARKET, BY APPLICATION, 2024–2029 (KILOTON)
                    TABLE 102 REST OF EUROPE: SYNTHETIC LATEX POLYMERS MARKET, BY APPLICATION, 2020–2023 (USD MILLION)
                    TABLE 103 REST OF EUROPE: SYNTHETIC LATEX POLYMERS MARKET, BY APPLICATION, 2024–2029 (USD MILLION)
    9.5 SOUTH AMERICA 
           9.5.1 IMPACT OF RECESSION
                    TABLE 104 SOUTH AMERICA: SYNTHETIC LATEX POLYMERS MARKET, BY COUNTRY, 2020–2023 (KILOTON)
                    TABLE 105 SOUTH AMERICA: SYNTHETIC LATEX POLYMERS MARKET, BY COUNTRY, 2024–2029 (KILOTON)
                    TABLE 106 SOUTH AMERICA: SYNTHETIC LATEX POLYMERS MARKET, BY COUNTRY, 2020–2023 (USD MILLION)
                    TABLE 107 SOUTH AMERICA: SYNTHETIC LATEX POLYMERS MARKET, BY COUNTRY, 2024–2029 (USD MILLION)
                    TABLE 108 SOUTH AMERICA: SYNTHETIC LATEX POLYMERS MARKET, BY APPLICATION, 2020–2023 (KILOTON)
                    TABLE 109 SOUTH AMERICA: SYNTHETIC LATEX POLYMERS MARKET, BY APPLICATION, 2024–2029 (KILOTON)
                    TABLE 110 SOUTH AMERICA: SYNTHETIC LATEX POLYMERS MARKET, BY APPLICATION, 2020–2023 (USD MILLION)
                    TABLE 111 SOUTH AMERICA: SYNTHETIC LATEX POLYMERS MARKET, BY APPLICATION, 2024–2029 (USD MILLION)
           9.5.2 BRAZIL
                    9.5.2.1 Government initiatives in infrastructure development to drive market
                                TABLE 112 BRAZIL: SYNTHETIC LATEX POLYMERS MARKET, BY APPLICATION, 2020–2023 (KILOTON)
                                TABLE 113 BRAZIL: SYNTHETIC LATEX POLYMERS MARKET, BY APPLICATION, 2024–2029 (KILOTON)
                                TABLE 114 BRAZIL: SYNTHETIC LATEX POLYMERS MARKET, BY APPLICATION, 2020–2023 (USD MILLION)
                                TABLE 115 BRAZIL: SYNTHETIC LATEX POLYMERS MARKET, BY APPLICATION, 2024–2029 (USD MILLION)
           9.5.3 ARGENTINA
                    9.5.3.1 Developed economy to boost demand
                                TABLE 116 ARGENTINA: SYNTHETIC LATEX POLYMERS MARKET, BY APPLICATION, 2020–2023 (KILOTON)
                                TABLE 117 ARGENTINA: SYNTHETIC LATEX POLYMERS MARKET, BY APPLICATION, 2024–2029 (KILOTON)
                                TABLE 118 ARGENTINA: SYNTHETIC LATEX POLYMERS MARKET, BY APPLICATION, 2020–2023 (USD MILLION)
                                TABLE 119 ARGENTINA: SYNTHETIC LATEX POLYMERS MARKET, BY APPLICATION, 2024–2029 (USD MILLION)
           9.5.4 REST OF SOUTH AMERICA
                    TABLE 120 REST OF SOUTH AMERICA: SYNTHETIC LATEX POLYMERS MARKET, BY APPLICATION, 2020–2023 (KILOTON)
                    TABLE 121 REST OF SOUTH AMERICA: SYNTHETIC LATEX POLYMERS MARKET, BY APPLICATION, 2024–2029 (KILOTON)
                    TABLE 122 REST OF SOUTH AMERICA: SYNTHETIC LATEX POLYMERS MARKET, BY APPLICATION, 2020–2023 (USD MILLION)
                    TABLE 123 REST OF SOUTH AMERICA: SYNTHETIC LATEX POLYMERS MARKET, BY APPLICATION, 2024–2029 (USD MILLION)
    9.6 MIDDLE EAST & AFRICA 
           9.6.1 IMPACT OF RECESSION
                    TABLE 124 MIDDLE EAST & AFRICA: SYNTHETIC LATEX POLYMERS MARKET, BY COUNTRY, 2020–2023 (KILOTON)
                    TABLE 125 MIDDLE EAST & AFRICA: SYNTHETIC LATEX POLYMERS MARKET, BY COUNTRY, 2024–2029 (KILOTON)
                    TABLE 126 MIDDLE EAST & AFRICA: SYNTHETIC LATEX POLYMERS MARKET, BY COUNTRY, 2020–2023 (USD MILLION)
                    TABLE 127 MIDDLE EAST & AFRICA: SYNTHETIC LATEX POLYMERS MARKET, BY COUNTRY, 2024–2029 (USD MILLION)
                    TABLE 128 MIDDLE EAST & AFRICA: SYNTHETIC LATEX POLYMERS MARKET, BY APPLICATION, 2020–2023 (KILOTON)
                    TABLE 129 MIDDLE EAST & AFRICA: SYNTHETIC LATEX POLYMERS MARKET, BY APPLICATION, 2024–2029 (KILOTON)
                    TABLE 130 MIDDLE EAST & AFRICA: SYNTHETIC LATEX POLYMERS MARKET, BY APPLICATION, 2020–2023 (USD MILLION)
                    TABLE 131 MIDDLE EAST & AFRICA: SYNTHETIC LATEX POLYMERS MARKET, BY APPLICATION, 2024–2029 (USD MILLION)
           9.6.2 SAUDI ARABIA
                    9.6.2.1 Significant investments in infrastructure and construction projects to boost demand
                                TABLE 132 SAUDI ARABIA: SYNTHETIC LATEX POLYMERS MARKET, BY APPLICATION, 2020–2023 (KILOTON)
                                TABLE 133 SAUDI ARABIA: SYNTHETIC LATEX POLYMERS MARKET, BY APPLICATION, 2024–2029 (KILOTON)
                                TABLE 134 SAUDI ARABIA: SYNTHETIC LATEX POLYMERS MARKET, BY APPLICATION, 2020–2023 (USD MILLION)
                                TABLE 135 SAUDI ARABIA: SYNTHETIC LATEX POLYMERS MARKET, BY APPLICATION, 2024–2029 (USD MILLION)
           9.6.3 REST OF GCC COUNTRIES
                    TABLE 136 REST OF GCC COUNTRIES: SYNTHETIC LATEX POLYMERS MARKET, BY APPLICATION, 2020–2023 (KILOTON)
                    TABLE 137 REST OF GCC COUNTRIES: SYNTHETIC LATEX POLYMERS MARKET, BY APPLICATION, 2024–2029 (KILOTON)
                    TABLE 138 REST OF GCC COUNTRIES: SYNTHETIC LATEX POLYMERS MARKET, BY APPLICATION, 2020–2023 (USD MILLION)
                    TABLE 139 REST OF GCC COUNTRIES: SYNTHETIC LATEX POLYMERS MARKET, BY APPLICATION, 2024–2029 (USD MILLION)
           9.6.4 SOUTH AFRICA
                    9.6.4.1 Government initiatives to promote construction industry to drive market
                                TABLE 140 SOUTH AFRICA: SYNTHETIC LATEX POLYMERS MARKET, BY APPLICATION, 2020–2023 (KILOTON)
                                TABLE 141 SOUTH AFRICA: SYNTHETIC LATEX POLYMERS MARKET, BY APPLICATION, 2024–2029 (KILOTON)
                                TABLE 142 SOUTH AFRICA: SYNTHETIC LATEX POLYMERS MARKET, BY APPLICATION, 2020–2023 (USD MILLION)
                                TABLE 143 SOUTH AFRICA: SYNTHETIC LATEX POLYMERS MARKET, BY APPLICATION, 2024–2029 (USD MILLION)
           9.6.5 REST OF MIDDLE EAST & AFRICA
                    TABLE 144 REST OF MIDDLE EAST & AFRICA: SYNTHETIC LATEX POLYMERS MARKET, BY APPLICATION, 2020–2023 (KILOTON)
                    TABLE 145 REST OF MIDDLE EAST & AFRICA: SYNTHETIC LATEX POLYMERS MARKET, BY APPLICATION, 2024–2029 (KILOTON)
                    TABLE 146 REST OF MIDDLE EAST & AFRICA: SYNTHETIC LATEX POLYMERS MARKET, BY APPLICATION, 2020–2023 (USD MILLION)
                    TABLE 147 REST OF MIDDLE EAST & AFRICA: SYNTHETIC LATEX POLYMERS MARKET, BY APPLICATION, 2024–2029 (USD MILLION)
 
10 COMPETITIVE LANDSCAPE (Page No. - 139)
     10.1 OVERVIEW 
     10.2 KEY PLAYER STRATEGIES/RIGHT TO WIN 
             FIGURE 32 OVERVIEW OF STRATEGIES ADOPTED BY KEY PLAYERS IN SYNTHETIC LATEX POLYMERS MARKET BETWEEN 2019 AND 2023
     10.3 REVENUE ANALYSIS, 2021–2023 
             FIGURE 33 REVENUE ANALYSIS OF KEY COMPANIES IN SYNTHETIC LATEX POLYMERS MARKET, 2021–2023
             TABLE 148 THREE-YEAR REVENUE ANALYSIS OF KEY COMPANIES IN SYNTHETIC LATEX POLYMERS MARKET
     10.4 MARKET SHARE ANALYSIS, 2023 
             FIGURE 34 SHARE OF LEADING COMPANIES IN SYNTHETIC LATEX POLYMERS MARKET, 2023
             TABLE 149 SYNTHETIC LATEX POLYMERS MARKET: DEGREE OF COMPETITION
     10.5 COMPANY VALUATION AND FINANCIAL METRICS 
             FIGURE 35 COMPANY VALUATION OF LEADING COMPANIES IN SYNTHETIC LATEX POLYMERS MARKET, 2023
             FIGURE 36 FINANCIAL METRICS OF LEADING COMPANIES IN SYNTHETIC LATEX POLYMERS MARKET, 2023
     10.6 SYNTHETIC LATEX POLYMERS MARKET: BRAND/PRODUCT COMPARISON 
     10.7 COMPANY EVALUATION MATRIX: KEY PLAYERS, 2023 
             10.7.1 STARS
             10.7.2 EMERGING LEADERS
             10.7.3 PERVASIVE PLAYERS
             10.7.4 PARTICIPANTS
                        FIGURE 37 SYNTHETIC LATEX POLYMERS MARKET: COMPANY EVALUATION MATRIX FOR KEY COMPANIES, 2023
             10.7.5 COMPETITIVE BENCHMARKING
                        TABLE 150 TYPE: COMPANY FOOTPRINT (19 COMPANIES)
                        TABLE 151 APPLICATION: COMPANY FOOTPRINT (19 COMPANIES)
                        TABLE 152 REGION: COMPANY FOOTPRINT (19 COMPANIES)
                        TABLE 153 OVERALL COMPANY FOOTPRINT (19 COMPANIES)
     10.8 COMPETITIVE SCENARIO AND TRENDS 
             10.8.1 PRODUCT LAUNCHES
                        TABLE 154 SYNTHETIC LATEX POLYMERS MARKET: PRODUCT LAUNCHES, OCTOBER 2020–MARCH 2024
             10.8.2 DEALS
                        TABLE 155 SYNTHETIC LATEX POLYMERS MARKET: DEALS, JANUARY 2019–APRIL 2024
             10.8.3 OTHER DEVELOPMENTS
                        TABLE 156 SYNTHETIC LATEX POLYMERS MARKET: OTHER DEVELOPMENTS, JANUARY 2019–APRIL 2024
 
11 COMPANY PROFILES (Page No. - 156)
     11.1 KEY PLAYERS 
(Business Overview, Products/Solutions/Services Offered, Recent Developments, MnM view (Key strengths/Right to win, Strategic choices made, Weakness/competitive threats)*
             11.1.1 ARKEMA
                        TABLE 157 ARKEMA: COMPANY OVERVIEW
                        FIGURE 38 ARKEMA: COMPANY SNAPSHOT
                        TABLE 158 ARKEMA: PRODUCTS/SOLUTIONS/SERVICES OFFERED
                        TABLE 159 ARKEMA: DEALS, JANUARY 2019–APRIL 2024
             11.1.2 WACKER CHEMIE AG
                        TABLE 160 WACKER CHEMIE AG: COMPANY OVERVIEW
                        FIGURE 39 WACKER CHEMIE AG: COMPANY SNAPSHOT
                        TABLE 161 WACKER CHEMIE AG: PRODUCTS/SOLUTIONS/SERVICES OFFERED
                        TABLE 162 WACKER CHEMIE AG: PRODUCT LAUNCHES, JANUARY 2019–APRIL 2024
                        TABLE 163 WACKER CHEMIE AG: OTHERS, JANUARY 2019–APRIL 2024
             11.1.3 SYNTHOMER PLC
                        TABLE 164 SYNTHOMER PLC: COMPANY OVERVIEW
                        FIGURE 40 SYNTHOMER PLC: COMPANY SNAPSHOT
                        TABLE 165 SYNTHOMER PLC: PRODUCTS/SOLUTIONS/SERVICES OFFERED
                        TABLE 166 SYNTHOMER PLC: PRODUCT LAUNCHES, OCTOBER 2020
                        TABLE 167 SYNTHOMER PLC: DEALS, APRIL 2020
                        TABLE 168 SYNTHOMER PLC: EXPANSIONS, SEPTEMBER 2019
             11.1.4 LG CHEM
                        TABLE 169 LG CHEM: COMPANY OVERVIEW
                        FIGURE 41 LG CHEM: COMPANY SNAPSHOT
                        TABLE 170 LG CHEM: PRODUCTS/SOLUTIONS/SERVICES OFFERED
             11.1.5 CELANESE
                        TABLE 171 CELANESE: COMPANY OVERVIEW
                        FIGURE 42 CELANESE: COMPANY SNAPSHOT
                        TABLE 172 CELANESE: PRODUCTS/SOLUTIONS/SERVICES OFFERED
                        TABLE 173 CELANESE: DEALS, JANUARY 2020–JANUARY 2024
                        TABLE 174 CELANESE: EXPANSIONS, MARCH 2021–APRIL 2024
             11.1.6 TRINSEO
                        TABLE 175 TRINSEO: COMPANY OVERVIEW
                        FIGURE 43 TRINSEO: COMPANY SNAPSHOT
                        TABLE 176 TRINSEO: PRODUCTS/SOLUTIONS/SERVICES OFFERED
                        TABLE 177 TRINSEO: PRODUCT LAUNCHES, FEBRUARY 2023–MARCH 2024
                        TABLE 178 TRINSEO: DEALS, JANUARY 2019–APRIL 2024
             11.1.7 DOW
                        TABLE 179 DOW: COMPANY OVERVIEW
                        FIGURE 44 DOW: COMPANY SNAPSHOT
                        TABLE 180 DOW: PRODUCTS/SOLUTIONS/SERVICES OFFERED
             11.1.8 BASF SE
                        TABLE 181 BASF SE: COMPANY OVERVIEW
                        FIGURE 45 BASF SE: COMPANY SNAPSHOT
                        TABLE 182 BASF SE: PRODUCTS/SOLUTIONS/SERVICES OFFERED
                        TABLE 183 BASF SE: EXPANSIONS, JANUARY 2019–APRIL 2024
             11.1.9 APCOTEX
                        TABLE 184 APCOTEX: COMPANY OVERVIEW
                        FIGURE 46 APCOTEX: COMPANY SNAPSHOT
                        TABLE 185 APCOTEX: PRODUCTS/SOLUTIONS/SERVICES OFFERED
             11.1.10 ARLANXEO
                        TABLE 186 ARLANXEO: COMPANY OVERVIEW
                        TABLE 187 ARLANXEO: PRODUCTS/SOLUTIONS/SERVICES OFFERED
             11.1.11 H.B. FULLER
                        TABLE 188 H.B. FULLER: COMPANY OVERVIEW
                        FIGURE 47 H.B. FULLER: COMPANY SNAPSHOT
                        TABLE 189 H.B. FULLER: PRODUCTS/SOLUTIONS/SERVICES OFFERED
     11.2 OTHER PLAYERS 
             11.2.1 ASAHI KASEI CORPORATION
                        TABLE 190 ASAHI KASEI CORPORATION: COMPANY OVERVIEW
             11.2.2 THE LUBRIZOL CORPORATION
                        TABLE 191 THE LUBRIZOL CORPORATION: COMPANY OVERVIEW
             11.2.3 ZEON CORPORATION
                        TABLE 192 ZEON CORPORATION: COMPANY OVERVIEW
             11.2.4 JUBILANT
                        TABLE 193 JUBILANT: COMPANY OVERVIEW
             11.2.5 BST.CO.TH
                        TABLE 194 BST.CO.TH: COMPANY OVERVIEW
             11.2.6 THE GOODYEAR TIRE & RUBBER COMPANY
                        TABLE 195 THE GOODYEAR TIRE & RUBBER COMPANY: COMPANY OVERVIEW
             11.2.7 THE SYNTHETIC LATEX COMPANY (PTY) LTD
                        TABLE 196 THE SYNTHETIC LATEX COMPANY (PTY) LTD: COMPANY OVERVIEW
             11.2.8 SUMITOMO CHEMICAL CO., LTD.
                        TABLE 197 SUMITOMO CHEMICAL CO., LTD.: COMPANY OVERVIEW
             11.2.9 VERSALIS S.P.A.
                        TABLE 198 VERSALIS S.P.A.: COMPANY OVERVIEW
             11.2.10 SHANXI SANWEI GROUP CO, LTD.
                        TABLE 199 SHANXI SANWEI GROUP CO, LTD.: COMPANY OVERVIEW
             11.2.11 VINAVIL AMERICAS CORP.
                        TABLE 200 VINAVIL AMERICAS CORP.: COMPANY OVERVIEW
             11.2.12 EOC GROUP
                        TABLE 201 EOC GROUP: COMPANY OVERVIEW
             11.2.13 HEXTAR GLOBAL BERHAD
                        TABLE 202 HEXTAR GLOBAL BERHAD: COMPANY OVERVIEW
             11.2.14 TUFBOND TECHNOLOGIES SDN BHD
                        TABLE 203 TUFBOND TECHNOLOGIES SDN BHD: COMPANY OVERVIEW
             11.2.15 NANTEX INDUSTRY CO., LTD.
                        TABLE 204 NANTEX INDUSTRY CO., LTD.: COMPANY OVERVIEW
 
*Details on Business Overview, Products/Solutions/Services Offered, Recent Developments, MnM view (Key strengths/Right to win, Strategic choices made, Weakness/competitive threats)* might not be captured in case of unlisted companies.
 
12 APPENDIX (Page No. - 201)
     12.1 DISCUSSION GUIDE 
     12.2 KNOWLEDGESTORE: MARKETSANDMARKETS’ SUBSCRIPTION PORTAL 
     12.3 CUSTOMIZATION OPTIONS 
     12.4 RELATED REPORTS 
     12.5 AUTHOR DETAILS 

The study involved four major activities in estimating the market size of the synthetic latex polymers market. Exhaustive secondary research was done to collect information on the market, the peer market, and the grandparent market. The next step was to validate these findings, assumptions, and sizing with industry experts across the value chain through primary research. Both top-down and bottom-up approaches were employed to estimate the complete market size. Thereafter, the market breakdown and data triangulation procedures were used to estimate the market size of the segments and subsegments.

Secondary Research

In the secondary research process, various secondary sources have been referred to for identifying and collecting information for this study. These secondary sources include annual reports, press releases, investor presentations of companies, white papers, certified publications, trade directories, articles from recognized authors, gold standard and silver standard websites, and databases. Secondary research has been used to obtain key information about the value chain of the industry, monetary chain of the market, the total pool of key players, market classification and segmentation according to industry trends to the bottom-most level, and regional markets. It was also used to obtain information about the key developments from a market-oriented perspective.

Primary Research

The synthetic latex polymers market comprises several stakeholders in the value chain, which include manufacturers, and end users. Various primary sources from the supply and demand sides of the synthetic latex polymers market have been interviewed to obtain qualitative and quantitative information. The primary interviewees from the demand side include key opinion leaders in synthetic latex sectors. The primary sources from the supply side include manufacturers, associations, and institutions involved in the synthetic latex polymers industry. Primary interviews were conducted to gather insights such as market statistics, data of revenue collected from the products and services, market breakdowns, market size estimations, market forecasting, and data triangulation. Primary research also helped in understanding the various trends related to type, application, and region. Stakeholders from the demand side, such as CIOs, CTOs, and CSOs were interviewed to understand the buyer’s perspective on the suppliers, products, component providers, and their current usage of synthetic latex polymers and outlook of their business, which will affect the overall market.

The breakdown of profiles of the primary interviewees is illustrated in the figure below:

Synthetic Latex Polymers Market Size, and Share

Note: Tier 1, Tier 2, and Tier 3 companies are classified based on their market revenue in 2022 available in the public domain, product portfolios, and geographical presence.

Other designations include consultants and sales, marketing, and procurement managers.

To know about the assumptions considered for the study, download the pdf brochure

Market Size Estimation

The top-down and bottom-up approaches have been used to estimate and validate the size of the synthetic latex polymers market.

  • The key players in the industry have been identified through extensive secondary research.
  • The supply chain of the industry has been determined through primary and secondary research.
  • All percentage shares, splits, and breakdowns have been determined using secondary sources and verified through primary sources.
  • All possible parameters that affect the markets covered in this research study have been accounted for, viewed in extensive detail, verified through primary research, and analyzed to obtain the final quantitative and qualitative data.
  • The research includes the study of reports, reviews, and newsletters of the key market players, along with extensive interviews for opinions with leaders such as directors and marketing executives.

TOP - DOWN Approach-

Synthetic Latex Polymers Market Size, and Share

To know about the assumptions considered for the study, Request for Free Sample Report

BOTTOM - UP Approach-

Synthetic Latex Polymers Market Size, and Share

Data Triangulation

After arriving at the total market size from the estimation process, the overall market has been split into several segments and sub-segments. To complete the overall market engineering process and arrive at the exact statistics for all the segments and sub-segments, the data triangulation and market breakdown procedures have been employed, wherever applicable. The data has been triangulated by studying various factors and trends from both the demand and supply sides. Along with this, the market size has been validated by using both the top-down and bottom-up approaches and primary interviews. Hence, for every data segment, there have been three sources—top-down approach, bottom-up approach, and expert interviews. The data was assumed correct when the values arrived from the three sources matched.

Market Definition

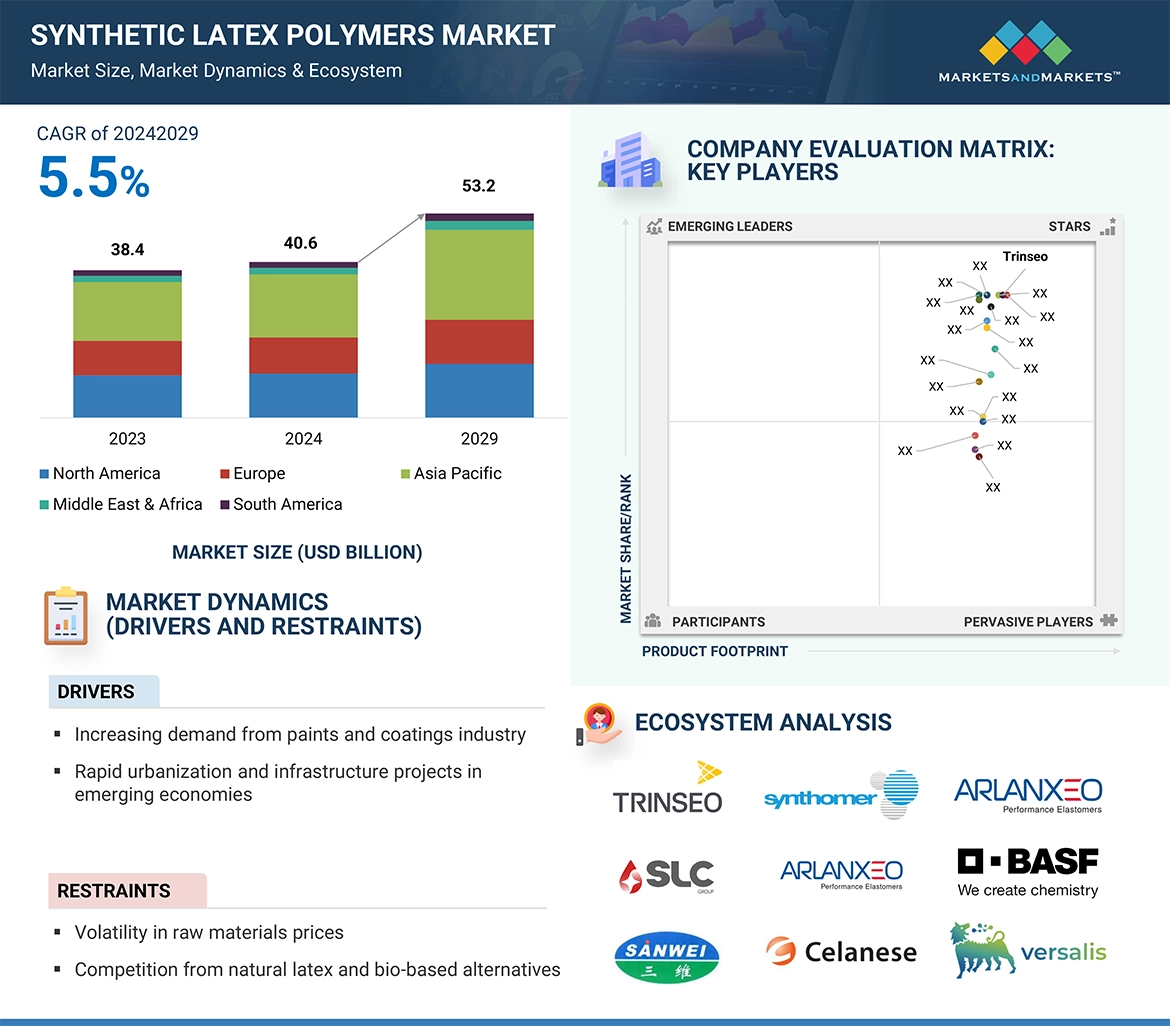
Synthetic latex polymers are artificially created substances containing polymer particles dispersed in water. These polymers undergo emulsion polymerization, where monomers such as styrene, butadiene, acrylic acid, vinyl acetate, or ethylene are polymerized to form chains of polymers suspended in water. They are widely employed in various industries due to their adaptability, effectiveness, and ease of application. These polymers function as binding agents, adhesives, coatings, and sealants in a wide array of applications, spanning from paints and coatings to textiles, paper, carpet backing, and specialized latex products. Their notable attributes include robust adhesion, longevity, malleability, and eco-friendliness, rendering them highly sought-after in numerous industrial and commercial contexts.

Key Stakeholders

  • Senior Management
  • End User
  • Finance/Procurement Department
  • R&D Department
  • Manufacturers
  • Raw Material Suppliers

Report Objectives

  • To define, describe, and forecast the size of the synthetic latex polymers market, in terms of value and volume.
  • To provide detailed information regarding the major factors (drivers, opportunities, restraints, and challenges) influencing the growth of the market
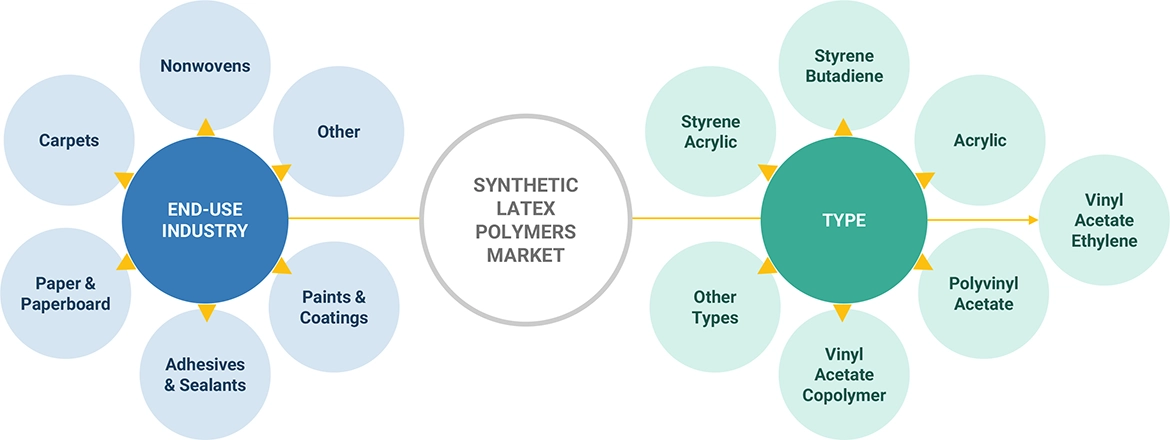
  • To estimate and forecast the market size based on type, application, and region.
  • To forecast the size of the market with respect to major regions, namely, Europe, North America, Asia Pacific, Middle East & Africa, and South America, along with their key countries
  • To strategically analyze micro-markets with respect to individual growth trends, prospects, and their contribution to the overall market
  • To analyze opportunities in the market for stakeholders and provide a competitive landscape of market leaders.
  • To track and analyze recent developments such as expansions, new product launches, partnerships & agreements, and acquisitions in the market.
  • To strategically profile key market players and comprehensively analyze their core competencies.

Available Customizations

Along with the given market data, MarketsandMarkets offers customizations according to the company’s specific needs. The following customization options are available for the report:

Regional Analysis

  • Further breakdown of a region with respect to a particular country or additional application

Company Information

  • Detailed analysis and profiles of additional market players

Tariff & Regulations

  • Regulations and Impact on Synthetic latex polymers market
Custom Market Research Services

We will customize the research for you, in case the report listed above does not meet with your exact requirements. Our custom research will comprehensively cover the business information you require to help you arrive at strategic and profitable business decisions.

Request Customization
Report Code
CH 5909
Published ON
May, 2024
Choose License Type
BUY NOW
  • SHARE
X
Request Customization
Speak to Analyst
Speak to Analyst
OR FACE-TO-FACE MEETING
PERSONALIZE THIS RESEARCH
  • Triangulate with your Own Data
  • Get Data as per your Format and Definition
  • Gain a Deeper Dive on a Specific Application, Geography, Customer or Competitor
  • Any level of Personalization
REQUEST A FREE CUSTOMIZATION
LET US HELP YOU!
  • What are the Known and Unknown Adjacencies Impacting the Synthetic Latex Polymers Market
  • What will your New Revenue Sources be?
  • Who will be your Top Customer; what will make them switch?
  • Defend your Market Share or Win Competitors
  • Get a Scorecard for Target Partners
CUSTOMIZED WORKSHOP REQUEST
  • Call Us
  • +1-888-600-6441 (Corporate office hours)
  • +1-888-600-6441 (US/Can toll free)
  • +44-800-368-9399 (UK office hours)
CONNECT WITH US
ABOUT TRUST ONLINE
©2024 MarketsandMarkets Research Private Ltd. All rights reserved
DMCA.com Protection Status Website Feedback