Vehicle Armor Materials Market

Vehicle Armor Materials Market by Type (Metals & Alloys, Ceramics, Composites, Fiberglass, Aramid Fibers), Application (Defense, Para Military, Police, Security Agencies, Personal), and Region (North America, Europe, APAC, ROW) - Global Forecast to 2029

Report Code: CH 8972 Mar, 2024, by marketsandmarkets.com

The vehicle armor materials market is projected to reach USD 9.3 billion by 2029, at a CAGR of 6.7% from USD 6.7 billion in 2024. The global vehicle armor materials market is primarily propelled by the imperative to safeguard personnel, assets, and vehicles against a multitude of threats prevalent in today's security landscape. This necessity stems from the ever-evolving nature of security challenges spanning defense, law enforcement, and civilian security sectors.

Vehicle Armor Materials Market

To know about the assumptions considered for the study, Request for Free Sample Report

Attractive Opportunities in the Vehicle Armor Materials Market

Vehicle Armor Materials Market

Market Dynamics

Driver: the demand for bulletproof vehicles is increasing due to increasing security concerns

A significant driver for the vehicle armor materials market is the continual evolution and diversification of security threats globally. As security challenges become increasingly sophisticated and varied, there is a growing demand for advanced armor materials capable of providing enhanced protection against ballistic threats, explosive devices, and other forms of aggression. This demand is particularly pronounced in sectors such as defense, law enforcement, and civilian security, where ensuring the safety and security of personnel, assets, and vehicles is paramount. Consequently, the development and adoption of innovative armor materials that offer superior ballistic resistance, durability, and adaptability are essential in addressing these evolving security threats. As a result, the need to stay ahead of emerging threats serves as a primary driver for the growth and advancement of the vehicle armor materials market.

Restraint: high cost of the armor materials is a great threat for the vehicle armor materials market

One of the significant restraints impacting the vehicle armor materials market is the high cost associated with the development, manufacturing, and installation of advanced armor solutions. The production of innovative armor materials often involves complex processes and specialized technologies, which can drive up production costs significantly. Additionally, the use of high-performance materials such as lightweight composites, advanced ceramics, and specialized alloys further contributes to the overall expense. These elevated costs can pose a barrier to entry for smaller manufacturers and limit the adoption of advanced armor materials, particularly in regions with limited financial resources or budget constraints. Moreover, the weight and bulkiness of certain armor materials can present challenges in vehicle design and integration, particularly for lightweight or high-performance vehicles where additional weight can impact mobility, fuel efficiency, and overall performance. The need to balance protection with vehicle functionality and operational requirements can limit the suitability of certain armor materials for specific applications or vehicle types. Furthermore, regulatory constraints and compliance requirements can pose challenges for manufacturers and end-users in terms of meeting stringent safety standards, certifications, and testing protocols. Ensuring that armor materials meet or exceed regulatory requirements often involves extensive testing and validation processes, which can add time and cost to the development and deployment of armored vehicles. Additionally, while advancements in armor materials continue to improve ballistic resistance and protection capabilities, there is an ongoing arms race between armor development and the advancement of weaponry. As adversaries develop more powerful and sophisticated weapons, there is a constant need for armor materials to keep pace with these evolving threats. This perpetual cycle of innovation and countermeasure development can pose challenges for the vehicle armor materials market, requiring continuous investment in research and development to stay ahead of emerging threats.

Opportunity: growing demand for lightweight and safety vehicles

One significant opportunity in the vehicle armor materials market lies in the growing demand for lightweight and high-performance armor solutions that offer enhanced protection without compromising vehicle performance. As advancements in material science and engineering continue to evolve, there is a burgeoning opportunity to develop innovative armor materials that are lighter, stronger, and more versatile than traditional options. These advanced materials can significantly improve the mobility, agility, and fuel efficiency of armored vehicles while providing superior protection against ballistic threats, explosive devices, and other security risks. Furthermore, there is an increasing focus on modular and scalable armor solutions that can be tailored to meet specific mission requirements and threat scenarios. This presents an opportunity for manufacturers to develop customizable armor systems that can be easily integrated into a variety of vehicle platforms, from military tanks and personnel carriers to civilian SUVs and commercial trucks. By offering modular armor solutions, manufacturers can cater to diverse end-user needs and provide flexibility in vehicle design and configuration. Additionally, the growing adoption of additive manufacturing (3D printing) technologies presents a significant opportunity for innovation in the vehicle armor materials market. Additive manufacturing allows for the rapid prototyping and production of complex geometries and customized armor components, enabling manufacturers to create lightweight and optimized armor solutions with reduced lead times and production costs. This technology also facilitates the development of next-generation armor materials with improved performance characteristics, such as increased strength, durability, and impact resistance. Moreover, the expanding market for armored civilian vehicles, driven by concerns over personal security and the protection of high-profile individuals, government officials, and corporate executives, presents a lucrative opportunity for manufacturers of vehicle armor materials. As the demand for armored passenger cars, SUVs, and commercial vehicles continues to rise, there is a growing need for advanced armor materials that offer discreet protection while maintaining the aesthetics and functionality of the vehicle.

Challenge: increasing safety standards and certifications is a challenge for the vehicle armor materials market

Ensuring compliance with stringent safety standards, certifications, and testing protocols poses significant challenges for manufacturers and end-users in the vehicle armor materials market. This process involves rigorous testing and validation procedures to ensure that armor materials meet regulatory requirements and performance standards. Manufacturers must adhere to a myriad of regulations and specifications set forth by government agencies, international organizations, and industry standards bodies, which can vary widely depending on the intended application and geographical location. The testing and validation process typically encompasses various aspects of armor performance, including ballistic resistance, blast protection, durability, environmental resilience, and material properties. Testing procedures may involve subjecting armor materials to simulated ballistic impacts, explosive blasts, extreme temperatures, corrosive environments, and mechanical stresses to evaluate their effectiveness and reliability under real-world conditions. Additionally, materials must undergo thorough examination to assess factors such as weight, thickness, composition, and compatibility with vehicle structures and systems.

The complexity and thoroughness of these testing protocols contribute to the time-consuming and costly nature of compliance efforts. Manufacturers must invest substantial resources in specialized testing facilities, equipment, and personnel to conduct comprehensive evaluations of armor materials. Moreover, obtaining certifications and approvals from regulatory authorities often requires extensive documentation, data analysis, and review processes, further adding to the administrative burden and lead times associated with compliance. For end-users, ensuring that armored vehicles meet or exceed regulatory requirements is essential to ensure the safety and effectiveness of personnel and assets in operational environments. However, navigating the intricate landscape of safety standards and certification processes can be daunting, particularly for organizations with limited expertise or resources in this area. Compliance efforts may involve collaboration with third-party testing laboratories, consulting firms, or regulatory agencies to navigate the complex regulatory landscape and streamline the certification process. Despite the challenges posed by stringent safety standards and testing protocols, compliance is critical to maintaining the integrity and reliability of armored vehicles. Adhering to established regulations and standards helps to mitigate risks, ensure product quality, and instill confidence in end-users regarding the performance and effectiveness of armor materials. By investing in robust testing and validation processes, manufacturers and end-users can demonstrate their commitment to safety, quality, and regulatory compliance, ultimately enhancing the credibility and competitiveness of armored vehicles in the marketplace.

Market Ecosystem

The market ecosystem for vehicle armor materials is composed of a diverse array of entities and stakeholders that collectively contribute to the development, implementation, and advancement of vehicle armor materials materials. At the core of this ecosystem are material providers who focus on research, development, and manufacturing of electronic wet chemicals. They continuously innovate and produce novel materials and their applications to meet the evolving demands of the market.

DuPont de Nemours, Inc.(US), Saint-Gobain SA (France), ATI, Inc. (US), Honeywell International Inc. (US), Teijin Limited (Japan), Alcoa Corporation (US), Tata Steel Limited (India), Ceramtec (Germany), SAAB AB (Sweden), Morgan Advanced Materials (UK).

Vehicle Armor Materials Market: Ecosystem

Vehicle Armor Materials Market Ecosystem

Source: Secondary Research, Interviews with Experts, and MarketsandMarkets Analysis

"metals & alloys is the largest sub-segment amongst the type segment in the vehicle armor materials market in 2024, in terms of value."

Metals and alloys constitute the largest segment in the vehicle armor materials market due to several key factors that underscore their widespread use and effectiveness in providing ballistic protection. Firstly, metals such as steel, aluminum, and titanium have long been recognized for their inherent strength, durability, and versatility, making them foundational materials for armored vehicle construction. These metals offer robust ballistic resistance against a wide range of threats, including bullets, shrapnel, and explosive blasts, making them ideal for applications where reliable protection is paramount. Additionally, metals and alloys offer advantages in terms of cost-effectiveness and accessibility compared to alternative armor materials. The availability of raw materials, established manufacturing processes, and mature supply chains contribute to the affordability and widespread adoption of metal-based armor solutions. Moreover, metals can be easily formed, shaped, and welded to create custom armor components tailored to fit specific vehicle configurations and protection requirements, offering flexibility and adaptability in design and integration. Furthermore, metals and alloys provide versatility in armor design, allowing for the development of multi-layered or composite armor systems that combine different metal alloys to optimize protection and performance. For example, high-strength steel alloys can be combined with lightweight aluminum alloys to achieve a balance between ballistic resistance and vehicle weight, ensuring optimal mobility and survivability on the battlefield. Similarly, titanium alloys offer superior strength-to-weight ratios, making them well-suited for lightweight armor applications where reducing vehicle mass is critical. Moreover, metals and alloys exhibit excellent compatibility with other armor materials, such as ceramics, polymers, and composite materials, enabling the creation of hybrid armor solutions that leverage the unique properties of each material. This synergistic approach enhances overall protection levels while minimizing weight and thickness, a crucial consideration for armored vehicles seeking to optimize performance without compromising protection.

“defense accounted for the largest by application share of the vehicle armor materials market in 2024” in terms of value.

The defense sector stands as the largest segment of the vehicle armor materials market due to several key factors that uniquely position it as the primary driver of demand within the industry. Firstly, defense organizations worldwide prioritize the protection of military personnel and assets, necessitating the deployment of armored vehicles equipped with advanced protective solutions. The nature of modern warfare, characterized by asymmetrical threats, guerrilla tactics, and the proliferation of sophisticated weaponry, underscores the critical importance of effective armor materials in safeguarding against ballistic, blast, and improvised explosive device (IED) threats. Furthermore, defense budgets allocated by governments and international organizations prioritize investments in vehicle armor materials as part of broader defense modernization efforts. With significant financial resources dedicated to enhancing military capabilities and ensuring force readiness, defense procurement programs drive substantial demand for state-of-the-art armor technologies. This sustained investment enables defense contractors and material suppliers to innovate and develop advanced armor materials that meet the stringent requirements of military specifications and standards. The defense sector's prominence in the vehicle armor materials market is also underscored by its unique operational requirements and mission profiles. Military vehicles must withstand a wide range of threats while maintaining mobility, agility, and operational effectiveness in diverse environments. This necessitates the use of lightweight yet durable materials that offer superior protection without compromising vehicle performance. Additionally, the need for interoperability and compatibility with existing vehicle platforms further drives demand for armor materials that can be seamlessly integrated into various defense systems and vehicle architectures. Moreover, the defense sector serves as a catalyst for technological innovation and research in armor materials. Defense contractors collaborate with leading material scientists, research institutions, and technology companies to develop cutting-edge solutions that push the boundaries of material science and engineering. These collaborative efforts result in continuous advancements in armor materials, including lightweight composites, advanced ceramics, and high-strength alloys, which not only enhance protection but also contribute to overall vehicle performance and survivability.

"Asia pacific is the fastest growing market for vehicle armor materials Market in 2024, in terms of value."

The Asia-Pacific region stands out as the largest market for vehicle armor materials owing to a convergence of factors that shape its unique landscape. Firstly, the region has witnessed a significant wave of military modernization initiatives among key nations such as China, India, South Korea, and Japan. These efforts are driven by a desire to bolster defense capabilities in response to evolving security challenges, thereby fueling the demand for advanced armored vehicles equipped with cutting-edge protective materials.

Moreover, the Asia-Pacific region is marked by persistent geopolitical tensions and conflicts, including territorial disputes like those in the South China Sea. Such geopolitical dynamics create a continuous need for robust military equipment, including armored vehicles, to safeguard territorial integrity and national interests, further propelling the demand for vehicle armor materials.

Economic growth plays a pivotal role in driving the demand for vehicle armor materials across the region. The rapid economic expansion witnessed in countries throughout Asia-Pacific has translated into increased defense budgets, enabling greater investment in sophisticated defense technologies. This economic prosperity not only supports domestic research and development efforts but also facilitates partnerships with international suppliers to access state-of-the-art armor materials. In addition to military applications, the Asia-Pacific region experiences heightened security concerns stemming from terrorism, insurgency, and asymmetric warfare. Governments and private entities alike seek to safeguard personnel and assets against these threats, driving the adoption of armored vehicles across various sectors, including law enforcement, VIP protection, and transportation of valuable goods. Furthermore, the presence of a robust industrial base in countries like South Korea, Japan, and China contributes significantly to the region's dominance in the vehicle armor materials market. This industrial prowess enables local production of advanced armor materials, fostering a competitive edge and reducing dependence on imports.

Vehicle Armor Materials Market by Region

To know about the assumptions considered for the study, download the pdf brochure

Key Market Players

The key players in thismarket are DuPont de Nemours, Inc.(US), Saint-Gobain SA (France), ATI, Inc. (US), Honeywell International Inc. (US), Teijin Limited (Japan), Alcoa Corporation (US), Tata Steel Limited (India), Ceramtec (Germany), SAAB AB (Sweden), Morgan Advanced Materials (UK) etc. Continuous developments in the market—including new product launches, mergers & acquisitions, agreements, and expansions—are expected to help the market grow. Leading manufacturers of vehicle armor materials have opted for new product launches to sustain their market position.

Read More: Vehicle Armor Materials Companies

Get online access to the report on the World's First Market Intelligence Cloud

  • Easy to Download Historical Data & Forecast Numbers
  • Company Analysis Dashboard for high growth potential opportunities
  • Research Analyst Access for customization & queries
  • Competitor Analysis with Interactive dashboard
  • Latest News, Updates & Trend analysis
Request Sample

Scope of the Report

Report Metric

Details

Years considered for the study

2020-2029

Base Year

2023

Forecast period

2024–2029

Units considered

Value (USD Billion/Million), Volume (Kiloton)

Segments

Type, Application and Region

Regions

Asia Pacific, North America, Europe, Middle East & Africa, and South America

Companies

DuPont de Nemours, Inc.(US), Saint-Gobain SA (France), ATI, Inc. (US), Honeywell International Inc. (US), Teijin Limited (Japan), Alcoa Corporation (US), Tata Steel Limited (India), Ceramtec (Germany), SSAB AB (Sweden), Morgan Advanced Materials (UK).

Segmentation

This report categorizes the global Vehicle armor materials market based on type, application, form, end-use industry and region.

On the basis of type, the market has been segmented as follows:
  • Metal & Alloys
  • Ceramics
  • Composites
  • Aramid Fiber
  • Fiberglass
  • Others
On the basis of application, the market has been segmented as follows:
  • Defence
  • Para Military
  • Police
  • Security Agencies
  • Personal
  • Others
On the basis of region, the market has been segmented as follows:
  • North America
  • Europe
  • Asia Pacific
  • Middle East & Africa
  • South America

Recent Developments

  • Honeywell Acquires Roxel (June 2023): This acquisition expanded Honeywell's portfolio of lightweight armor solutions, particularly composite armor technologies for military and civilian applications.
  • BAE Systems Acquires Bohemia Interactive Simulations (August 2023): While not directly related to armor materials, this acquisition strengthens BAE's capabilities in virtual training and simulation, which can impact armor development and testing processes.
  • U.S. Army & Carnegie Mellon University (CMU) Partner on 3D-Printed Armor (September 2023): This collaboration seeks to develop 3D-printed armor parts with customized designs and lighter weight, potentially revolutionizing armor manufacturing.
  • BAE Systems & TenCate Collaborate on Advanced Composites for Vehicles (October 2023): This partnership focuses on developing next-generation composite materials with superior ballistic resistance and weight properties for armored vehicles.
  • Nexter & Elbit Systems Partner on Armored Vehicle Technologies (November 2023): This collaboration aims to explore and develop innovative armor solutions and combat systems for armored vehicles across various applications.
  • Rheinmetall Waagenbau GmbH Merges with Rheinmetall Canada Inc. (October 2023): This merger aims to streamline operations and strengthen Rheinmetall's position in the North American armored vehicle market, potentially leading to further collaborations with material suppliers.
  • Honeywell: In July 2023, Honeywell announced a $120 million expansion of its composite armor manufacturing facility in Gastonia, North Carolina. This expansion aims to increase production capacity for military and civilian armor applications.
  • CeramTec: In February 2023, CeramTec expanded its ceramic armor materials production facility in Elkridge, Maryland. This expansion focuses on meeting the growing demand for advanced ceramic armor solutions for military and law enforcement applications.

Frequently Asked Questions (FAQ):

To speak to our analyst for a discussion on the above findings, click Speak to Analyst

TABLE OF CONTENTS
 
1 INTRODUCTION (Page No. - 30)
    1.1 STUDY OBJECTIVES 
    1.2 MARKET DEFINITION 
    1.3 INCLUSIONS & EXCLUSIONS 
    1.4 MARKET SCOPE 
          FIGURE 1 VEHICLE ARMOR MATERIALS MARKET SEGMENTATION
           1.4.1 REGIONS COVERED
           1.4.2 YEARS CONSIDERED
    1.5 CURRENCY CONSIDERED 
    1.6 UNITS CONSIDERED 
    1.7 LIMITATIONS 
    1.8 STAKEHOLDERS 
 
2 RESEARCH METHODOLOGY (Page No. - 34)
    2.1 RESEARCH DATA 
          FIGURE 2 VEHICLE ARMOR MATERIALS MARKET: RESEARCH DESIGN
           2.1.1 SECONDARY DATA
                    2.1.1.1 Key data from secondary sources
           2.1.2 PRIMARY DATA
                    2.1.2.1 Primary data sources
                    2.1.2.2 Key vehicle armor material manufacturers
                    2.1.2.3 Breakdown of interviews with experts
                    2.1.2.4 Key industry insights
    2.2 BASE NUMBER CALCULATION 
           2.2.1 APPROACH 1: SUPPLY-SIDE ANALYSIS
           2.2.2 APPROACH 2: DEMAND-SIDE ANALYSIS
    2.3 FORECAST NUMBER CALCULATION 
           2.3.1 SUPPLY SIDE
           2.3.2 DEMAND SIDE
    2.4 MARKET SIZE ESTIMATION 
          FIGURE 3 MARKET SIZE ESTIMATION METHODOLOGY: REVENUE OF MARKET PLAYERS
           2.4.1 BOTTOM-UP APPROACH
           2.4.2 TOP-DOWN APPROACH
    2.5 DATA TRIANGULATION 
          FIGURE 4 VEHICLE ARMOR MATERIALS MARKET: DATA TRIANGULATION
    2.6 ASSUMPTIONS 
    2.7 RECESSION IMPACT 
    2.8 GROWTH FORECAST 
    2.9 RISK ASSESSMENT 
 
3 EXECUTIVE SUMMARY (Page No. - 44)
    FIGURE 5 METALS & ALLOYS SEGMENT TO DOMINATE MARKET BETWEEN 2024 AND 2029
    FIGURE 6 DEFENSE APPLICATION TO LEAD MARKET BETWEEN 2024 AND 2029
    FIGURE 7 ASIA PACIFIC TO DOMINATE MARKET DURING FORECAST PERIOD
 
4 PREMIUM INSIGHTS (Page No. - 48)
    4.1 ATTRACTIVE OPPORTUNITIES FOR PLAYERS IN VEHICLE ARMOR MATERIALS MARKET 
          FIGURE 8 GROWING DEMAND FROM DEFENSE AND PARAMILITARY SECTORS TO DRIVE MARKET
    4.2 VEHICLE ARMOR MATERIALS MARKET, BY TYPE 
          FIGURE 9 METALS & ALLOYS TO BE FASTEST-GROWING SEGMENT DURING  FORECAST PERIOD
    4.3 VEHICLE ARMOR MATERIALS MARKET, BY COUNTRY 
          FIGURE 10 INDIA TO BE FASTEST-GROWING MARKET DURING FORECAST PERIOD
 
5 MARKET OVERVIEW (Page No. - 50)
    5.1 INTRODUCTION 
    5.2 MARKET DYNAMICS 
          FIGURE 11 DRIVERS, RESTRAINTS, OPPORTUNITIES, AND CHALLENGES IN VEHICLE ARMOR MATERIALS MARKET
           5.2.1 DRIVERS
                    5.2.1.1 Military modernization programs in developed economies
                    5.2.1.2 Growing security concern for commercial vehicles
                    5.2.1.3 Growing urban warfare and asymmetric threat
           5.2.2 RESTRAINTS
                    5.2.2.1 Stringent regulatory framework
           5.2.3 OPPORTUNITIES
                    5.2.3.1 Developments in defense & military sector
                    5.2.3.2 Need for customized armored vehicles
                    5.2.3.3 Changing battlefield scenario
           5.2.4 CHALLENGES
                    5.2.4.1 High cost of lightweight armor materials
    5.3 PORTER'S FIVE FORCES ANALYSIS 
          TABLE 1 VEHICLE ARMOR MATERIALS MARKET: PORTER'S FIVE FORCES ANALYSIS
           5.3.1 THREAT OF SUBSTITUTES
           5.3.2 THREAT OF NEW ENTRANTS
           5.3.3 BARGAINING POWER OF SUPPLIERS
           5.3.4 BARGAINING POWER OF BUYERS
           5.3.5 INTENSITY OF COMPETITIVE RIVALRY
                    FIGURE 12 PORTER'S FIVE FORCES ANALYSIS: VEHICLE ARMOR MATERIALS MARKET
    5.4 TRENDS/DISRUPTIONS IMPACTING CUSTOMER BUSINESS 
           5.4.1 REVENUE SHIFT AND NEW REVENUE POCKETS FOR VEHICLE ARMOR MATERIAL MANUFACTURERS
                    FIGURE 13 REVENUE SHIFT AND NEW REVENUE POCKETS IN VEHICLE ARMOR MATERIALS MARKET
    5.5 ECOSYSTEM MAP 
          TABLE 2 VEHICLE ARMOR MATERIALS MARKET: ROLE IN ECOSYSTEM
    5.6 TARIFF AND REGULATORY LANDSCAPE 
           5.6.1 REGULATORY BODIES, GOVERNMENT AGENCIES, AND OTHER ORGANIZATIONS
                    TABLE 3 NORTH AMERICA: LIST OF REGULATORY BODIES, GOVERNMENT AGENCIES, AND OTHER ORGANIZATIONS
                    TABLE 4 EUROPE: LIST OF REGULATORY BODIES, GOVERNMENT AGENCIES,  AND OTHER ORGANIZATIONS
                    TABLE 5 ASIA PACIFIC: LIST OF REGULATORY BODIES, GOVERNMENT AGENCIES,  AND OTHER ORGANIZATIONS
                    TABLE 6 MIDDLE EAST & AFRICA: LIST OF REGULATORY BODIES, GOVERNMENT AGENCIES,  AND OTHER ORGANIZATIONS
                    TABLE 7 SOUTH AMERICA: LIST OF REGULATORY BODIES, GOVERNMENT AGENCIES, AND OTHER ORGANIZATIONS
           5.6.2 REGULATIONS RELATED TO VEHICLE ARMOR MATERIALS MARKET
                    TABLE 8 LIST OF REGULATIONS FOR VEHICLE ARMOR MATERIALS MARKET
    5.7 VALUE CHAIN ANALYSIS 
          FIGURE 14 VEHICLE ARMOR MATERIALS MARKET: VALUE CHAIN ANALYSIS
           5.7.1 RAW MATERIAL SUPPLIERS
           5.7.2 RESEARCH AND DEVELOPMENT
                    5.7.2.1 Material processing and development
                    5.7.2.2 Design and engineering
           5.7.3 APPLICATION/FORMULATORS
                    5.7.3.1 Manufacturing and production
                    5.7.3.2 Testing and certification
                    5.7.3.3 Distribution, integration, and installation
                    5.7.3.4 Aftermarket support and services
           5.7.4 END USERS
    5.8 INVESTMENT AND FUNDING 
          FIGURE 15 INVESTMENT AND FUNDING SCENARIO: VEHICLE ARMOR MATERIALS MARKET
    5.9 TECHNOLOGY ANALYSIS 
          TABLE 9 TECHNOLOGIES USED IN VEHICLE ARMOR MATERIALS MARKET
    5.10 PRICING ANALYSIS 
           5.10.1 AVERAGE SELLING PRICE TREND, BY REGION
                     TABLE 10 AVERAGE SELLING PRICE, BY REGION, 2020–2029 (USD/KG)
                     FIGURE 16 VEHICLE ARMOR MATERIALS MARKET: AVERAGE SELLING PRICE TREND, BY REGION
           5.10.2 AVERAGE SELLING PRICE, BY TYPE
                     TABLE 11 AVERAGE SELLING PRICE, BY TYPE, 2020–2029 (USD/KG)
           5.10.3 AVERAGE SELLING PRICE OF KEY PLAYERS, BY TOP THREE TYPES
                     TABLE 12 AVERAGE SELLING PRICE OF KEY PLAYERS, BY TYPE, (USD/KG)
                     FIGURE 17 AVERAGE SELLING PRICE OF KEY PLAYERS, BY TOP THREE TYPES
    5.11 PATENT ANALYSIS 
           5.11.1 METHODOLOGY
           5.11.2 PATENTS GRANTED WORLDWIDE, 2014–2024
                     TABLE 13 VEHICLE ARMOR MATERIALS MARKET: TOTAL NUMBER OF PATENTS
           5.11.3 PATENT PUBLICATION TRENDS
                     FIGURE 18 NUMBER OF PATENTS GRANTED (2014−2023)
           5.11.4 INSIGHTS
           5.11.5 LEGAL STATUS OF PATENTS
                     FIGURE 19 VEHICLE ARMOR MATERIALS MARKET: LEGAL STATUS OF PATENTS
           5.11.6 JURISDICTION ANALYSIS
                     FIGURE 20 PATENTS ANALYSIS FOR VEHICLE ARMOR MATERIALS, BY JURISDICTION (2014−2023)
           5.11.7 TOP COMPANIES/APPLICANTS
                     FIGURE 21 TOP 10 COMPANIES WITH HIGHEST NUMBER OF PATENTS IN LAST 10 YEARS
                     TABLE 14 LIST OF MAJOR PATENT OWNERS FOR VEHICLE ARMOR MATERIALS
           5.11.8 LIST OF MAJOR PATENTS
                     TABLE 15 MAJOR PATENTS FOR VEHICLE ARMOR MATERIALS
    5.12 TRADE ANALYSIS 
           5.12.1 IMPORT SCENARIO
                     FIGURE 22 IMPORT OF VEHICLE ARMOR MATERIALS, BY COUNTRY, 2019–2022 (USD MILLION)
           5.12.2 EXPORT SCENARIO
                     FIGURE 23 EXPORT OF VEHICLE ARMOR MATERIALS, BY COUNTRY, 2019–2022 (USD MILLION)
    5.13 CASE STUDY ANALYSIS 
           5.13.1 ADOPTION OF DESIGN FOR ARMORING TO OPTIMIZE PROTECTION
                    5.13.1.1 Objective
                    5.13.1.2 Solution statement
                    5.13.1.3 Conclusion
    5.14 KEY CONFERENCES & EVENTS, 2024–2025 
           TABLE 16 VEHICLE ARMOR MATERIALS MARKET: DETAILED LIST OF CONFERENCES & EVENTS
    5.15 KEY STAKEHOLDERS AND BUYING CRITERIA 
           5.15.1 KEY STAKEHOLDERS IN BUYING PROCESS
                     FIGURE 24 INFLUENCE OF STAKEHOLDERS ON BUYING PROCESS FOR TOP THREE APPLICATIONS
                     TABLE 17 INFLUENCE OF STAKEHOLDERS ON BUYING PROCESS FOR TOP THREE APPLICATIONS (%)
           5.15.2 BUYING CRITERIA
                     FIGURE 25 KEY BUYING CRITERIA FOR TOP THREE APPLICATIONS
                     TABLE 18 KEY BUYING CRITERIA FOR TOP THREE APPLICATIONS
 
6 VEHICLE ARMOR MATERIALS MARKET, BY TYPE (Page No. - 79)
    6.1 INTRODUCTION 
          FIGURE 26 METALS & ALLOYS TO ACCOUNT FOR LARGEST SHARE OF VEHICLE ARMOR MATERIALS MARKET
          TABLE 19 VEHICLE ARMOR MATERIALS MARKET, BY TYPE, 2020–2023 (USD MILLION)
          TABLE 20 VEHICLE ARMOR MATERIALS MARKET, BY TYPE, 2024–2029 (USD MILLION)
          TABLE 21 VEHICLE ARMOR MATERIALS MARKET, BY TYPE, 2020–2023 (KILOTON)
          TABLE 22 VEHICLE ARMOR MATERIALS MARKET, BY TYPE, 2024–2029 (KILOTON)
    6.2 METALS & ALLOYS 
           6.2.1 NEED FOR EXTENSIVE SHIELDING ON TANKS AND VEHICLES TO DRIVE DEMAND FOR METAL ARMOR
           6.2.2 TITANIUM
           6.2.3 ALUMINIUM
           6.2.4 HIGH-DENSITY STEEL
    6.3 CERAMICS 
           6.3.1 PROVIDE HARDNESS AS WELL AS HEAT RESISTANCE PROPERTIES TO ARMOR
           6.3.2 ALUMINUM OXIDE
           6.3.3 SILICON CARBIDE
           6.3.4 BORON CARBIDE
           6.3.5 CERAMIC MATRIX COMPOSITES
           6.3.6 OTHERS
    6.4 COMPOSITES 
           6.4.1 DEMAND FOR COMPOSITES IN VEHICLE ARMOR DRIVEN  BY THEIR LIGHTWEIGHT, STRENGTH, AND FLEXIBILITY
           6.4.2 FIBERS
           6.4.3 FABRICS
           6.4.4 MATRIX MATERIALS
           6.4.5 PREPREGS
           6.4.6 HYBRID COMPOSITES
           6.4.7 3D COMPOSITES
    6.5 ARAMID FIBER 
           6.5.1 DEMAND FOR ARAMID FIBER INCREASING IN VEHICLE ARMOR DUE TO ITS FLEXIBILITY
    6.6 FIBERGLASS 
           6.6.1 AUTOMOTIVE INDUSTRY EXTENSIVELY USING FIBERGLASS FOR VEHICLE ARMOR DUE TO ITS LIGHTWEIGHT NATURE
    6.7 OTHER TYPES 
 
7 VEHICLE ARMOR MATERIALS MARKET, BY APPLICATION (Page No. - 88)
    7.1 INTRODUCTION 
          FIGURE 27 DEFENSE TO BE LARGEST APPLICATION OF VEHICLE ARMOR MATERIALS MARKET
          TABLE 23 VEHICLE ARMOR MATERIALS MARKET, BY APPLICATION, 2020–2023 (USD MILLION)
          TABLE 24 VEHICLE ARMOR MATERIALS MARKET, BY APPLICATION, 2024–2029 (USD MILLION)
    7.2 DEFENSE 
           7.2.1 DEFENSE TO BE FASTEST-GROWING END USER OF VEHICLE ARMOR MATERIALS
    7.3 PARAMILITARY 
           7.3.1 ARMORED VEHICLES WIDELY USED TO SAFEGUARD PERSONNEL IN HIGH-RISK ENVIRONMENTS
    7.4 POLICE 
           7.4.1 INCREASING CONCERN FOR SAFETY AND PROTECTION OF LAW ENFORCEMENT OFFICERS TO DRIVE GROWTH
    7.5 SECURITY AGENCIES 
           7.5.1 DEMAND FOR ARMOR MATERIAL TO WITNESS SIGNIFICANT GROWTH IN SECURITY AGENCIES SEGMENT
    7.6 PERSONAL 
           7.6.1 HIGH CRIME RATES AND ACCIDENTS DRIVING DEMAND FOR SAFE AND ARMORED VEHICLES
    7.7 OTHER APPLICATIONS 
 
8 VEHICLE ARMOR MATERIALS MARKET, BY REGION (Page No. - 93)
    8.1 INTRODUCTION 
          FIGURE 28 ASIA PACIFIC TO BE FASTEST-GROWING MARKET DURING FORECAST PERIOD
          TABLE 25 VEHICLE ARMOR MATERIALS MARKET, BY REGION, 2020–2023 (USD MILLION)
          TABLE 26 VEHICLE ARMOR MATERIALS MARKET, BY REGION, 2024–2029 (USD MILLION)
          TABLE 27 VEHICLE ARMOR MATERIALS MARKET, BY REGION, 2020–2023 (KILOTON)
          TABLE 28 VEHICLE ARMOR MATERIALS MARKET, BY REGION, 2024–2029 (KILOTON)
          TABLE 29 VEHICLE ARMOR MATERIALS MARKET, BY TYPE, 2020–2023 (USD MILLION)
          TABLE 30 VEHICLE ARMOR MATERIALS MARKET, BY TYPE, 2024–2029 (USD MILLION)
          TABLE 31 VEHICLE ARMOR MATERIALS MARKET, BY TYPE, 2020–2023 (KILOTON)
          TABLE 32 VEHICLE ARMOR MATERIALS MARKET, BY TYPE, 2024–2029 (KILOTON)
          TABLE 33 VEHICLE ARMOR MATERIALS MARKET, BY APPLICATION, 2020–2023 (USD MILLION)
          TABLE 34 VEHICLE ARMOR MATERIALS MARKET, BY APPLICATION, 2024–2029 (USD MILLION)
    8.2 ASIA PACIFIC 
           8.2.1 RECESSION IMPACT
                    FIGURE 29 ASIA PACIFIC: VEHICLE ARMOR MATERIALS MARKET SNAPSHOT
                    TABLE 35 ASIA PACIFIC: VEHICLE ARMOR MATERIALS MARKET, BY COUNTRY,  2020–2023 (USD MILLION)
                    TABLE 36 ASIA PACIFIC: VEHICLE ARMOR MATERIALS MARKET, BY COUNTRY,  2024–2029 (USD MILLION)
                    TABLE 37 ASIA PACIFIC: VEHICLE ARMOR MATERIALS MARKET, BY COUNTRY,  2020–2023 (KILOTON)
                    TABLE 38 ASIA PACIFIC: VEHICLE ARMOR MATERIALS MARKET, BY COUNTRY,  2024–2029 (KILOTON)
                    TABLE 39 ASIA PACIFIC: VEHICLE ARMOR MATERIALS MARKET, BY TYPE,  2020–2023 (USD MILLION)
                    TABLE 40 ASIA PACIFIC: VEHICLE ARMOR MATERIALS MARKET, BY TYPE,  2024–2029 (USD MILLION)
                    TABLE 41 ASIA PACIFIC: VEHICLE ARMOR MATERIALS MARKET, BY TYPE, 2020–2023 (KILOTON)
                    TABLE 42 ASIA PACIFIC: VEHICLE ARMOR MATERIALS MARKET, BY TYPE, 2024–2029 (KILOTON)
                    TABLE 43 ASIA PACIFIC: VEHICLE ARMOR MATERIALS MARKET, BY APPLICATION, 2020–2023 (USD MILLION)
                    TABLE 44 ASIA PACIFIC: VEHICLE ARMOR MATERIALS MARKET, BY APPLICATION, 2024–2029 (USD MILLION)
                    8.2.1.1 China
                               8.2.1.1.1 Significant capital investment to drive market
                                              TABLE 45 CHINA: VEHICLE ARMOR MATERIALS MARKET, BY APPLICATION, 2020–2023 (USD MILLION)
                                              TABLE 46 CHINA: VEHICLE ARMOR MATERIALS MARKET, BY APPLICATION, 2024–2029 (USD MILLION)
                    8.2.1.2 JAPAN
                               8.2.1.2.1 Technological developments to drive market
                                              TABLE 47 JAPAN: VEHICLE ARMOR MATERIALS MARKET, BY APPLICATION, 2020–2023 (USD MILLION)
                                              TABLE 48 JAPAN: VEHICLE ARMOR MATERIALS MARKET, BY APPLICATION, 2024–2029 (USD MILLION)
                    8.2.1.3 SOUTH KOREA
                               8.2.1.3.1 Growing private sector and investment by public companies to drive market
                                              TABLE 49 SOUTH KOREA: VEHICLE ARMOR MATERIALS MARKET, BY APPLICATION, 2020–2023 (USD MILLION)
                                              TABLE 50 SOUTH KOREA: VEHICLE ARMOR MATERIALS MARKET, BY APPLICATION, 2024–2029 (USD MILLION)
                    8.2.1.4 INDIA
                               8.2.1.4.1 Increasing demand for cash-in-transit and VIP protection vehicles to drive market
                                              TABLE 51 INDIA: VEHICLE ARMOR MATERIALS MARKET, BY APPLICATION, 2020–2023 (USD MILLION)
                                              TABLE 52 INDIA: VEHICLE ARMOR MATERIALS MARKET, BY APPLICATION, 2024–2029 (USD MILLION)
                    8.2.1.5 Rest of Asia Pacific
                                TABLE 53 REST OF ASIA PACIFIC: VEHICLE ARMOR MATERIALS MARKET, BY APPLICATION, 2020–2023 (USD MILLION)
                                TABLE 54 REST OF ASIA PACIFIC: VEHICLE ARMOR MATERIALS MARKET, BY APPLICATION, 2024–2029 (USD MILLION)
    8.3 NORTH AMERICA 
           8.3.1 RECESSION IMPACT
                    FIGURE 30 NORTH AMERICA: VEHICLE ARMOR MATERIALS MARKET SNAPSHOT
                    TABLE 55 NORTH AMERICA: VEHICLE ARMOR MATERIALS MARKET, BY COUNTRY, 2020–2023 (USD MILLION)
                    TABLE 56 NORTH AMERICA: VEHICLE ARMOR MATERIALS MARKET, BY COUNTRY, 2024–2029 (USD MILLION)
                    TABLE 57 NORTH AMERICA: VEHICLE ARMOR MATERIALS MARKET, BY COUNTRY, 2020–2023 (KILOTON)
                    TABLE 58 NORTH AMERICA: VEHICLE ARMOR MATERIALS MARKET, BY COUNTRY, 2024–2029 (KILOTON)
                    TABLE 59 NORTH AMERICA: VEHICLE ARMOR MATERIALS MARKET, BY TYPE, 2020–2023 (USD MILLION)
                    TABLE 60 NORTH AMERICA: VEHICLE ARMOR MATERIALS MARKET, BY TYPE, 2024–2029 (USD MILLION)
                    TABLE 61 NORTH AMERICA: VEHICLE ARMOR MATERIALS MARKET, BY TYPE, 2020–2023 (KILOTON)
                    TABLE 62 NORTH AMERICA: VEHICLE ARMOR MATERIALS MARKET, BY TYPE, 2024–2029 (KILOTON)
                    TABLE 63 NORTH AMERICA: VEHICLE ARMOR MATERIALS MARKET, BY APPLICATION, 2020–2023 (USD MILLION)
                    TABLE 64 NORTH AMERICA: VEHICLE ARMOR MATERIALS MARKET, BY APPLICATION, 2024–2029 (USD MILLION)
                    8.3.1.1 US
                               8.3.1.1.1 High military spending and constant research for upgrading military equipment to drive market
                                              TABLE 65 US: VEHICLE ARMOR MATERIALS MARKET, BY APPLICATION, 2020–2023 (USD MILLION)
                                              TABLE 66 US: VEHICLE ARMOR MATERIALS MARKET, BY APPLICATION, 2024–2029 (USD MILLION)
                    8.3.1.2 Canada
                               8.3.1.2.1 Increasing investment in industrial sectors to drive market
                                              TABLE 67 CANADA: VEHICLE ARMOR MATERIALS MARKET, BY APPLICATION, 2020–2023 (USD MILLION)
                                              TABLE 68 CANADA: VEHICLE ARMOR MATERIALS MARKET, BY APPLICATION, 2024–2029 (USD MILLION)
                    8.3.1.3 Mexico
                               8.3.1.3.1 Increasing presence of armor manufacturing companies to drive market
                                              TABLE 69 MEXICO: VEHICLE ARMOR MATERIALS MARKET, BY APPLICATION, 2020–2023 (USD MILLION)
                                              TABLE 70 MEXICO: VEHICLE ARMOR MATERIALS MARKET, BY APPLICATION, 2024–2029 (USD MILLION)
    8.4 EUROPE 
           8.4.1 RECESSION IMPACT
                    FIGURE 31 EUROPE: VEHICLE ARMOR MATERIALS MARKET SNAPSHOT
                    TABLE 71 EUROPE: VEHICLE ARMOR MATERIALS MARKET, BY COUNTRY,  2020–2023 (USD MILLION)
                    TABLE 72 EUROPE: VEHICLE ARMOR MATERIALS MARKET, BY COUNTRY,  2024–2029 (USD MILLION)
                    TABLE 73 EUROPE: VEHICLE ARMOR MATERIALS MARKET, BY COUNTRY, 2020–2023 (KILOTON)
                    TABLE 74 EUROPE: VEHICLE ARMOR MATERIALS MARKET, BY COUNTRY, 2024–2029 (KILOTON)
                    TABLE 75 EUROPE: VEHICLE ARMOR MATERIALS MARKET, BY TYPE, 2020–2023 (USD MILLION)
                    TABLE 76 EUROPE: VEHICLE ARMOR MATERIALS MARKET, BY TYPE, 2024–2029 (USD MILLION)
                    TABLE 77 EUROPE: VEHICLE ARMOR MATERIALS MARKET, BY TYPE, 2020–2023 (KILOTON)
                    TABLE 78 EUROPE: VEHICLE ARMOR MATERIALS MARKET, BY TYPE, 2024–2029 (KILOTON)
                    TABLE 79 EUROPE: VEHICLE ARMOR MATERIALS MARKET, BY APPLICATION,  2020–2023 (USD MILLION)
                    TABLE 80 EUROPE: VEHICLE ARMOR MATERIALS MARKET, BY APPLICATION,  2024–2029 (USD MILLION)
                    8.4.1.1 Germany
                               8.4.1.1.1 Increasing procurement of defense equipment and vehicles to drive market
                                              TABLE 81 GERMANY: VEHICLE ARMOR MATERIALS MARKET, BY APPLICATION,  2020–2023 (USD MILLION)
                                              TABLE 82 GERMANY: VEHICLE ARMOR MATERIALS MARKET, BY APPLICATION,  2024–2029 (USD MILLION)
                    8.4.1.2 Italy
                               8.4.1.2.1 Heightened internal security and rising demand for civilian armored vehicles to drive market
                                              TABLE 83 ITALY: VEHICLE ARMOR MATERIALS MARKET, BY APPLICATION,  2020–2023 (USD MILLION)
                                              TABLE 84 ITALY: VEHICLE ARMOR MATERIALS MARKET, BY APPLICATION,  2024–2029 (USD MILLION)
                    8.4.1.3 France
                               8.4.1.3.1 Heightened geopolitical tensions and internal security to drive market
                                              TABLE 85 FRANCE: VEHICLE ARMOR MATERIALS MARKET, BY APPLICATION,  2020–2023 (USD MILLION)
                                              TABLE 86 FRANCE: VEHICLE ARMOR MATERIALS MARKET, BY APPLICATION,  2024–2029 (USD MILLION)
                    8.4.1.4 UK
                               8.4.1.4.1 Global economic recovery and development of new technologies to drive market
                                              TABLE 87 UK: VEHICLE ARMOR MATERIALS MARKET, BY APPLICATION, 2020–2023 (USD MILLION)
                                              TABLE 88 UK: VEHICLE ARMOR MATERIALS MARKET, BY APPLICATION, 2024–2029 (USD MILLION)
                    8.4.1.5 RUSSIA
                               8.4.1.5.1 Strong domestic demand for armor materials to drive market
                                              TABLE 89 RUSSIA: VEHICLE ARMOR MATERIALS MARKET, BY APPLICATION,  2020–2023 (USD MILLION)
                                              TABLE 90 RUSSIA: VEHICLE ARMOR MATERIALS MARKET, BY APPLICATION,  2024–2029 (USD MILLION)
                    8.4.1.6 SPAIN
                               8.4.1.6.1 Technological advancement and collaborative efforts to support market growth
                                              TABLE 91 SPAIN: VEHICLE ARMOR MATERIALS MARKET, BY APPLICATION,  2020–2023 (USD MILLION)
                                              TABLE 92 SPAIN: VEHICLE ARMOR MATERIALS MARKET, BY APPLICATION,  2024–2029 (USD MILLION)
                    8.4.1.7 Rest of Europe
                                TABLE 93 REST OF EUROPE: VEHICLE ARMOR MATERIALS MARKET, BY APPLICATION,  2020–2023 (USD MILLION)
                                TABLE 94 REST OF EUROPE: VEHICLE ARMOR MATERIALS MARKET, BY APPLICATION,  2024–2029 (USD MILLION)
    8.5 MIDDLE EAST & AFRICA 
           8.5.1 RECESSION IMPACT
                    TABLE 95 MIDDLE EAST & AFRICA: VEHICLE ARMOR MATERIALS MARKET, BY COUNTRY, 2020–2023 (USD MILLION)
                    TABLE 96 MIDDLE EAST & AFRICA: VEHICLE ARMOR MATERIALS MARKET, BY COUNTRY,  2024–2029 (USD MILLION)
                    TABLE 97 MIDDLE EAST & AFRICA: VEHICLE ARMOR MATERIALS MARKET, BY COUNTRY,  2020–2023 (KILOTON)
                    TABLE 98 MIDDLE EAST & AFRICA: VEHICLE ARMOR MATERIALS MARKET, BY COUNTRY,  2024–2029 (KILOTON)
                    TABLE 99 MIDDLE EAST & AFRICA: VEHICLE ARMOR MATERIALS MARKET, BY TYPE,  2020–2023 (USD MILLION)
                    TABLE 100 MIDDLE EAST & AFRICA: VEHICLE ARMOR MATERIALS MARKET, BY TYPE,  2024–2029 (USD MILLION)
                    TABLE 101 MIDDLE EAST & AFRICA: VEHICLE ARMOR MATERIALS MARKET, BY TYPE,  2020–2023 (KILOTON)
                    TABLE 102 MIDDLE EAST & AFRICA: VEHICLE ARMOR MATERIALS MARKET, BY TYPE,  2024–2029 (KILOTON)
                    TABLE 103 MIDDLE EAST & AFRICA: VEHICLE ARMOR MATERIALS MARKET, BY APPLICATION, 2020–2023 (USD MILLION)
                    TABLE 104 MIDDLE EAST & AFRICA: VEHICLE ARMOR MATERIALS MARKET, BY APPLICATION, 2024–2029 (USD MILLION)
                    8.5.1.1 SAUDI ARABIA
                               8.5.1.1.1 R&D investments and technological innovations to drive market
                                              TABLE 105 SAUDI ARABIA: VEHICLE ARMOR MATERIALS MARKET, BY APPLICATION,  2020–2023 (USD MILLION)
                                              TABLE 106 SAUDI ARABIA: VEHICLE ARMOR MATERIALS MARKET, BY APPLICATION,  2024–2029 (USD MILLION)
                    8.5.1.2 UAE
                               8.5.1.2.1 Defense to be largest and fastest-growing application during forecast period
                                              TABLE 107 UAE: VEHICLE ARMOR MATERIALS MARKET, BY APPLICATION,  2020–2023 (USD MILLION)
                                              TABLE 108 UAE: VEHICLE ARMOR MATERIALS MARKET, BY APPLICATION,  2024–2029 (USD MILLION)
                    8.5.1.3 REST OF GCC
                               8.5.1.3.1 Increased defense investments to drive market for vehicle armor materials
                                              TABLE 109 REST OF GCC: VEHICLE ARMOR MATERIALS MARKET, BY APPLICATION,  2020–2023 (USD MILLION)
                                              TABLE 110 REST OF GCC: VEHICLE ARMOR MATERIALS MARKET, BY APPLICATION,  2024–2029 (USD MILLION)
                    8.5.1.4 SOUTH AFRICA
                               8.5.1.4.1 Government initiatives and investments to drive market
                                              TABLE 111 SOUTH AFRICA: VEHICLE ARMOR MATERIALS MARKET, BY APPLICATION,  2020–2023 (USD MILLION)
                                              TABLE 112 SOUTH AFRICA: VEHICLE ARMOR MATERIALS MARKET, BY APPLICATION,  2024–2029 (USD MILLION)
                    8.5.1.5 Rest of Middle East & Africa
                                TABLE 113 REST OF MIDDLE EAST & AFRICA: VEHICLE ARMOR MATERIALS MARKET,  BY APPLICATION, 2020–2023 (USD MILLION)
                                TABLE 114 REST OF MIDDLE EAST & AFRICA: VEHICLE ARMOR MATERIALS MARKET,  BY APPLICATION, 2024–2029 (USD MILLION)
    8.6 SOUTH AMERICA 
           8.6.1 RECESSION IMPACT
                    TABLE 115 SOUTH AMERICA: VEHICLE ARMOR MATERIALS MARKET, BY COUNTRY,  2020–2023 (USD MILLION)
                    TABLE 116 SOUTH AMERICA: VEHICLE ARMOR MATERIALS MARKET, BY COUNTRY,  2024–2029 (USD MILLION)
                    TABLE 117 SOUTH AMERICA: VEHICLE ARMOR MATERIALS MARKET, BY COUNTRY,  2020–2023 (KILOTON)
                    TABLE 118 SOUTH AMERICA: VEHICLE ARMOR MATERIALS MARKET, BY COUNTRY,  2024–2029 (KILOTON)
                    TABLE 119 SOUTH AMERICA: VEHICLE ARMOR MATERIALS MARKET, BY TYPE,  2020–2023 (USD MILLION)
                    TABLE 120 SOUTH AMERICA: VEHICLE ARMOR MATERIALS MARKET, BY TYPE,  2024–2029 (USD MILLION)
                    TABLE 121 SOUTH AMERICA: VEHICLE ARMOR MATERIALS MARKET, BY TYPE, 2020–2023 (KILOTON)
                    TABLE 122 SOUTH AMERICA: VEHICLE ARMOR MATERIALS MARKET, BY TYPE, 2024–2029 (KILOTON)
                    TABLE 123 SOUTH AMERICA: VEHICLE ARMOR MATERIALS MARKET, BY APPLICATION,  2020–2023 (USD MILLION)
                    TABLE 124 SOUTH AMERICA: VEHICLE ARMOR MATERIALS MARKET, BY APPLICATION,  2024–2029 (USD MILLION)
                    8.6.1.1 Brazil
                               8.6.1.1.1 Security challenges, military modernization efforts, and economic diversification to drive market
                                              TABLE 125 BRAZIL: VEHICLE ARMOR MATERIALS MARKET, BY APPLICATION,  2020–2023 (USD MILLION)
                                              TABLE 126 BRAZIL: VEHICLE ARMOR MATERIALS MARKET, BY APPLICATION,  2024–2029 (USD MILLION)
                    8.6.1.2 Argentina
                               8.6.1.2.1 Favorable business conditions and government incentives to support market growth
                                              TABLE 127 ARGENTINA: VEHICLE ARMOR MATERIALS MARKET, BY APPLICATION,  2020–2023 (USD MILLION)
                                              TABLE 128 ARGENTINA: VEHICLE ARMOR MATERIALS MARKET, BY APPLICATION,  2024–2029 (USD MILLION)
                    8.6.1.3 Rest of South America
                                TABLE 129 REST OF SOUTH AMERICA: VEHICLE ARMOR MATERIALS MARKET, BY APPLICATION, 2020–2023 (USD MILLION)
                                TABLE 130 REST OF SOUTH AMERICA: VEHICLE ARMOR MATERIALS MARKET, BY APPLICATION, 2024–2029 (USD MILLION)
 
9 COMPETITIVE LANDSCAPE (Page No. - 148)
    9.1 INTRODUCTION 
           9.1.1 OVERVIEW OF STRATEGIES ADOPTED BY KEY VEHICLE ARMOR MATERIAL MANUFACTURERS
    9.2 MARKET SHARE ANALYSIS 
           9.2.1 RANKING OF KEY MARKET PLAYERS, 2022
                    FIGURE 32 RANKING OF TOP FIVE PLAYERS IN VEHICLE ARMOR MATERIALS MARKET, 2022
           9.2.2 MARKET SHARE OF KEY PLAYERS
                    TABLE 131 VEHICLE ARMOR MATERIALS MARKET: DEGREE OF COMPETITION
                    FIGURE 33 SHARE OF KEY PLAYERS IN VEHICLE ARMOR MATERIALS MARKET, 2022
                    9.2.2.1 Tata Steel Limited
                    9.2.2.2 Honeywell International Inc.
                    9.2.2.3 Saint-Gobain SA
                    9.2.2.4 Alcoa Corporation
                    9.2.2.5 DuPont de Nemours, Inc.
    9.3 REVENUE ANALYSIS 
          FIGURE 34 REVENUE ANALYSIS OF TOP 5 PLAYERS, 2020–2024
    9.4 COMPANY EVALUATION MATRIX: KEY PLAYERS, 2023 
           9.4.1 STARS
           9.4.2 EMERGING LEADERS
           9.4.3 PERVASIVE PLAYERS
           9.4.4 PARTICIPANTS
                    FIGURE 35 VEHICLE ARMOR MATERIALS MARKET: COMPANY EVALUATION MATRIX, 2022
           9.4.5 COMPANY FOOTPRINT: KEY PLAYERS, 2023
                    TABLE 132 COMPANY TYPE FOOTPRINT (10 COMPANIES)
                    TABLE 133 COMPANY APPLICATION FOOTPRINT (10 COMPANIES)
                    TABLE 134 COMPANY REGION FOOTPRINT (10 COMPANIES)
    9.5 COMPANY EVALUATION MATRIX: STARTUPS/SMES, 2023 
           9.5.1 PROGRESSIVE COMPANIES
           9.5.2 RESPONSIVE COMPANIES
           9.5.3 DYNAMIC COMPANIES
           9.5.4 STARTING BLOCKS
                    FIGURE 36 VEHICLE ARMOR MATERIALS MARKET: START-UPS/SMES EVALUATION  MATRIX, 2022
           9.5.5 COMPETITIVE BENCHMARKING
                    9.5.5.1 DETAILED LIST OF KEY START-UPS/SMES
                                TABLE 135 VEHICLE ARMOR MATERIALS MARKET: DETAILED LIST OF KEY START-UPS/SMES
                    9.5.5.2 Competitive benchmarking of key start-ups/SMEs
                                TABLE 136 START-UPS/SMES COMPANY APPLICATION FOOTPRINT (15 COMPANIES)
                                TABLE 137 START-UPS/SMES COMPANY TYPE FOOTPRINT (15 COMPANIES)
                                TABLE 138 START-UPS/SMES COMPANY REGION FOOTPRINT (15 COMPANIES)
                                FIGURE 37 VEHICLE ARMOR MATERIALS MARKET: COMPANY OVERALL FOOTPRINT
           9.5.6 VALUATION AND FINANCIAL METRICS OF KEY VEHICLE ARMOR MATERIAL VENDORS
                    FIGURE 38 EV/EBITDA OF KEY VENDORS
                    FIGURE 39 YEAR-TO-DATE (YTD) PRICE TOTAL RETURN
    9.6 COMPETITIVE SCENARIO AND TRENDS 
           9.6.1 PRODUCT LAUNCHES
                    TABLE 139 VEHICLE ARMOR MATERIALS MARKET: PRODUCT LAUNCHES (2019–2023)
           9.6.2 DEALS
                    TABLE 140 VEHICLE ARMOR MATERIALS MARKET: DEALS (2019–2023)
           9.6.3 OTHER DEVELOPMENTS
                    TABLE 141 VEHICLE ARMOR MATERIALS MARKET: OTHER DEVELOPMENTS (2019–2023)
 
10 COMPANY PROFILES (Page No. - 164)
(Business overview, Products offered, Recent Developments, MNM view)*
     10.1 KEY PLAYERS 
             10.1.1 DUPONT DE NEMOURS, INC.
                        TABLE 142 DUPONT DE NEMOURS, INC.: COMPANY OVERVIEW
                        FIGURE 40 DUPONT DE NEMOURS, INC.: COMPANY SNAPSHOT
                        TABLE 143 DUPONT DE NEMOURS, INC.: PRODUCT OFFERINGS
                        TABLE 144 DUPONT DE NEMOURS, INC.: PRODUCT LAUNCHES, 2019–2023
                        TABLE 145 DUPONT DE NEMOURS, INC.: DEALS, 2019–2023
             10.1.2 SAINT-GOBAIN SA
                        TABLE 146 SAINT-GOBAIN SA: COMPANY OVERVIEW
                        FIGURE 41 SAINT-GOBAIN SA: COMPANY SNAPSHOT
                        TABLE 147 SAINT-GOBAIN SA: PRODUCT OFFERINGS
                        TABLE 148 SAINT-GOBAIN SA: DEALS, 2019–2023
             10.1.3 ALLEGHENY TECHNOLOGIES INCORPORATED (ATI INC.)
                        TABLE 149 ALLEGHENY TECHNOLOGIES, INCORPORATED (ATI, INC.): COMPANY OVERVIEW
                        FIGURE 42 ALLEGHENY TECHNOLOGIES INCORPORATED (ATI INC.): COMPANY SNAPSHOT
                        TABLE 150 ALLEGHENY TECHNOLOGIES INCORPORATED (ATI INC.): PRODUCT OFFERINGS
                        TABLE 151 ALLEGHENY TECHNOLOGIES INCORPORATED (ATI INC.): DEALS, 2019–2023
             10.1.4 HONEYWELL INTERNATIONAL INC.
                        TABLE 152 HONEYWELL INTERNATIONAL INC.: COMPANY OVERVIEW
                        FIGURE 43 HONEYWELL INTERNATIONAL INC.: COMPANY SNAPSHOT
                        TABLE 153 HONEYWELL INTERNATIONAL INC.: PRODUCT OFFERINGS
                        TABLE 154 HONEYWELL INTERNATIONAL INC.: PRODUCT LAUNCHES, 2019–2023
                        TABLE 155 HONEYWELL INTERNATIONAL INC.: DEALS, 2019–2023
             10.1.5 TEIJIN LIMITED
                        TABLE 156 TEIJIN LIMITED: COMPANY OVERVIEW
                        FIGURE 44 TEIJIN LIMITED: COMPANY SNAPSHOT
                        TABLE 157 TEIJIN LIMITED: PRODUCT OFFERINGS
                        TABLE 158 TEIJIN LIMITED: PRODUCT LAUNCHES, 2019–2023
                        TABLE 159 TEIJIN LIMITED: DEALS, 2019–2023
                        TABLE 160 TEIJIN LIMITED: OTHER DEVELOPMENTS, 2019–2023
             10.1.6 ALCOA CORPORATION
                        TABLE 161 ALCOA CORPORATION: COMPANY OVERVIEW
                        TABLE 162 ALCOA CORPORATION: PRODUCT OFFERINGS
             10.1.7 TATA STEEL LIMITED
                        TABLE 163 TATA STEEL LIMITED: COMPANY OVERVIEW
                        TABLE 164 TATA STEEL LIMITED: PRODUCT OFFERINGS
             10.1.8 SSAB
                        TABLE 165 SSAB: COMPANY OVERVIEW
                        TABLE 166 SSAB: PRODUCT OFFERINGS
                        TABLE 167 SSAB: DEALS, 2019–2023
             10.1.9 CERAMTEC
                        TABLE 168 CERAMTEC: COMPANY OVERVIEW
                        FIGURE 45 CERAMTEC: COMPANY SNAPSHOT
                        TABLE 169 CERAMTEC: PRODUCT OFFERINGS
             10.1.10 MORGAN ADVANCED MATERIALS
                        TABLE 170 MORGAN ADVANCED MATERIAL: COMPANY OVERVIEW
                        TABLE 171 MORGAN ADVANCED MATERIALS: PRODUCT OFFERINGS
                        TABLE 172 MORGAN ADVANCED MATERIAL: EXPANSIONS, 2019–2023
     10.2 OTHER PLAYERS 
             10.2.1 PPG INDUSTRIES
                        TABLE 173 PPG INDUSTRIES: COMPANY OVERVIEW
             10.2.2 COORSTEK INC.
                        TABLE 174 COORSTEK INC.: COMPANY OVERVIEW
             10.2.3 CERCO CORPORATION
                        TABLE 175 CERCO CORPORATION: COMPANY OVERVIEW
             10.2.4 AGY HOLDING CORP.
                        TABLE 176 AGY HOLDING CORP.: COMPANY OVERVIEW
             10.2.5 SAFARILAND, LLC
                        TABLE 177 SAFARILAND, LLC: COMPANY OVERVIEW
             10.2.6 LEECO STEEL
                        TABLE 178 LEECO STEEL: COMPANY OVERVIEW
             10.2.7 ARMORWORKS ENTERPRISES LLC
                        TABLE 179 ARMORWORKS ENTERPRISES LLC: COMPANY OVERVIEW
             10.2.8 WACO COMPOSITES
                        TABLE 180 WACO COMPOSITES: COMPANY OVERVIEW
             10.2.9 AT&F ADVANCED METALS LLC
                        TABLE 181 AT&F ADVANCED METALS LLC: COMPANY OVERVIEW
             10.2.10 PROTECTIVE STRUCTURES, LTD.
                        TABLE 182 PROTECTIVE STRUCTURES, LTD.: COMPANY OVERVIEW
             10.2.11 CPS TECHNOLOGIES, CORP.
                        TABLE 183 CPS TECHNOLOGIES, CORP.: COMPANY OVERVIEW
             10.2.12 JPS COMPOSITES MATERIALS
                        TABLE 184 JPS COMPOSITES MATERIALS: COMPANY OVERVIEW
             10.2.13 SCHUNK CARBON TECHNOLOGY
                        TABLE 185 SCHUNK CARBON TECHNOLOGY: COMPANY OVERVIEW
             10.2.14 SURMET CORPORATION
                        TABLE 186 SURMET CORPORATION: COMPANY OVERVIEW
             10.2.15 3M
                        TABLE 187 3M: COMPANY OVERVIEW
 
*Details on Business overview, Products offered, Recent Developments, MNM view might not be captured in case of unlisted companies.
 
11 APPENDIX (Page No. - 204)
     11.1 DISCUSSION GUIDE 
     11.2 KNOWLEDGESTORE: MARKETSANDMARKETS’  SUBSCRIPTION PORTAL 
     11.3 CUSTOMIZATION OPTIONS 
     11.4 RELATED REPORTS 
     11.5 AUTHOR DETAILS 

The study involved four major activities in estimating the market size of the Vehicle armor materials market. Exhaustive secondary research was done to collect information on the market, the peer market, and the parent market. The next step was to validate these findings, assumptions, and sizing with industry experts across the value chain through primary research. Both top-down and bottom-up approaches were employed to estimate the complete market size. Thereafter, the market breakdown and data triangulation procedures were used to estimate the market size of the segments and subsegments.

Secondary Research

In the secondary research process, various secondary sources have been referred to for identifying and collecting information for this study. These secondary sources include annual reports, press releases, investor presentations of companies, white papers, certified publications, trade directories, articles from recognized authors, the gold standard and silver standard websites, and databases.

Secondary research has been used to obtain key information about the value chain of the industry, the monetary chain of the market, the total pool of key players, market classification, and segmentation according to industry trends to the bottom-most level and regional markets. It was also used to obtain information about the key developments from a market-oriented perspective.

Primary Research

The vehicle armor materials market comprises several stakeholders in the value chain, which include raw material suppliers, research & development, fabricators/applicators, distribution and logistics, and end users. Various primary sources from the supply and demand sides of the vehicle armor materials market have been interviewed to obtain qualitative and quantitative information. The primary interviewees from the demand side include key opinion leaders in end-use sectors. The primary sources from the supply side include manufacturers, associations, and institutions involved in the vehicle armor materials industry.

Primary interviews were conducted to gather insights such as market statistics, data on revenue collected from the products and services, market breakdowns, market size estimations, market forecasting, and data triangulation. Primary research also helped in understanding the various trends related to form, type, application, end-use industry and region. Stakeholders from the demand side, such as CIOs, CTOs, and CSOs, were interviewed to understand the buyer’s perspective on the suppliers, products, fabricators, and their current usage of vehicle armor materials and the outlook of their business, which will affect the overall market.

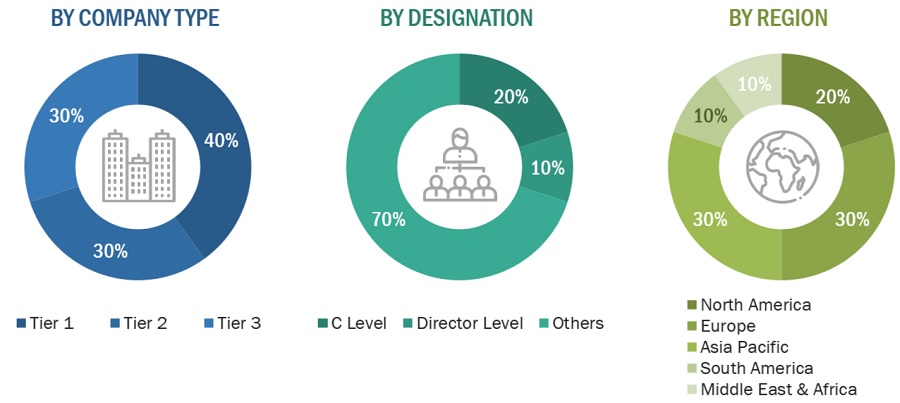
The breakdown of profiles of the primary interviewees is illustrated in the figure below:
Vehicle Armor Materials Market Size, and Share

Note: Tier 1, Tier 2, and Tier 3 companies are classified based on their market revenue in 2022, available in the public domain, product portfolios, and geographical presence.

Other designations include consultants and sales, marketing, and procurement managers.

To know about the assumptions considered for the study, download the pdf brochure

Company name

Designation

DuPont de Nemours, Inc.(US)

Individual Industry Expert

Teijin Limited (Japan)

Sales Manager

Morgan Advanced Materials (UK)

Manager

Tata Steels Limited (India)

Marketing Manager

Honeywell International, Inc. (US)

Senior Scientist

Market Size Estimation

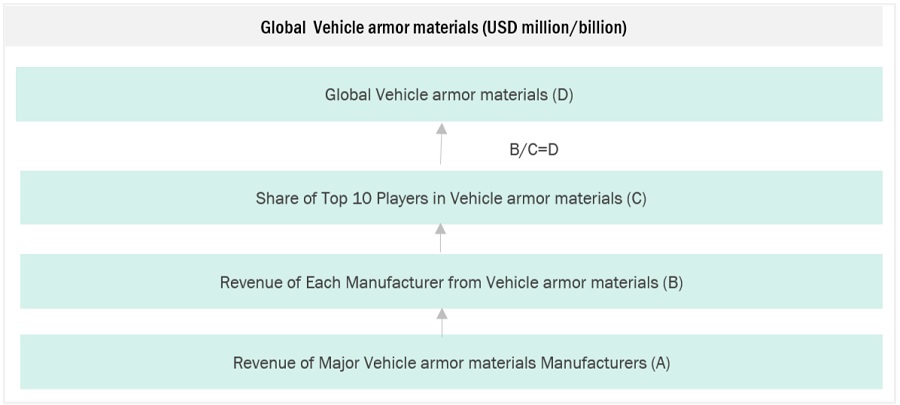
The top-down and bottom-up approaches have been used to estimate and validate the size of the Vehicle armor materials market.

  • The key players in the industry have been identified through extensive secondary research.
  • The industry's supply chain has been determined through primary and secondary research.
  • All percentage shares, splits, and breakdowns have been determined using secondary sources and verified through primary sources.
  • All possible parameters that affect the markets covered in this research study have been accounted for, viewed in extensive detail, verified through primary research, and analyzed to obtain the final quantitative and qualitative data.
  • The research includes the study of reports, reviews, and newsletters of the key market players, along with extensive interviews for opinions with leaders such as directors and marketing executives.

Vehicle Armor Materials Market: Bottum-Up Approach
Vehicle Armor Materials Market Size, and Share

Note: All the shares are based on the global market size.

Source: Secondary Research, Interviews with Experts, and MarketsandMarkets Analysis

To know about the assumptions considered for the study, Request for Free Sample Report

Vehicle Armor Materials Market: Top-Down Approach

Vehicle Armor Materials Market Size, and Share

Data Triangulation

After arriving at the total market size from the estimation process explained above, the overall market has been split into several segments and sub-segments. To complete the overall market engineering process and arrive at the exact statistics for all the segments and sub-segments, the data triangulation and market breakdown procedures have been employed, wherever applicable. The data has been triangulated by studying various factors and trends from both the demand and supply sides. Along with this, the market size has been validated by using both the top-down and bottom-up approaches and primary interviews. Hence, for every data segment, there have been three sources—top-down approach, bottom-up approach, and expert interviews. The data was assumed correct when the values arrived from the three sources matched.

Market Definition

The vehicle armor materials market is defined by its focus on developing materials and technologies aimed at enhancing the protection of vehicles against various forms of attack, including ballistic threats and explosions. This market is crucial for ensuring the safety of military personnel, law enforcement officers, and civilians in high-risk environments. Central to this market is the concept of ballistic resistance, the ability of armor materials to absorb, disperse, and prevent the penetration of projectiles, thereby safeguarding the vehicle's occupants. A notable innovation within this space is composite armor, which combines materials like ceramics, polymers, and metals to exploit each material's protective properties while minimizing weight. Ceramic armor, known for its hardness and lightweight properties, exemplifies the market's trend toward materials that offer significant protective benefits without compromising vehicle performance. Additionally, the use of metal alloys, such as steel, aluminum, and titanium, provides tailored solutions that balance protection with weight considerations.

Key Stakeholders

  • Vehicle armor materials manufacturers
  • Vehicle armor materials traders, distributors, and suppliers
  • End-use industry participants of different segments of the vehicle armor materials market
  • Government and research organizations
  • Associations and industrial bodies
  • Research and consulting firms.
  • Research & development (R&D) institutions.
  • Environmental support agencies.

Report Objectives

  • To define, describe, and forecast the size of the vehicle armor materials market, in terms of value and volume.
  • To provide detailed information regarding the major factors (drivers, opportunities, restraints, and challenges) influencing the growth of the market
  • To estimate and forecast the market size based on form, type, application, end-use industry and region.
  • To forecast the size of the market with respect to major regions, namely, Europe, North America, Asia Pacific, Middle East & Africa, and South America, along with their key countries.
  • To strategically analyze micromarkets1 with respect to individual growth trends, prospects, and their contribution to the overall market.
  • To analyze opportunities in the market for stakeholders and provide a competitive landscape of market leaders.
  • To track and analyze recent developments such as expansions, new product launches, partnerships & agreements, and acquisitions in the market.
  • To strategically profile key market players and comprehensively analyze their core competencies.

Available Customizations

Along with the given market data, MarketsandMarkets offers customizations according to the company’s specific needs. The following customization options are available for the report:

Regional Analysis

  • Further breakdown of a region with respect to a particular country or additional application

Company Information

  • Detailed analysis and profiles of additional market players
Custom Market Research Services

We will customize the research for you, in case the report listed above does not meet with your exact requirements. Our custom research will comprehensively cover the business information you require to help you arrive at strategic and profitable business decisions.

Request Customization
Report Code
CH 8972
Published ON
Mar, 2024
Choose License Type
BUY NOW
  • SHARE
X
Request Customization
Speak to Analyst
Speak to Analyst
OR FACE-TO-FACE MEETING
PERSONALIZE THIS RESEARCH
  • Triangulate with your Own Data
  • Get Data as per your Format and Definition
  • Gain a Deeper Dive on a Specific Application, Geography, Customer or Competitor
  • Any level of Personalization
REQUEST A FREE CUSTOMIZATION
LET US HELP YOU!
  • What are the Known and Unknown Adjacencies Impacting the Vehicle Armor Materials Market
  • What will your New Revenue Sources be?
  • Who will be your Top Customer; what will make them switch?
  • Defend your Market Share or Win Competitors
  • Get a Scorecard for Target Partners
CUSTOMIZED WORKSHOP REQUEST
  • Call Us
  • +1-888-600-6441 (Corporate office hours)
  • +1-888-600-6441 (US/Can toll free)
  • +44-800-368-9399 (UK office hours)
CONNECT WITH US
ABOUT TRUST ONLINE
©2024 MarketsandMarkets Research Private Ltd. All rights reserved
DMCA.com Protection Status Website Feedback