Waste Management Market

Waste Management Market by Waste Type (Hazardous Waste, E-Waste, Municipal Solid Waste, Medical Waste, Construction & Demolition, Non-Hazardous Industrial Waste), Disposal (Open Dumping, Incineration/Combustionl), Source & Region - Global Forecast to 2029

Report Code: EP 7931 Apr, 2024, by marketsandmarkets.com

[303 Pages Report] The global Waste Management Market is projected to reach USD 1598.1 billion by 2029 from an estimated USD 1219.6 billion in 2024, at a CAGR of 5.6% during the forecast period. Waste management is an important part of environmental sustainability and public health. It entails the collection, transportation, processing, recycling, and disposal of diverse wastes produced by households, businesses, industries, and institutions. Governments and international organizations are implementing harsher waste management policies, such as extended producer responsibility and aggressive plastic waste reduction objectives. The implementation of circular economy ideas is changing waste management by emphasizing a continuous cycle of repurposing, reusing, and recycling resources. This method not only eliminates waste, but it also encourages sustainability and resource optimisation. Advances in decomposition technologies are providing ground-breaking waste management solutions, such as faster and more effective means of breaking down organic and inorganic garbage.

Waste Management Market

To know about the assumptions considered for the study, Request for Free Sample Report

Waste Management Market Opportunities

To know about the assumptions considered for the study, download the pdf brochure

Waste management Market Dynamics

Driver: Technological advancements in waste management

Technological advancements in waste management is a driver for providing waste management services. These advancements have made waste management more efficient and sustainable, transforming the way we handle waste. Some of the innovative technologies that have been developed include smart waste bins, waste level sensors, AI recycling robots, and renewable energy solutions. Smart waste bins are equipped with sensors that can detect the level of waste inside them. This allows waste management companies to optimize their collection routes, reducing the number of trips needed to collect waste and improving efficiency. Waste level sensors can also be installed in landfills and transfer stations, allowing for more accurate monitoring of waste volumes and better management of waste disposal. AI recycling robots are another innovative technology that has been developed to improve waste management. These robots use artificial intelligence to sort recyclable materials from non-recyclable materials, increasing the efficiency of recycling processes. This not only reduces the amount of waste sent to landfills but also helps to conserve resources and reduce the environmental impact of waste disposal.

Restraint: Lack of Infrastructure

Insufficient waste collection systems can adversely impact waste management practices, resulting in irregular or incomplete gathering of waste from diverse sources like households, businesses, and public areas. This leads to a accumulation of uncollected waste that ends up in landfills without proper sorting or processing. In many developing countries, inadequate waste collection systems contribute to environmental and health challenges, as seen in parts of Sub-Saharan Africa where rapid urbanization surpasses the development of waste management infrastructure. Cities and towns struggle with inefficient waste collection systems unable to cope with the growing waste volume from expanding populations, causing garbage to accumulate in unsightly and unsanitary conditions on streets, open spaces, and waterways,

Opportunities: Circular economy & recycling

The adoption of recycling and the principle of a circular economy presents novel opportunities in waste management, emphasizing sustainable practices and closing the loop from extraction to disposal. The circular economy advocates for product design that minimizes waste and optimizes material usage, positioning waste management as the final step. This approach prioritizes the efficient use of materials, striving to prolong their lifespan through strategies like recycling, reusing, and repairing. This stands in stark contrast to the conventional linear economy, where materials are extracted, used, and often disposed of in landfills or incinerators.

Challenges: Illegal trading of E-waste

E-waste discarded from developed countries is exported to Asia Pacific countries, such as China, India from the countries in the Middle east, for the purpose of reuse or repair. Some electronic products are repaired, while some of them are reused. However, most of these products are simply dumped in these countries since no facilities exist to safely recycle these products. The problem of illegal dumping persists in all developing countries. According to government legislation and laws, it is illegal to export broken electronic goods. The elements toxic to the environment are not removed from these products, thereby causing pollution in developing countries.

Waste management Market Ecosystem

In this market, prominent companies stand out as well-established and financially stable providers of Waste management products and services. With years of experience, these companies boast a diverse product portfolio, cutting-edge technologies, and robust global sales and marketing networks. Their proven track record in the industry positions them as reliable and trusted partners for customers seeking Waste management solutions. These companies have demonstrated their ability to adapt to market dynamics and consistently deliver high-quality products and services, making them leaders in meeting the demands of the energy and power sector. Prominent companies in this market include WM Intellectual Property Holdings, L.L.C. (US), Suez (France), Veolia (France), Republic Services (US) & Waste Connections (US) are the market leaders in the Waste management market.

Waste Management  Market Ecosystem

The Industrial segment, by source, is expected to be the largest market during the forecast period.

This report segments the waste management market based on source into three categories: residential,  commercial, and industrial. The industrial segment is expected to be the largest market during the forecast period. Industrial activities generate a large amount of garbage, both hazardous and non-hazardous, necessitating specialist waste management services to address these different waste streams.  The growing awareness of environmental concerns and the emphasis on sustainable practices has prompted enterprises to use recycling methods to efficiently manage their trash, making recycling the dominating type in the worldwide industrial waste management market. The emphasis on circular economy principles, as well as government rules supporting sustainability, contribute to industrial waste management's dominant position in the total waste management business.

By Disposal type, Landfilling is expected to be the largest segment during the forecast period.

Based on the Disposal method, the waste management market is segmented into six categories: Open Dumping, Incineration/Combustion, Landfill, Recycling, Composting & Anaerobic Digestion. Landfilling is expected to be the largest segment during the forecast period. Landfilling is a popular waste disposal strategy for a variety of reasons, as detailed in the following sources. Landfills are vital for proper solid waste disposal, limiting garbage entering the environment, preventing disease transmission, and preserving clean neighborhoods. Landfills follow environmental regulations and standards to ensure proper garbage disposal. They are monitored and managed to reduce the risk to public health and the environment..

Asia Pacific : The fastest growing region in the Waste management market.

Asia Pacific is expected to be the fastest growing region in the waste management market between 2024–2029. Asia-Pacific is the world's fastest-growing economic powerhouse, bringing millions out of poverty and accelerating urbanization. This expansion leads to increased trash output, demanding efficient waste management techniques. Rapid industrialization in countries such as China, India, Indonesia, Russia, Japan, and others has resulted in increased industrial waste production, necessitating modern waste treatment infrastructure.  The increase of plastic garbage in the Asia-Pacific area has sparked calls for better waste management and recycling activities.

Asia Pacific Waste Management Market Size, and Share

Key Market Players

The waste management market is dominated by a few major players that have a wide regional presence. The major players in the waste management market include WM Intellectual Property Holdings, L.L.C. (US), Suez (France), Veolia (France), Republic Services (US) & Waste Connections (US) are the market leaders in the Waste management market. Between 2019 and 2023, Strategies such as new product launches, contracts, agreements, partnerships, collaborations, acquisitions, and expansions are followed by these companies to capture a larger share of the waste management market.

Get online access to the report on the World's First Market Intelligence Cloud

  • Easy to Download Historical Data & Forecast Numbers
  • Company Analysis Dashboard for high growth potential opportunities
  • Research Analyst Access for customization & queries
  • Competitor Analysis with Interactive dashboard
  • Latest News, Updates & Trend analysis
Request Sample

Scope of the Report

Report Metric

Details

Market size available for years

2019–2029

Base year considered

2023

Forecast period

2024–2029

Forecast units

Value (USD Million)

Segments Covered

Waste management Market by Waste type, Disposal method, Source and Region.

Geographies covered

North America, Europe, Asia Pacific, Latin America, and Middle East & Africa.

Companies covered

WM Intellectual Property Holdings, L.L.C. (US), SUEZ (France), Veolia (France), Waste Connections (US), Republic Services (US), Biffa (UK), CLEAN HARBORS, INC. (US), Covanta Holding Corporation (US), DAISEKI CO.,Ltd. (Japan), Hitachi Zosen Corporation (Japan), GFL environmental Inc. (Canada), BINGO INDUSTRIES (Australia), Stericycle, Inc. (US), REMONDIS SE & Co. KG (Germany), URBASER (Spain), FCC Environmental Services (Austria), BioMedical Waste Solutions (US), Valicor (US), Recology (US), Estre (Brazil), RecyGlo Company Pte. Ltd. (Myanmar), Saahas Zero Waste (India), Recycle Track Systems, Inc. (US), Recycling Technologies Ltd (England), Rekosistem (Indonesia).

This research report categorizes the Waste management Market by Waste type, Disposal method, Source and Region.

On the basis of Waste type, the Waste management market has been segmented as follows:
  • Hazardous Waste
  • E-Waste
  • Municipal Solid Waste
  • Medical Waste
  • Construction & Demolition Waste
  • Non- Hazardous Industrial Waste
On the basis of Disposal method, the Waste management market has been segmented as follows:
  • Open Dumping
  • Incineration/Combustion
  • Landfill
  • Recycling
  • Composting & Anaerobic Digestion
On the basis of Source, the Waste management market has been segmented as follows:
  • Residential
  • Commercial
  • Industrial
Based on region, the Waste management market has been segmented as follows:
  • North America
  • Europe
  • Asia Pacific
  • Middle East & Africa
  • Latin America

Recent Developments

  • In November 2023, Biffa has acquired  Hamilton Waste and Recycling Limited (HWR), Scotland’s leading construction and demolition (C&D) waste collection and processing business.?The acquisition of HWR is a significant step for Biffa, expanding its waste capabilities in the construction and demolition sector, further underpinning its commitment to low-carbon collections and material processing.
  • In July 2023, SUEZ has acquired 60% share  of APBB (Czech Republic), suez is extending the scope of its activities in the Czech Republic by entering the municipal and industrial waste management and green energy production markets. 
  • In November 2022, Veolia and Abu Dhabhi National Oil company Refining has signed a historic agreemen for the treatment of hazardous industrial waste.
  • In September 2022, WM Intellectual Property Holdings, L.L.C. acquired Avangard Innovative's U.S. business, which will operate as Natura PCR – an independent company expected to scale and grow recycling capacity to produce an estimated 400 million pounds per year of post-consumer resin (PCR) in five years.

Frequently Asked Questions (FAQ):

To speak to our analyst for a discussion on the above findings, click Speak to Analyst

TABLE OF CONTENTS
 
1 INTRODUCTION (Page No. - 38)
    1.1 STUDY OBJECTIVES 
    1.2 MARKET DEFINITION 
    1.3 MARKET SCOPE 
           1.3.1 WASTE MANAGEMENT MARKET SEGMENTATION
           1.3.2 REGIONAL SCOPE
           1.3.3 INCLUSIONS AND EXCLUSIONS
           1.3.4 YEARS CONSIDERED
           1.3.5 CURRENCY CONSIDERED
           1.3.6 UNIT CONSIDERED
    1.4 LIMITATIONS 
    1.5 STAKEHOLDERS 
    1.6 SUMMARY OF CHANGES 
    1.7 IMPACT OF RECESSION 
 
2 RESEARCH METHODOLOGY (Page No. - 44)
    2.1 RESEARCH DATA 
           FIGURE 1 WASTE MANAGEMENT MARKET: RESEARCH DESIGN
    2.2 DATA TRIANGULATION 
           FIGURE 2 DATA TRIANGULATION METHODOLOGY
    2.3 PRIMARY AND SECONDARY RESEARCH 
           2.3.1 SECONDARY DATA
                    2.3.1.1 List of major secondary sources
                    2.3.1.2 Key data from secondary sources
           2.3.2 PRIMARY DATA
                    2.3.2.1 List of key participants in primary interviews
                    2.3.2.2 Key insights from industry
                    2.3.2.3 Breakdown of primaries
    2.4 MARKET SIZE ESTIMATION 
           2.4.1 BOTTOM-UP APPROACH
                    FIGURE 3 WASTE MANAGEMENT MARKET: REGION- /COUNTRY-WISE ANALYSIS
           2.4.2 TOP-DOWN APPROACH
                    FIGURE 4 WASTE MANAGEMENT MARKET: TOP-DOWN APPROACH
    2.5 DEMAND-SIDE METRICS 
           FIGURE 5 MAIN METRICS CONSIDERED FOR ANALYZING AND ASSESSING DEMAND FOR WASTE MANAGEMENT SERVICES
           2.5.1 ASSUMPTIONS FOR DEMAND-SIDE ANALYSIS
           2.5.2 CALCULATIONS FOR DEMAND-SIDE ANALYSIS
    2.6 SUPPLY-SIDE ANALYSIS 
           FIGURE 6 KEY STEPS CONSIDERED FOR ASSESSING SUPPLY OF WASTE MANAGEMENT SERVICES
           FIGURE 7 WASTE MANAGEMENT MARKET: SUPPLY-SIDE ANALYSIS, 2023
           2.6.1 ASSUMPTIONS FOR SUPPLY-SIDE ANALYSIS
           2.6.2 CALCULATIONS FOR SUPPLY-SIDE ANALYSIS
    2.7 FORECAST 
    2.8 RECESSION IMPACT ANALYSIS 
    2.9 RESEARCH ASSUMPTIONS 
    2.10 RESEARCH LIMITATIONS 
    2.11 RISK ASSESSMENT 
 
3 EXECUTIVE SUMMARY (Page No. - 56)
    TABLE 1 WASTE MANAGEMENT MARKET SNAPSHOT 
    FIGURE 8 NORTH AMERICA HELD LARGEST SHARE OF WASTE MANAGEMENT MARKET IN 2023 
    FIGURE 9 NON-HAZARDOUS INDUSTRIAL WASTE SEGMENT TO COMMAND WASTE MANAGEMENT MARKET IN 2029 
    FIGURE 10 LANDFILLS SEGMENT TO DOMINATE WASTE MANAGEMENT MARKET IN 2029 
    FIGURE 11 INDUSTRIAL SEGMENT TO ACCOUNT FOR LARGEST SHARE OF WASTE MANAGEMENT MARKET IN 2029 
 
4 PREMIUM INSIGHTS (Page No. - 60)
    4.1 ATTRACTIVE OPPORTUNITIES IN WASTE MANAGEMENT MARKET 
           FIGURE 12 ADOPTION OF CIRCULAR ECONOMY PRINCIPLE TO BOOST MARKET GROWTH BETWEEN 2024 AND 2029
    4.2 WASTE MANAGEMENT MARKET, BY REGION 
           FIGURE 13 ASIA PACIFIC TO EXHIBIT HIGHEST CAGR IN WASTE MANAGEMENT MARKET DURING FORECAST PERIOD
    4.3 WASTE MANAGEMENT MARKET IN NORTH AMERICA, BY SOURCE AND COUNTRY 
           FIGURE 14 INDUSTRIAL SEGMENT AND US HELD LARGEST SHARES OF WASTE MANAGEMENT MARKET IN NORTH AMERICA IN 2023
    4.4 WASTE MANAGEMENT MARKET, BY WASTE TYPE 
           FIGURE 15 NON-HAZARDOUS INDUSTRIAL WASTE TO DOMINATE MARKET, BY WASTE TYPE, IN 2029
    4.5 WASTE MANAGEMENT MARKET, BY DISPOSAL METHOD 
           FIGURE 16 LANDFILLS SEGMENT TO ACCOUNT FOR LARGEST SHARE OF WASTE MANAGEMENT MARKET, BY DISPOSAL METHOD, IN 2029
    4.6 WASTE MANAGEMENT MARKET, BY SOURCE 
           FIGURE 17 INDUSTRIAL SEGMENT TO LEAD WASTE MANAGEMENT MARKET, BY SOURCE, IN 2029
 
5 MARKET OVERVIEW (Page No. - 64)
    5.1 INTRODUCTION 
    5.2 MARKET DYNAMICS 
           FIGURE 18 WASTE MANAGEMENT MARKET: DRIVERS, RESTRAINTS, OPPORTUNITIES, AND CHALLENGES
           5.2.1 DRIVERS
                    5.2.1.1 Stringent regulations to enhance waste management practices for environmental protection
                    5.2.1.2 Development of innovative waste management technologies
           5.2.2 RESTRAINTS
                    5.2.2.1 Absence of necessary framework for waste collection and segregation and awareness programs
                    5.2.2.2 Lack of infrastructure and investment
           5.2.3 OPPORTUNITIES
                    5.2.3.1 Rapid industrialization and construction activities in developing countries
                    5.2.3.2 Adoption of circular economy and recycling strategies
                               FIGURE 19 RECYCLING RATE, BY COUNTRY, 2022
           5.2.4 CHALLENGES
                    5.2.4.1 Controlling environmental pollution caused by illegal transport of e-waste from developed to developing countries
                               TABLE 2 ADVERSE IMPACT OF E-WASTE ON HEALTH AND ENVIRONMENT
                    5.2.4.2 Declining plastic recycling rates due to cost challenges
    5.3 TRENDS/DISRUPTIONS IMPACTING CUSTOMER BUSINESS 
           FIGURE 20 TRENDS/DISRUPTIONS IMPACTING CUSTOMER BUSINESS
    5.4 INDICATIVE PRICING ANALYSIS 
           5.4.1 INDICATIVE PRICING TREND OF WASTE MANAGEMENT SERVICES, BY REGION
                    TABLE 3 INDICATIVE PRICING TREND OF WASTE MANAGEMENT SERVICES, BY REGION, 2019–2023 (USD PER TONNE OF WASTE)
           5.4.2 INDICATIVE PRICING TREND OF WASTE MANAGEMENT SERVICES, BY DISPOSAL METHOD
                    TABLE 4 INDICATIVE PRICING TREND OF WASTE MANAGEMENT SERVICES, BY DISPOSAL METHOD, 2019–2023 (USD PER TONNE OF WASTE)
    5.5 SUPPLY CHAIN ANALYSIS 
           FIGURE 21 WASTE MANAGEMENT: SUPPLY CHAIN ANALYSIS
    5.6 ECOSYSTEM ANALYSIS 
           FIGURE 22 KEY PLAYERS IN WASTE MANAGEMENT ECOSYSTEM
           TABLE 5 ROLE OF COMPANIES IN WASTE MANAGEMENT ECOSYSTEM
           FIGURE 23 MAJOR PLAYERS IN ECOSYSTEM
    5.7 INVESTMENT AND FUNDING SCENARIO 
           FIGURE 24 INVESTMENT AND FUNDING IN WASTE MANAGEMENT PROJECTS
    5.8 TECHNOLOGY ANALYSIS 
           5.8.1 KEY TECHNOLOGIES
                    5.8.1.1 Incineration
                    5.8.1.2 Open dumping
                    5.8.1.3 Recycling
           5.8.2 COMPLEMENTARY TECHNOLOGIES
                    5.8.2.1 Solar-powered trash compactors
                    5.8.2.2 Automated recycling centers
                    5.8.2.3 Plasma gasification
           5.8.3 ADJACENT TECHNOLOGIES
                    5.8.3.1 Composting and anaerobic digestion
                    5.8.3.2 Gasification
                    5.8.3.3 Smart waste bins
                    5.8.3.4 Waste level sensors
                    5.8.3.5 AI recycling robots
                    5.8.3.6 Garbage truck weighing mechanisms
                    5.8.3.7 Pneumatic waste pipes
    5.9 CASE STUDY ANALYSIS 
           5.9.1 BIFFA PROCESSED WASTE BACKHAULED FROM SAINSBURY’S SUPERMARKETS TO CREATE REFUSE-DERIVED FUEL
           5.9.2 FHCC IMPLEMENTED COLD COMPOSTING TO MEET WASTE REDUCTION OBJECTIVE
           5.9.3 NAVAL STATION GREAT LAKES IMPLEMENTED COMPOSTING PROGRAM TO BOOSTS WASTE DIVERSION
    5.10 PATENT ANALYSIS 
           TABLE 6 WASTE MANAGEMENT: PATENT ANALYSIS, MARCH 2020–SEPTEMBER 2023
    5.11 TRADE ANALYSIS 
           5.11.1 EXPORT SCENARIO
                    TABLE 7 EXPORT SCENARIO FOR HS CODE 382510 (MUNICIPAL WASTE), BY COUNTRY, 2018–2022 (USD THOUSAND)
                    FIGURE 26 EXPORT DATA FOR HS CODE 382510 (MUNICIPAL WASTE), BY COUNTRY, 2018–2022 (USD THOUSAND)
                    TABLE 8 EXPORT SCENARIO FOR HS CODE 382530 (CLINICAL WASTE), BY COUNTRY, 2018–2022 (USD THOUSAND)
                    FIGURE 27 EXPORT DATA FOR HS CODE 382530 (CLINICAL WASTE), BY COUNTRY, 2018–2022 (USD THOUSAND)
           5.11.2 IMPORT SCENARIO
                    TABLE 9 IMPORT SCENARIO FOR HS CODE 382510 (MUNICIPAL WASTE), BY COUNTRY, 2018–2022 (USD THOUSAND)
                    FIGURE 28 IMPORT DATA FOR HS CODE 382510 (MUNICIPAL WASTE), BY COUNTRY, 2018–2022 (USD THOUSAND)
                    TABLE 10 IMPORT SCENARIO FOR HS CODE 382530 (CLINICAL WASTE), BY COUNTRY, 2018–2022 (USD THOUSAND)
                    FIGURE 29 IMPORT DATA FOR HS CODE 382530 (CLINICAL WASTE), BY COUNTRY, 2018–2022 (USD THOUSAND)
    5.12 KEY CONFERENCES AND EVENTS, 2024 
                    TABLE 11 WASTE MANAGEMENT MARKET: KEY CONFERENCES AND EVENTS, 2024
    5.13 REGULATORY LANDSCAPE 
           5.13.1 REGULATORY BODIES, GOVERNMENT AGENCIES, AND OTHER ORGANIZATIONS
                    TABLE 12 ASIA PACIFIC: LIST OF REGULATORY BODIES, GOVERNMENT AGENCIES, AND OTHER ORGANIZATIONS
                    TABLE 13 NORTH AMERICA: LIST OF REGULATORY BODIES, GOVERNMENT AGENCIES, AND OTHER ORGANIZATIONS
                    TABLE 14 EUROPE: LIST OF REGULATORY BODIES, GOVERNMENT AGENCIES, AND OTHER ORGANIZATIONS
                    TABLE 15 SOUTH AMERICA: LIST OF REGULATORY BODIES, GOVERNMENT AGENCIES, AND OTHER ORGANIZATIONS
                    TABLE 16 MIDDLE EAST & AFRICA: LIST OF REGULATORY BODIES, GOVERNMENT AGENCIES, AND OTHER ORGANIZATIONS
           5.13.2 REGULATIONS
                    TABLE 17 WASTE MANAGEMENT MARKET: GLOBAL REGULATIONS
    5.14 PORTER’S FIVE FORCES ANALYSIS 
                    FIGURE 30 PORTER’S FIVE FORCES ANALYSIS: WASTE MANAGEMENT MARKET
                    TABLE 18 WASTE MANAGEMENT MARKET: PORTER’S FIVE FORCES ANALYSIS
           5.14.1 THREAT OF NEW ENTRANTS
           5.14.2 THREAT OF SUBSTITUTES
           5.14.3 BARGAINING POWER OF SUPPLIERS
           5.14.4 BARGAINING POWER OF BUYERS
           5.14.5 INTENSITY OF COMPETITIVE RIVALRY
    5.15 KEY STAKEHOLDERS AND BUYING CRITERIA 
           5.15.1 KEY STAKEHOLDERS IN BUYING PROCESS
                    FIGURE 31 INFLUENCE OF KEY STAKEHOLDERS ON BUYING PROCESS, BY SOURCE
                    TABLE 19 INFLUENCE OF STAKEHOLDERS ON BUYING PROCESS, BY SOURCE (%)
           5.15.2 BUYING CRITERIA
                    FIGURE 32 KEY BUYING CRITERIA, BY SOURCE
                    TABLE 20 KEY BUYING CRITERIA, BY SOURCE
 
6 WASTE MANAGEMENT MARKET, BY WASTE TYPE (Page No. - 104)
    6.1 INTRODUCTION 
           FIGURE 33 WASTE MANAGEMENT MARKET SHARE, IN TERMS OF VALUE, BY WASTE TYPE, 2023
           TABLE 21 WASTE MANAGEMENT MARKET, BY WASTE TYPE, 2019–2022 (USD MILLION)
           TABLE 22 WASTE MANAGEMENT MARKET, BY WASTE TYPE, 2023–2029 (USD MILLION)
    6.2 NON-HAZARDOUS INDUSTRIAL WASTE 
           6.2.1 RAPID INDUSTRIALIZATION IN DEVELOPING COUNTRIES TO DRIVE MARKET
                    TABLE 23 NON-HAZARDOUS INDUSTRIAL WASTE: WASTE MANAGEMENT MARKET, BY REGION, 2019–2022 (USD MILLION)
                    TABLE 24 NON-HAZARDOUS INDUSTRIAL WASTE: WASTE MANAGEMENT MARKET, BY REGION, 2023–2029 (USD MILLION)
    6.3 CONSTRUCTION AND DEMOLITION WASTE 
           6.3.1 GROWING INCLINATION TOWARD SUSTAINABLE BUILDING PRACTICES TO MINIMIZE ENVIRONMENTAL IMPACT TO FUEL MARKET GROWTH
                    TABLE 25 CONSTRUCTION AND DEMOLITION WASTE: WASTE MANAGEMENT MARKET, BY REGION, 2019–2022 (USD MILLION)
                    TABLE 26 CONSTRUCTION AND DEMOLITION WASTE: WASTE MANAGEMENT MARKET, BY REGION, 2023–2029 (USD MILLION)
    6.4 MUNICIPAL SOLID WASTE 
           6.4.1 RISING FOCUS ON WASTE RECYCLING AND REUSE TO PROMOTE ENVIRONMENTAL SUSTAINABILITY TO SUPPORT MARKET GROWTH
                    TABLE 27 MUNICIPAL SOLID WASTE: WASTE MANAGEMENT MARKET, BY REGION, 2019–2022 (USD MILLION)
                    TABLE 28 MUNICIPAL SOLID WASTE: WASTE MANAGEMENT MARKET, BY REGION, 2023–2029 (USD MILLION)
    6.5 HAZARDOUS WASTE 
           6.5.1 INCREASED NEED TO PROTECT ENVIRONMENT AND PUBLIC HEALTH TO SPUR DEMAND
                    TABLE 29 HAZARDOUS WASTE: WASTE MANAGEMENT MARKET, BY REGION, 2019–2022 (USD MILLION)
                    TABLE 30 HAZARDOUS WASTE: WASTE MANAGEMENT MARKET, BY REGION, 2023–2029 (USD MILLION)
    6.6 MEDICAL WASTE 
           6.6.1 ESCALATING DEMAND FOR HEALTHCARE SERVICES TO FOSTER MARKET GROWTH
                    TABLE 31 MEDICAL WASTE: WASTE MANAGEMENT MARKET, BY REGION, 2019–2022 (USD MILLION)
                    TABLE 32 MEDICAL WASTE: WASTE MANAGEMENT MARKET, BY REGION, 2023–2029 (USD MILLION)
    6.7 E-WASTE 
           6.7.1 RISING FOCUS ON REDUCING CARBON EMISSIONS TO BOOST DEMAND FOR WASTE MANAGEMENT SERVICES
                    TABLE 33 E- WASTE: WASTE MANAGEMENT MARKET, BY REGION, 2019–2022 (USD MILLION)
                    TABLE 34 E- WASTE: WASTE MANAGEMENT MARKET, BY REGION, 2023–2029 (USD MILLION)
 
7 WASTE MANAGEMENT MARKET, BY DISPOSAL METHOD (Page No. - 116)
    7.1 INTRODUCTION 
           FIGURE 34 WASTE MANAGEMENT MARKET SHARE, IN TERMS OF VALUE, BY DISPOSAL METHOD, 2023
           TABLE 35 WASTE MANAGEMENT MARKET, BY DISPOSAL METHOD, 2019–2022 (USD MILLION)
           TABLE 36 WASTE MANAGEMENT MARKET, BY DISPOSAL METHOD, 2023–2029 (USD MILLION)
    7.2 OPEN DUMPING 
           7.2.1 COST SAVINGS AND CONVENIENCE TO BOOST DEMAND
                    TABLE 37 OPEN DUMPING: WASTE MANAGEMENT MARKET, BY REGION, 2019–2022 (USD MILLION)
                    TABLE 38 OPEN DUMPING: WASTE MANAGEMENT MARKET, BY REGION, 2023–2029 (USD MILLION)
    7.3 INCINERATION/COMBUSTION 
           7.3.1 PRESSING NEED TO DESTROY TOXIC WASTE AT HIGH TEMPERATURES TO PROPEL MARKET GROWTH
                    TABLE 39 INCINERATION/COMBUSTION: WASTE MANAGEMENT MARKET, BY REGION, 2019–2022 (USD MILLION)
                    TABLE 40 INCINERATION/COMBUSTION: WASTE MANAGEMENT MARKET, BY REGION, 2023–2029 (USD MILLION)
    7.4 LANDFILLS 
           7.4.1 URGENT NEED TO DISPOSE OF NON-RECYCLABLE WASTE TO FUEL MARKET GROWTH
                    TABLE 41 LANDFILLS: WASTE MANAGEMENT MARKET, BY REGION, 2019–2022 (USD MILLION)
                    TABLE 42 LANDFILLS: WASTE MANAGEMENT MARKET, BY REGION, 2023–2029 (USD MILLION)
    7.5 RECYCLING 
           7.5.1 NECESSITY TO REDUCE GREENHOUSE GAS EMISSIONS TO STIMULATE MARKET GROWTH
                    TABLE 43 RECYCLING: WASTE MANAGEMENT MARKET, BY REGION, 2019–2022 (USD MILLION)
                    TABLE 44 RECYCLING: WASTE MANAGEMENT MARKET, BY REGION, 2023–2029 (USD MILLION)
    7.6 COMPOSTING AND ANAEROBIC DIGESTION 
           7.6.1 SIGNIFICANT DEMAND FOR HIGH-QUALITY COMPOST TO FOSTER MARKET GROWTH
                    TABLE 45 COMPOSTING AND ANAEROBIC DIGESTION: WASTE MANAGEMENT MARKET, BY REGION, 2019–2022 (USD MILLION)
                    TABLE 46 COMPOSTING AND ANAEROBIC DIGESTION: WASTE MANAGEMENT MARKET, BY REGION, 2023–2029 (USD MILLION)
 
8 WASTE MANAGEMENT MARKET, BY SOURCE (Page No. - 125)
    8.1 INTRODUCTION 
           FIGURE 35 WASTE MANAGEMENT MARKET SHARE, IN TERMS OF VALUE, BY SOURCE, 2023
           TABLE 47 WASTE MANAGEMENT MARKET, BY SOURCE, 2019–2022 (USD MILLION)
           TABLE 48 WASTE MANAGEMENT MARKET, BY SOURCE, 2023–2029 (USD MILLION)
    8.2 RESIDENTIAL 
           TABLE 49 RESIDENTIAL: WASTE MANAGEMENT MARKET, BY REGION, 2019–2022 (USD MILLION)
           TABLE 50 RESIDENTIAL: WASTE MANAGEMENT MARKET, BY REGION, 2023–2029 (USD MILLION)
           8.2.1 URBAN
                    8.2.1.1 Necessity to provide regular waste collection services to residences to drive market
           8.2.2 RURAL
                    8.2.2.1 Composting and biogas generation initiatives to create growth opportunities
                               TABLE 51 RESIDENTIAL: WASTE MANAGEMENT MARKET, BY SOURCE TYPE, 2019–2022 (USD MILLION)
                               TABLE 52 RESIDENTIAL: WASTE MANAGEMENT MARKET, BY SOURCE TYPE, 2023–2029 (USD MILLION)
    8.3 COMMERCIAL 
           TABLE 53 COMMERCIAL: WASTE MANAGEMENT MARKET, BY REGION, 2019–2022 (USD MILLION)
           TABLE 54 COMMERCIAL: WASTE MANAGEMENT MARKET, BY REGION, 2023–2029 (USD MILLION)
           8.3.1 OFFICES AND RETAIL STORES
                    8.3.1.1 Growing demand for recycling programs and waste reduction strategies to minimize environmental impact to drive market
           8.3.2 HOSPITALS
                    8.3.2.1 Increasing volume of medical waste to foster market growth
           8.3.3 RESTAURANTS
                    8.3.3.1 Need for regular audits to identify opportunities for waste reduction and improvement to boost demand
           8.3.4 OTHER COMMERCIAL SOURCES
                    TABLE 55 COMMERCIAL: WASTE MANAGEMENT MARKET, BY SOURCE TYPE, 2019–2022 (USD MILLION)
                    TABLE 56 COMMERCIAL: WASTE MANAGEMENT MARKET, BY SOURCE TYPE, 2023–2029 (USD MILLION)
    8.4 INDUSTRIAL 
           TABLE 57 INDUSTRIAL: WASTE MANAGEMENT MARKET, BY REGION, 2019–2022 (USD MILLION)
           TABLE 58 INDUSTRIAL: WASTE MANAGEMENT MARKET, BY REGION, 2023–2029 (USD MILLION)
           8.4.1 PROCESS INDUSTRIES
                    8.4.1.1 Stringent regulatory policies for waste characterization, treatment, transportation, and disposal to boost demand
           8.4.2 CONSTRUCTION, RENOVATION, AND DEMOLITION WASTE
                    8.4.2.1 Waste minimization and source reduction strategies to boost demand
           8.4.3 OTHER INDUSTRIAL SOURCES
                    TABLE 59 INDUSTRIAL: WASTE MANAGEMENT MARKET, BY SOURCE TYPE, 2019–2022 (USD MILLION)
                    TABLE 60 INDUSTRIAL: WASTE MANAGEMENT MARKET, BY SOURCE TYPE, 2023–2029 (USD MILLION)
 
9 WASTE MANAGEMENT MARKET, BY REGION (Page No. - 136)
    9.1 INTRODUCTION 
           FIGURE 36 WASTE MANAGEMENT MARKET IN ASIA PACIFIC TO GROW AT HIGHEST CAGR DURING FORECAST PERIOD
           FIGURE 37 WASTE MANAGEMENT MARKET SHARE, BY REGION, 2023
           TABLE 61 WASTE MANAGEMENT MARKET, BY REGION, 2019–2022 (USD MILLION)
           TABLE 62 WASTE MANAGEMENT MARKET, BY REGION, 2023–2029 (USD MILLION)
           TABLE 63 WASTE MANAGEMENT MARKET, BY REGION, 2019–2022 (MILLION METRIC TONS)
           TABLE 64 WASTE MANAGEMENT MARKET, BY REGION, 2023–2029 (MILLION METRIC TONS)
    9.2 NORTH AMERICA 
           9.2.1 NORTH AMERICA: RECESSION IMPACT
                    FIGURE 38 NORTH AMERICA: MARKET SNAPSHOT
                    TABLE 65 NORTH AMERICA: WASTE MANAGEMENT MARKET, BY WASTE TYPE, 2019–2022 (USD MILLION)
                    TABLE 66 NORTH AMERICA: WASTE MANAGEMENT MARKET, BY WASTE TYPE, 2023–2029 (USD MILLION)
                    TABLE 67 NORTH AMERICA: WASTE MANAGEMENT MARKET, BY DISPOSAL METHOD, 2019–2022 (USD MILLION)
                    TABLE 68 NORTH AMERICA: WASTE MANAGEMENT MARKET, BY DISPOSAL METHOD, 2023–2029 (USD MILLION)
                    TABLE 69 NORTH AMERICA: WASTE MANAGEMENT MARKET, BY SOURCE, 2019–2022 (USD MILLION)
                    TABLE 70 NORTH AMERICA: WASTE MANAGEMENT MARKET, BY SOURCE, 2023–2029 (USD MILLION)
                    TABLE 71 NORTH AMERICA: WASTE MANAGEMENT MARKET, BY COUNTRY, 2019–2022 (USD MILLION)
                    TABLE 72 NORTH AMERICA: WASTE MANAGEMENT MARKET, BY COUNTRY, 2023–2029 (USD MILLION)
           9.2.2 US
                    9.2.2.1 Increasing purchasing power of consumers, along with rapid urbanization, to propel market growth
                               TABLE 73 US: WASTE MANAGEMENT MARKET, BY DISPOSAL METHOD, 2019–2022 (USD MILLION)
                               TABLE 74 US: WASTE MANAGEMENT MARKET, BY DISPOSAL METHOD, 2023–2029 (USD MILLION)
                               TABLE 75 US: WASTE MANAGEMENT MARKET, BY SOURCE, 2019–2022 (USD MILLION)
                               TABLE 76 US: WASTE MANAGEMENT MARKET, BY SOURCE, 2023–2029 (USD MILLION)
           9.2.3 CANADA
                    9.2.3.1 Zero plastic waste initiative to boost market growth
                               TABLE 77 CANADA: WASTE MANAGEMENT MARKET, BY DISPOSAL METHOD, 2019–2022 (USD MILLION)
                               TABLE 78 CANADA: WASTE MANAGEMENT MARKET, BY DISPOSAL METHOD, 2023–2029 (USD MILLION)
                               TABLE 79 CANADA: WASTE MANAGEMENT MARKET, BY SOURCE, 2019–2022 (USD MILLION)
                               TABLE 80 CANADA: WASTE MANAGEMENT MARKET, BY SOURCE, 2023–2029 (USD MILLION)
           9.2.4 MEXICO
                    9.2.4.1 Increasing efforts to control plastic pollution to boost demand
                               TABLE 81 MEXICO: WASTE MANAGEMENT MARKET, BY DISPOSAL METHOD, 2019–2022 (USD MILLION)
                               TABLE 82 MEXICO: WASTE MANAGEMENT MARKET, BY DISPOSAL METHOD, 2023–2029 (USD MILLION)
                               TABLE 83 MEXICO: WASTE MANAGEMENT MARKET, BY SOURCE, 2019–2022 (USD MILLION)
                               TABLE 84 MEXICO: WASTE MANAGEMENT MARKET, BY SOURCE, 2023–2029 (USD MILLION)
    9.3 EUROPE 
           TABLE 85 EUROPE: WASTE MANAGEMENT MARKET, BY WASTE TYPE, 2019–2022 (USD MILLION)
           TABLE 86 EUROPE: WASTE MANAGEMENT MARKET, BY WASTE TYPE, 2023–2029 (USD MILLION)
           TABLE 87 EUROPE: WASTE MANAGEMENT MARKET, BY DISPOSAL METHOD, 2019–2022 (USD MILLION)
           TABLE 88 EUROPE: WASTE MANAGEMENT MARKET, BY DISPOSAL METHOD, 2023–2029 (USD MILLION)
           TABLE 89 EUROPE: WASTE MANAGEMENT MARKET, BY SOURCE, 2019–2022 (USD MILLION)
           TABLE 90 EUROPE: WASTE MANAGEMENT MARKET, BY SOURCE, 2023–2029 (USD MILLION)
           TABLE 91 EUROPE: WASTE MANAGEMENT MARKET, BY COUNTRY, 2019–2022 (USD MILLION)
           TABLE 92 EUROPE: WASTE MANAGEMENT MARKET, BY COUNTRY, 2023–2029 (USD MILLION)
           9.3.1 EUROPE: RECESSION IMPACT
           9.3.2 GERMANY
                    9.3.2.1 Government initiatives to enhance solid waste management and recycling techniques to drive market
                               TABLE 93 GERMANY: WASTE MANAGEMENT MARKET, BY DISPOSAL METHOD, 2019–2022 (USD MILLION)
                               TABLE 94 GERMANY: WASTE MANAGEMENT MARKET, BY DISPOSAL METHOD, 2023–2029 (USD MILLION)
                               TABLE 95 GERMANY: WASTE MANAGEMENT MARKET, BY SOURCE, 2019–2022 (USD MILLION)
                               TABLE 96 GERMANY: WASTE MANAGEMENT MARKET, BY SOURCE, 2023–2029 (USD MILLION)
           9.3.3 UK
                    9.3.3.1 Increasing focus on plastic recycling to boost demand
                               TABLE 97 UK: WASTE MANAGEMENT MARKET, BY DISPOSAL METHOD, 2019–2022 (USD MILLION)
                               TABLE 98 UK: WASTE MANAGEMENT MARKET, BY DISPOSAL METHOD, 2023–2029 (USD MILLION)
                               TABLE 99 UK: WASTE MANAGEMENT MARKET, BY SOURCE, 2019–2022 (USD MILLION)
                               TABLE 100 UK: WASTE MANAGEMENT MARKET, BY SOURCE, 2023–2029 (USD MILLION)
           9.3.4 FRANCE
                    9.3.4.1 Growing waste generation from healthcare facilities to drive demand
                               TABLE 101 FRANCE: WASTE MANAGEMENT MARKET, BY DISPOSAL METHOD, 2019–2022 (USD MILLION)
                               TABLE 102 FRANCE: WASTE MANAGEMENT MARKET, BY DISPOSAL METHOD, 2023–2029 (USD MILLION)
                               TABLE 103 FRANCE: WASTE MANAGEMENT MARKET, BY SOURCE, 2019–2022 (USD MILLION)
                               TABLE 104 FRANCE: WASTE MANAGEMENT MARKET, BY SOURCE, 2023–2029 (USD MILLION)
           9.3.5 RUSSIA
                    9.3.5.1 Ongoing Russia–Ukraine war to hamper market growth
                               TABLE 105 RUSSIA: WASTE MANAGEMENT MARKET, BY DISPOSAL METHOD, 2019–2022 (USD MILLION)
                               TABLE 106 RUSSIA: WASTE MANAGEMENT MARKET, BY DISPOSAL METHOD, 2023–2029 (USD MILLION)
                               TABLE 107 RUSSIA: WASTE MANAGEMENT MARKET, BY SOURCE, 2019–2022 (USD MILLION)
                               TABLE 108 RUSSIA: WASTE MANAGEMENT MARKET, BY SOURCE, 2023–2029 (USD MILLION)
           9.3.6 SPAIN
                    9.3.6.1 Increasing focus on waste reduction and recycling to boost demand
                               TABLE 109 SPAIN: WASTE MANAGEMENT MARKET, BY DISPOSAL METHOD, 2019–2022 (USD MILLION)
                               TABLE 110 SPAIN: WASTE MANAGEMENT MARKET, BY DISPOSAL METHOD, 2023–2029 (USD MILLION)
                               TABLE 111 SPAIN: WASTE MANAGEMENT MARKET, BY SOURCE, 2019–2022 (USD MILLION)
                               TABLE 112 SPAIN: WASTE MANAGEMENT MARKET, BY SOURCE, 2023–2029 (USD MILLION)
           9.3.7 REST OF EUROPE
                    TABLE 113 REST OF EUROPE: WASTE MANAGEMENT MARKET, BY DISPOSAL METHOD, 2019–2022 (USD MILLION)
                    TABLE 114 REST OF EUROPE: WASTE MANAGEMENT MARKET, BY DISPOSAL METHOD, 2023–2029 (USD MILLION)
                    TABLE 115 REST OF EUROPE: WASTE MANAGEMENT MARKET, BY SOURCE, 2019–2022 (USD MILLION)
                    TABLE 116 REST OF EUROPE: WASTE MANAGEMENT MARKET, BY SOURCE, 2023–2029 (USD MILLION)
    9.4 ASIA PACIFIC 
           9.4.1 ASIA PACIFIC: RECESSION IMPACT
                    FIGURE 39 ASIA PACIFIC: MARKET SNAPSHOT
                    TABLE 117 ASIA PACIFIC: WASTE MANAGEMENT MARKET, BY WASTE TYPE, 2019–2022 (USD MILLION)
                    TABLE 118 ASIA PACIFIC: WASTE MANAGEMENT MARKET, BY WASTE TYPE, 2023–2029 (USD MILLION)
                    TABLE 119 ASIA PACIFIC: WASTE MANAGEMENT MARKET, BY DISPOSAL METHOD, 2019–2022 (USD MILLION)
                    TABLE 120 ASIA PACIFIC: WASTE MANAGEMENT MARKET, BY DISPOSAL METHOD, 2023–2029 (USD MILLION)
                    TABLE 121 ASIA PACIFIC: WASTE MANAGEMENT MARKET, BY SOURCE, 2019–2022 (USD MILLION)
                    TABLE 122 ASIA PACIFIC: WASTE MANAGEMENT MARKET, BY SOURCE, 2023–2029 (USD MILLION)
                    TABLE 123 ASIA PACIFIC: WASTE MANAGEMENT MARKET, BY COUNTRY, 2019–2022 (USD MILLION)
                    TABLE 124 ASIA PACIFIC: WASTE MANAGEMENT MARKET, BY COUNTRY, 2023–2029 (USD MILLION)
           9.4.2 CHINA
                    9.4.2.1 Rising focus of government on reducing plastic pollution to drive market
                               TABLE 125 CHINA: WASTE MANAGEMENT MARKET, BY DISPOSAL METHOD, 2019–2022 (USD MILLION)
                               TABLE 126 CHINA: WASTE MANAGEMENT MARKET, BY DISPOSAL METHOD, 2023–2029 (USD MILLION)
                               TABLE 127 CHINA: WASTE MANAGEMENT MARKET, BY SOURCE, 2019–2022 (USD MILLION)
                               TABLE 128 CHINA: WASTE MANAGEMENT MARKET, BY SOURCE, 2023–2029 (USD MILLION)
           9.4.3 JAPAN
                    9.4.3.1 Growing emphasis on waste recycling to accelerate market growth
                               TABLE 129 JAPAN: WASTE MANAGEMENT MARKET, BY DISPOSAL METHOD, 2019–2022 (USD MILLION)
                               TABLE 130 JAPAN: WASTE MANAGEMENT MARKET, BY DISPOSAL METHOD, 2023–2029 (USD MILLION)
                               TABLE 131 JAPAN: WASTE MANAGEMENT MARKET, BY SOURCE, 2019–2022 (USD MILLION)
                               TABLE 132 JAPAN: WASTE MANAGEMENT MARKET, BY SOURCE, 2023–2029 (USD MILLION)
           9.4.4 INDIA
                    9.4.4.1 Increasing government investment in waste management and recycling strategies to support market growth
                               TABLE 133 INDIA: WASTE MANAGEMENT MARKET, BY DISPOSAL METHOD, 2019–2022 (USD MILLION)
                               TABLE 134 INDIA: WASTE MANAGEMENT MARKET, BY DISPOSAL METHOD, 2023–2029 (USD MILLION)
                               TABLE 135 INDIA: WASTE MANAGEMENT MARKET, BY SOURCE, 2019–2022 (USD MILLION)
                               TABLE 136 INDIA: WASTE MANAGEMENT MARKET, BY SOURCE, 2023–2029 (USD MILLION)
           9.4.5 AUSTRALIA
                    9.4.5.1 Increasing focus of government on recycling e-waste to stimulate market growth
                               TABLE 137 AUSTRALIA: WASTE MANAGEMENT MARKET, BY DISPOSAL METHOD, 2019–2022 (USD MILLION)
                               TABLE 138 AUSTRALIA: WASTE MANAGEMENT MARKET, BY DISPOSAL METHOD, 2023–2029 (USD MILLION)
                               TABLE 139 AUSTRALIA: WASTE MANAGEMENT MARKET, BY SOURCE, 2019–2022 (USD MILLION)
                               TABLE 140 AUSTRALIA: WASTE MANAGEMENT MARKET, BY SOURCE, 2023–2029 (USD MILLION)
           9.4.6 SOUTH KOREA
                    9.4.6.1 Surging need to transform waste into energy to meet rising energy demand to stimulate market growth
                               TABLE 141 SOUTH KOREA: WASTE MANAGEMENT MARKET, BY DISPOSAL METHOD, 2019–2022 (USD MILLION)
                               TABLE 142 SOUTH KOREA: WASTE MANAGEMENT MARKET, BY DISPOSAL METHOD, 2023–2029 (USD MILLION)
                               TABLE 143 SOUTH KOREA: WASTE MANAGEMENT MARKET, BY SOURCE, 2019–2022 (USD MILLION)
                               TABLE 144 SOUTH KOREA: WASTE MANAGEMENT MARKET, BY SOURCE, 2023–2029 (USD MILLION)
           9.4.7 REST OF ASIA PACIFIC
                    TABLE 145 REST OF ASIA PACIFIC: WASTE MANAGEMENT MARKET, BY DISPOSAL METHOD, 2019–2022 (USD MILLION)
                    TABLE 146 REST OF ASIA PACIFIC: WASTE MANAGEMENT MARKET, BY DISPOSAL METHOD, 2023–2029 (USD MILLION)
                    TABLE 147 REST OF ASIA PACIFIC: WASTE MANAGEMENT MARKET, BY SOURCE, 2019–2022 (USD MILLION)
                    TABLE 148 REST OF ASIA PACIFIC: WASTE MANAGEMENT MARKET, BY SOURCE, 2023–2029 (USD MILLION)
    9.5 SOUTH AMERICA 
           TABLE 149 SOUTH AMERICA: WASTE MANAGEMENT MARKET, BY WASTE TYPE, 2019–2022 (USD MILLION)
           TABLE 150 SOUTH AMERICA: WASTE MANAGEMENT MARKET, BY WASTE TYPE, 2023–2029 (USD MILLION)
           TABLE 151 SOUTH AMERICA: WASTE MANAGEMENT MARKET, BY DISPOSAL METHOD, 2019–2022 (USD MILLION)
           TABLE 152 SOUTH AMERICA: WASTE MANAGEMENT MARKET, BY DISPOSAL METHOD, 2023–2029 (USD MILLION)
           TABLE 153 SOUTH AMERICA: WASTE MANAGEMENT MARKET, BY SOURCE, 2019–2022 (USD MILLION)
           TABLE 154 SOUTH AMERICA: WASTE MANAGEMENT MARKET, BY SOURCE, 2023–2029 (USD MILLION)
           TABLE 155 SOUTH AMERICA: WASTE MANAGEMENT MARKET, BY COUNTRY, 2019–2022 (USD MILLION)
           TABLE 156 SOUTH AMERICA: WASTE MANAGEMENT MARKET, BY COUNTRY, 2023–2029 (USD MILLION)
           9.5.1 SOUTH AMERICA: RECESSION IMPACT
           9.5.2 BRAZIL
                    9.5.2.1 Government initiatives in solid waste management to drive market
                               TABLE 157 BRAZIL: WASTE MANAGEMENT MARKET, BY DISPOSAL METHOD, 2019–2022 (USD MILLION)
                               TABLE 158 BRAZIL: WASTE MANAGEMENT MARKET, BY DISPOSAL METHOD, 2023–2029 (USD MILLION)
                               TABLE 159 BRAZIL: WASTE MANAGEMENT MARKET, BY SOURCE, 2019–2022 (USD MILLION)
                               TABLE 160 BRAZIL: WASTE MANAGEMENT MARKET, BY SOURCE, 2023–2029 (USD MILLION)
           9.5.3 ARGENTINA
                    9.5.3.1 Increasing use of plastic packaging in food & beverages, pharmaceuticals, and electronics industries to support market growth
                               TABLE 161 ARGENTINA: WASTE MANAGEMENT MARKET, BY DISPOSAL METHOD, 2019–2022 (USD MILLION)
                               TABLE 162 ARGENTINA: WASTE MANAGEMENT MARKET, BY DISPOSAL METHOD, 2023–2029 (USD MILLION)
                               TABLE 163 ARGENTINA: WASTE MANAGEMENT MARKET, BY SOURCE, 2019–2022 (USD MILLION)
                               TABLE 164 ARGENTINA: WASTE MANAGEMENT MARKET, BY SOURCE, 2023–2029 (USD MILLION)
           9.5.4 CHILE
                    9.5.4.1 Growing municipal solid waste generation to spike demand for waste management services
                               TABLE 165 CHILE: WASTE MANAGEMENT MARKET, BY DISPOSAL METHOD, 2019–2022 (USD MILLION)
                               TABLE 166 CHILE: WASTE MANAGEMENT MARKET, BY DISPOSAL METHOD, 2023–2029 (USD MILLION)
                               TABLE 167 CHILE: WASTE MANAGEMENT MARKET, BY SOURCE, 2019–2022 (USD MILLION)
                               TABLE 168 CHILE: WASTE MANAGEMENT MARKET, BY SOURCE, 2023–2029 (USD MILLION)
           9.5.5 REST OF SOUTH AMERICA
                    TABLE 169 REST OF SOUTH AMERICA: WASTE MANAGEMENT MARKET, BY DISPOSAL METHOD, 2019–2022 (USD MILLION)
                    TABLE 170 REST OF SOUTH AMERICA: WASTE MANAGEMENT MARKET, BY DISPOSAL METHOD, 2023–2029 (USD MILLION)
                    TABLE 171 REST OF SOUTH AMERICA: WASTE MANAGEMENT MARKET, BY SOURCE, 2019–2022 (USD MILLION)
                    TABLE 172 REST OF SOUTH AMERICA: WASTE MANAGEMENT MARKET, BY SOURCE, 2023–2029 (USD MILLION)
    9.6 MIDDLE EAST & AFRICA 
           TABLE 173 MIDDLE EAST & AFRICA: WASTE MANAGEMENT MARKET, BY WASTE TYPE, 2019–2022 (USD MILLION)
           TABLE 174 MIDDLE EAST & AFRICA: WASTE MANAGEMENT MARKET, BY WASTE TYPE, 2023–2029 (USD MILLION)
           TABLE 175 MIDDLE EAST & AFRICA: WASTE MANAGEMENT MARKET, BY DISPOSAL METHOD, 2019–2022 (USD MILLION)
           TABLE 176 MIDDLE EAST & AFRICA: WASTE MANAGEMENT MARKET, BY DISPOSAL METHOD, 2023–2029 (USD MILLION)
           TABLE 177 MIDDLE EAST & AFRICA: WASTE MANAGEMENT MARKET, BY SOURCE, 2019–2022 (USD MILLION)
           TABLE 178 MIDDLE EAST & AFRICA: WASTE MANAGEMENT MARKET, BY SOURCE, 2023–2029 (USD MILLION)
           TABLE 179 MIDDLE EAST & AFRICA: WASTE MANAGEMENT MARKET, BY COUNTRY, 2019–2022 (USD MILLION)
           TABLE 180 MIDDLE EAST & AFRICA: WASTE MANAGEMENT MARKET, BY COUNTRY, 2023–2029 (USD MILLION)
           9.6.1 MIDDLE EAST & AFRICA: RECESSION IMPACT
                    9.6.1.1 GCC
                               TABLE 181 GCC: WASTE MANAGEMENT MARKET, BY COUNTRY, 2019–2022 (USD MILLION)
                               TABLE 182 GCC: WASTE MANAGEMENT MARKET, BY COUNTRY, 2023–2029 (USD MILLION)
                    9.6.1.2 UAE
                               9.6.1.2.1 Escalated need to generate clean energy to encourage adoption of waste management services
                               TABLE 183 UAE: WASTE MANAGEMENT MARKET, BY DISPOSAL METHOD, 2019–2022 (USD MILLION)
                               TABLE 184 UAE: WASTE MANAGEMENT MARKET, BY DISPOSAL METHOD, 2023–2029 (USD MILLION)
                               TABLE 185 UAE: WASTE MANAGEMENT MARKET, BY SOURCE, 2019–2022 (USD MILLION)
                               TABLE 186 UAE: WASTE MANAGEMENT MARKET, BY SOURCE, 2023–2029 (USD MILLION)
                    9.6.1.3 Rest of GCC
                               TABLE 187 REST OF GCC: WASTE MANAGEMENT MARKET, BY DISPOSAL METHOD, 2019–2022 (USD MILLION)
                               TABLE 188 REST OF GCC: WASTE MANAGEMENT MARKET, BY DISPOSAL METHOD, 2023–2029 (USD MILLION)
                               TABLE 189 REST OF GCC: WASTE MANAGEMENT MARKET, BY SOURCE, 2019–2022 (USD MILLION)
                               TABLE 190 REST OF GCC: WASTE MANAGEMENT MARKET, BY SOURCE, 2023–2029 (USD MILLION)
           9.6.2 SOUTH AFRICA
                    9.6.2.1 Elevated focus on recycling domestic waste to boost market growth
                               TABLE 191 SOUTH AFRICA: WASTE MANAGEMENT MARKET, BY DISPOSAL METHOD, 2019–2022 (USD MILLION)
                               TABLE 192 SOUTH AFRICA: WASTE MANAGEMENT MARKET, BY DISPOSAL METHOD, 2023–2029 (USD MILLION)
                               TABLE 193 SOUTH AFRICA: WASTE MANAGEMENT MARKET, BY SOURCE, 2019–2022 (USD MILLION)
                               TABLE 194 SOUTH AFRICA: WASTE MANAGEMENT MARKET, BY SOURCE, 2023–2029 (USD MILLION)
           9.6.3 REST OF MIDDLE EAST & AFRICA
                    TABLE 195 REST OF MIDDLE EAST & AFRICA: WASTE MANAGEMENT MARKET, BY DISPOSAL METHOD, 2019–2022 (USD MILLION)
                    TABLE 196 REST OF MIDDLE EAST & AFRICA: WASTE MANAGEMENT MARKET, BY DISPOSAL METHOD, 2023–2029 (USD MILLION)
                    TABLE 197 REST OF MIDDLE EAST & AFRICA: WASTE MANAGEMENT MARKET, BY SOURCE, 2019–2022 (USD MILLION)
                    TABLE 198 REST OF MIDDLE EAST & AFRICA: WASTE MANAGEMENT MARKET, BY SOURCE, 2023–2029 (USD MILLION)
 
10 COMPETITIVE LANDSCAPE (Page No. - 205)
     10.1 OVERVIEW 
     10.2 KEY PLAYER STRATEGIES/RIGHT TO WIN, 2019–2023 
               TABLE 199 WASTE MANAGEMENT MARKET: OVERVIEW OF STRATEGIES ADOPTED BY KEY PLAYERS, 2019–2023
     10.3 MARKET SHARE ANALYSIS, 2023 
               TABLE 200 WASTE MANAGEMENT MARKET: DEGREE OF COMPETITION, 2023
               FIGURE 40 WASTE MANAGEMENT MARKET SHARE ANALYSIS, 2023
     10.4 MARKET EVALUATION FRAMEWORK, 2019–2023 
               TABLE 201 WASTE MANAGEMENT MARKET EVALUATION FRAMEWORK, 2019–2023
     10.5 REVENUE ANALYSIS OF TOP 5 PLAYERS, 2018–2022 
               FIGURE 41 FIVE-YEAR REVENUE ANALYSIS OF TOP 5 PLAYERS IN WASTE MANAGEMENT MARKET, 2018–2022
     10.6 COMPANY VALUATION AND FINANCIAL METRICS 
               FIGURE 42 WASTE MANAGEMENT MARKET: COMPANY VALUATION
               FIGURE 43 WASTE MANAGEMENT MARKET: FINANCIAL METRICS
     10.7 BRAND COMPARISON 
               FIGURE 44 WASTE MANAGEMENT MARKET: BRAND COMPARISON
     10.8 COMPETITIVE SCENARIOS AND TRENDS 
             10.8.1 PRODUCT/SERVICE LAUNCHES
                       TABLE 202 WASTE MANAGEMENT MARKET: PRODUCT/SERVICE LAUNCHES, JANUARY 2019–DECEMBER 2023
             10.8.2 DEALS
                       TABLE 203 WASTE MANAGEMENT MARKET: DEALS, JANUARY 2019–DECEMBER 2023
             10.8.3 EXPANSIONS
                       TABLE 204 WASTE MANAGEMENT MARKET: EXPANSIONS, JANUARY 2019–DECEMBER 2023
             10.8.4 CONTRACTS
                       TABLE 205 WASTE MANAGEMENT MARKET: CONTRACTS, JANUARY 2019–DECEMBER 2023
     10.9 COMPANY EVALUATION MATRIX: KEY PLAYERS, 2023 
             10.9.1 STARS
             10.9.2 EMERGING LEADERS
             10.9.3 PERVASIVE PLAYERS
             10.9.4 PARTICIPANTS
                       FIGURE 45 WASTE MANAGEMENT MARKET: COMPANY EVALUATION MATRIX (KEY PLAYERS), 2023
             10.9.5 COMPANY FOOTPRINT: KEY PLAYERS
                       10.9.5.1 Company overall footprint
                                   FIGURE 46 WASTE MANAGEMENT MARKET: COMPANY OVERALL FOOTPRINT
                       10.9.5.2 Company market footprint
                                   FIGURE 47 WASTE MANAGEMENT MARKET: COMPANY MARKET FOOTPRINT
                       10.9.5.3 Region footprint
                                   TABLE 206 WASTE MANAGEMENT MARKET: REGION FOOTPRINT
                       10.9.5.4 Waste type footprint
                                   TABLE 207 WASTE MANAGEMENT MARKET: WASTE TYPE FOOTPRINT
                       10.9.5.5 Disposal method footprint
                                   TABLE 208 WASTE MANAGEMENT MARKET: DISPOSAL METHOD FOOTPRINT
                       10.9.5.6 Source footprint
                                   TABLE 209 WASTE MANAGEMENT MARKET: SOURCE FOOTPRINT
     10.1 COMPANY EVALUATION MATRIX: STARTUPS/SMES, 2023 
               10.10.1 PROGRESSIVE COMPANIES
               10.10.2 RESPONSIVE COMPANIES
               10.10.3 DYNAMIC COMPANIES
               10.10.4 STARTING BLOCKS
                                   FIGURE 48 WASTE MANAGEMENT MARKET: COMPANY EVALUATION MATRIX (STARTUPS/SMES), 2023
               10.10.5 COMPETITIVE BENCHMARKING, STARTUPS/SMES, 2023
            10.10.5.1 List of key startups/SMEs
                                   TABLE 210 WASTE MANAGEMENT MARKET: LIST OF KEY STARTUPS/SMES
            10.10.5.2 Competitive benchmarking of startups/SMEs, 2023
                                   TABLE 211 WASTE MANAGEMENT MARKET: COMPETITIVE BENCHMARKING OF KEY STARTUPS/SMES
 
11 COMPANY PROFILES (Page No. - 228)
     11.1 KEY COMPANIES 
(Business Overview, Products/Services/Solutions Offered, MnM View, Key Strengths and Right to Win, Strategic Choices Made, Weaknesses and Competitive Threats, Recent Developments)*
             11.1.1 WM INTELLECTUAL PROPERTY HOLDINGS, L.L.C.
                       TABLE 212 WM INTELLECTUAL PROPERTY HOLDINGS, L.L.C.: COMPANY OVERVIEW
                       FIGURE 49 WM INTELLECTUAL PROPERTY HOLDINGS, L.L.C.: COMPANY SNAPSHOT
                       TABLE 213 WM INTELLECTUAL PROPERTY HOLDINGS, L.L.C.: PRODUCTS/SOLUTIONS/SERVICES OFFERED
                       TABLE 214 WM INTELLECTUAL PROPERTY HOLDINGS, L.L.C.: PRODUCT/SERVICE LAUNCHES
                       TABLE 215 WM INTELLECTUAL PROPERTY HOLDINGS, L.L.C.: DEALS
                       TABLE 216 WM INTELLECTUAL PROPERTY HOLDINGS, L.L.C.: EXPANSIONS
                       TABLE 217 WM INTELLECTUAL PROPERTY HOLDINGS, L.L.C.: OTHERS
             11.1.2 SUEZ
                       TABLE 218 SUEZ: COMPANY OVERVIEW
                       FIGURE 50 SUEZ: COMPANY SNAPSHOT
                       TABLE 219 SUEZ: PRODUCTS/SOLUTIONS/SERVICES OFFERED
                       TABLE 220 SUEZ: DEALS
                       TABLE 221 SUEZ: EXPANSIONS
                       TABLE 222 SUEZ: OTHERS
             11.1.3 VEOLIA
                       TABLE 223 VEOLIA: COMPANY OVERVIEW
                       FIGURE 51 VEOLIA: COMPANY SNAPSHOT
                       TABLE 224 VEOLIA: PRODUCTS/SOLUTIONS/SERVICES OFFERED
                       TABLE 225 VEOLIA: DEALS
                       TABLE 226 VEOLIA: OTHERS
             11.1.4 WASTE CONNECTIONS
                       TABLE 227 WASTE CONNECTIONS: COMPANY OVERVIEW
                       FIGURE 52 WASTE CONNECTIONS: COMPANY SNAPSHOT
                       TABLE 228 WASTE CONNECTIONS: PRODUCTS/SOLUTIONS/SERVICES OFFERED
                       TABLE 229 WASTE CONNECTIONS: DEALS
             11.1.5 REPUBLIC SERVICES
                       TABLE 230 REPUBLIC SERVICES: COMPANY OVERVIEW
                       FIGURE 53 REPUBLIC SERVICES: COMPANY SNAPSHOT
                       TABLE 231 REPUBLIC SERVICES: PRODUCTS/SOLUTIONS/SERVICES OFFERED
                       TABLE 232 REPUBLIC SERVICES: DEALS
                       TABLE 233 REPUBLIC SERVICES: EXPANSIONS
             11.1.6 BIFFA
                       TABLE 234 BIFFA: COMPANY OVERVIEW
                       FIGURE 54 BIFFA: COMPANY SNAPSHOT
                       TABLE 235 BIFFA: PRODUCTS/SOLUTIONS/SERVICES OFFERED
                       TABLE 236 BIFFA: DEALS
                       TABLE 237 BIFFA: OTHERS
             11.1.7 CLEAN HARBORS, INC.
                       TABLE 238 CLEAN HARBORS, INC.: COMPANY OVERVIEW
                       FIGURE 55 CLEAN HARBORS, INC.: COMPANY SNAPSHOT
                       TABLE 239 CLEAN HARBORS, INC.: PRODUCTS/SOLUTIONS/SERVICES OFFERED
                       TABLE 240 CLEAN HARBORS, INC.: DEALS
             11.1.8 COVANTA HOLDING CORPORATION
                       TABLE 241 COVANTA HOLDING CORPORATION: COMPANY OVERVIEW
                       FIGURE 56 COVANTA HOLDING CORPORATION: COMPANY SNAPSHOT
                       TABLE 242 COVANTA HOLDING CORPORATION: PRODUCTS/SOLUTIONS/SERVICES OFFERED
                       TABLE 243 COVANTA HOLDING CORPORATION: DEALS
             11.1.9 DAISEKI CO., LTD.
                       TABLE 244 DAISEKI CO., LTD.: COMPANY OVERVIEW
                       FIGURE 57 DAISEKI CO., LTD.: COMPANY SNAPSHOT
                       TABLE 245 DAISEKI CO., LTD.: PRODUCTS/SOLUTIONS/SERVICES OFFERED
                       TABLE 246 DAISEKI CO., LTD.: DEALS
             11.1.10 HITACHI ZOSEN CORPORATION
                                   TABLE 247 HITACHI ZOSEN CORPORATION: COMPANY OVERVIEW
                                   FIGURE 58 HITACHI ZOSEN CORPORATION: COMPANY SNAPSHOT
                                   TABLE 248 HITACHI ZOSEN CORPORATION: PRODUCTS/SOLUTIONS/SERVICES OFFERED
                                   TABLE 249 HITACHI ZOSEN CORPORATION: EXPANSIONS, JANUARY 2020-DECEMBER 2023
                                   TABLE 250 HITACHI ZOSEN CORPORATION: DEALS
                                   TABLE 251 HITACHI ZOSEN CORPORATION: OTHERS
             11.1.11 REMONDIS SE & CO. KG
                                   TABLE 252 REMONDIS SE & CO. KG: COMPANY OVERVIEW
                                   TABLE 253 REMONDIS SE & CO. KG: PRODUCTS/SOLUTIONS/SERVICES OFFERED
                                   TABLE 254 REMONDIS SE & CO. KG: DEALS
             11.1.12 URBASER
                                   TABLE 255 URBASER: COMPANY OVERVIEW
                                   TABLE 256 URBASER: PRODUCTS/SOLUTIONS/SERVICES OFFERED
                                   TABLE 257 URBASER: PRODUCT/SERVICE LAUNCHES
                                   TABLE 258 URBASER: DEALS
                                   TABLE 259 URBASER: EXPANSIONS
                                   TABLE 260 URBASER: OTHERS
             11.1.13 STERICYCLE, INC.
                                   TABLE 261 STERICYCLE, INC.: COMPANY OVERVIEW
                                   FIGURE 59 STERICYCLE, INC.: COMPANY SNAPSHOT
                                   TABLE 262 STERICYCLE, INC.: PRODUCTS/SOLUTIONS/SERVICES OFFERED
                                   TABLE 263 STERICYCLE, INC.: PRODUCT/SERVICE LAUNCHES
                                   TABLE 264 STERICYCLE, INC.: DEALS
             11.1.14 GFL ENVIRONMENTAL INC.
                                   TABLE 265 GFL ENVIRONMENTAL INC.: COMPANY OVERVIEW
                                   FIGURE 60 GFL ENVIRONMENTAL INC.: COMPANY SNAPSHOT
                                   TABLE 266 GFL ENVIRONMENTAL INC.: PRODUCTS/SOLUTIONS/SERVICES OFFERED
                                   TABLE 267 GFL ENVIRONMENTAL INC.: DEALS
             11.1.15 BINGO INDUSTRIES
                                   TABLE 268 BINGO INDUSTRIES: COMPANY OVERVIEW
                                   FIGURE 61 BINGO INDUSTRIES: COMPANY SNAPSHOT
                                   TABLE 269 BINGO INDUSTRIES: PRODUCTS/SOLUTIONS/SERVICES OFFERED
                                   TABLE 270 BINGO INDUSTRIES: DEALS
*Business Overview, Products/Services/Solutions Offered, MnM View, Key Strengths and Right to Win, Strategic Choices Made, Weaknesses and Competitive Threats, Recent Developments might not be captured in case of unlisted companies.
     11.2 OTHER PLAYERS 
             11.2.1 FCC ENVIRONMENTAL SERVICES
             11.2.2 BIOMEDICAL WASTE SOLUTIONS
             11.2.3 VALICOR
             11.2.4 RECOLOGY
             11.2.5 ESTRE
     11.3 SMES PLAYERS 
             11.3.1 RECYGLO COMPANY PTE. LTD.
             11.3.2 RECYCLE TRACK SYSTEMS
             11.3.3 RECYCLING TECHNOLOGIES LTD.
             11.3.4 REKOSISTEM
             11.3.5 SAAHAS ZERO WASTE
 
12 APPENDIX (Page No. - 295)
     12.1 INSIGHTS FROM INDUSTRY EXPERTS 
     12.2 DISCUSSION GUIDE 
     12.3 KNOWLEDGESTORE: MARKETSANDMARKETS’ SUBSCRIPTION PORTAL 
     12.4 CUSTOMIZATION OPTIONS 
     12.5 RELATED REPORTS 
     12.6 AUTHOR DETAILS 

The study involved major activities in estimating the current size of the waste management market. Exhaustive secondary research was done to collect information on the peer and parent markets. The next step was to validate these findings, assumptions, and sizing with industry experts across the value chain through primary research. Both top-down and bottom-up approaches were employed to estimate the total market size. Thereafter, market breakdown and data triangulation were used to estimate the market size of the segments and subsegments.

Secondary Research

This research study on the waste management market involved the use of extensive secondary sources, directories, and databases, such as Eurostat (Luxembourg), The Organisation for Economic Co-operation and Development (OECD) (France), The World Bank Group (US), Food and Agriculture Organization of the United Nations (FAO) (Italy), United Nations Environment Programme (UNEP), UNIDO United Nations Industrial Development Organization (Austria) to collect and identify information useful for a technical, market-oriented, and commercial study of the waste management market. The other secondary sources included annual reports, press releases & investor presentations of companies, white papers, certified publications, articles by recognized authors, manufacturer associations, trade directories, and databases.

Primary Research

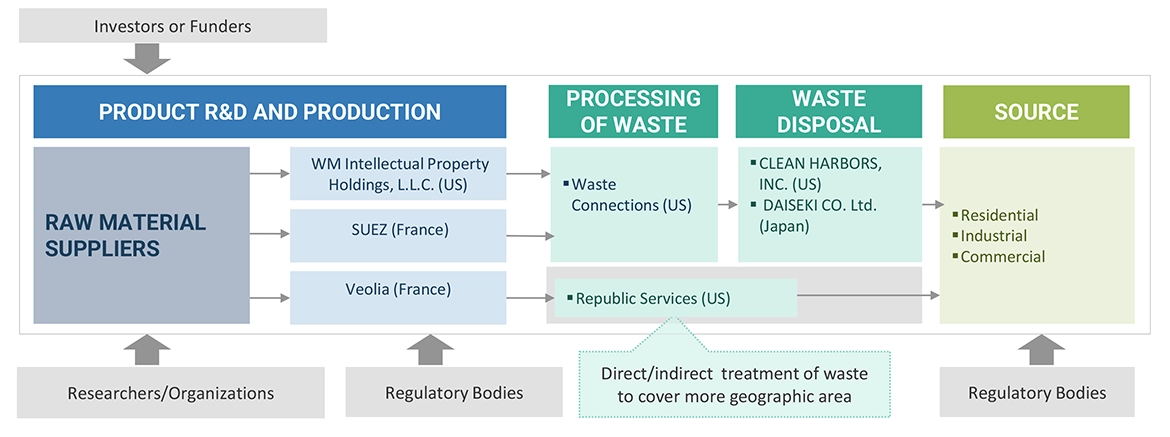
The waste management market comprises several stakeholders, such as waste management manufacturers, technology providers, and technical support providers in the supply chain. The demand side of this market is characterized by the rising demand for waste management in various sources such as residential, industrial, and commercial sectors. The supply side is characterized by rising demand for contracts from the industrial sector and mergers & acquisitions among big players. Various primary sources from both the supply and demand sides of the market were interviewed to obtain qualitative and quantitative information. Following is the breakdown of primary respondents:

Waste Management  Market Size, and Share

To know about the assumptions considered for the study, download the pdf brochure

Market Size Estimation

Both top-down and bottom-up approaches were used to estimate and validate the total size of the waste management market. These methods were also used extensively to estimate the size of various subsegments in the market. The research methodology used to estimate the market size includes the following:

  • The key players in the industry and market have been identified through extensive secondary research, and their market share has been determined through primary and secondary research.
  • The industry’s value chain and market size, in terms of value, have been determined through both primary and secondary research processes.
  • All percentage shares, splits, and breakdowns have been determined using secondary sources and verified through primary sources.

Waste management Market Size: Top-Down Approach

Waste Management  Market Top Down Approach

To know about the assumptions considered for the study, Request for Free Sample Report

Waste management Market Size: Bottom-Up Approach

Waste Management  Market Bottom Up Approach

Data Triangulation

After arriving at the overall market size from the above estimation process, the total market has been split into several segments and subsegments. Data triangulation and market breakdown processes have been employed to complete the overall market engineering process and arrive at the exact statistics for all the segments and sub-segments, wherever applicable. The data has been triangulated by studying various factors and trends from both the demand- and supply sides. Along with this, the market has been validated using both the top-down and bottom-up approaches.

Market Definition

Waste management refers to the various schemes and strategies used to manage and dispose of different types of waste, including industrial, biological, household, municipal, organic, biomedical, and radioactive wastes. It encompasses processes such as waste collection, transport, treatment, and disposal, as well as monitoring and regulation of the waste management process and waste-related laws, technologies, and economic mechanisms.  It involves the implementation of comprehensive strategies to efficiently manage waste, including methods such as recycling, composting, incineration, landfills, bioremediation, waste to energy, and waste minimization.

Key Stakeholders

  • Maintenance and other major service providers
  • Waste management component manufacturers
  • Government and research organizations
  • Institutional investors
  • National and local government organizations
  • Waste management equipment manufacturers
  • Waste management manufacturing companies
  • Technology standard organizations, forums, alliances, and associations

State and national regulatory authorities Objectives of the Study

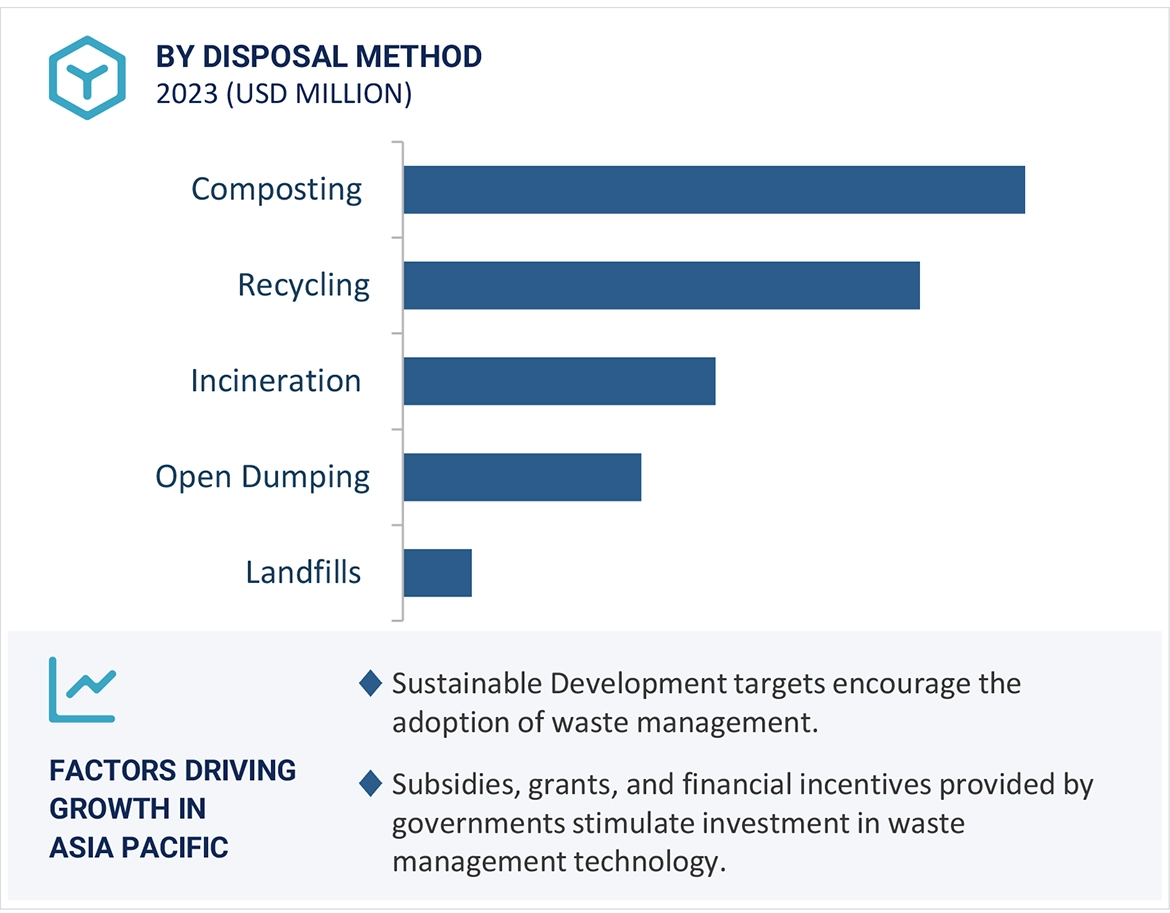
  • To define, describe, segment, and forecast the size of the waste management market based on waste type, disposal method and by source in terms of value.
  • To describe and forecast the market for five key regions: Asia Pacific, North America, Europe, Latin America, and Middle East & Africa, along with their country-level market sizes in terms of value.
  • To forecast the waste management market by region, in terms of volume
  • To provide detailed information regarding key drivers, restraints, opportunities, and challenges influencing the growth of the market.
  • To strategically analyze micro markets with respect to individual growth trends, prospects, and contributions to the overall market size.
  • To provide the supply chain analysis, trends/disruptions impacting the customer’s business, market map, pricing analysis, and regulatory analysis of the waste management market.
  • To analyze opportunities for stakeholders in the waste management market and draw a competitive landscape of the market.
  • To strategically analyze the ecosystem, tariffs and regulations, patent landscape, trade landscape, Porter’s five forces, and case studies pertaining to the market under study.
  • To benchmark market players using the company evaluation quadrant, which analyzes market players on broad categories of business and product strategies adopted by them.
  • To compare key market players with respect to product specifications and applications.
  • To strategically profile key players and comprehensively analyze their market rankings and core competencies.
  • To analyze competitive developments, such as contracts & agreements, investments & expansions, mergers & acquisitions, new product launches, partnerships, joint ventures & collaborations, in the waste management market.

Available Customizations:

With the given market data, MarketsandMarkets offers customizations according to the specific requirements of companies. The following customization options are available for the report:

Product Analysis

  • Product Matrix, which provides a detailed comparison of the product portfolio of each company

Company Information

  • Detailed analyses and profiling of additional market players
Custom Market Research Services

We will customize the research for you, in case the report listed above does not meet with your exact requirements. Our custom research will comprehensively cover the business information you require to help you arrive at strategic and profitable business decisions.

Request Customization

Instant Answers with GPT - Ask Now!

Ask real questions. Get complete answers !
Report Code
EP 7931
Published ON
Apr, 2024
Choose License Type
BUY NOW
  • SHARE
X
Request Customization
Speak to Analyst
Speak to Analyst
OR FACE-TO-FACE MEETING
PERSONALIZE THIS RESEARCH
  • Triangulate with your Own Data
  • Get Data as per your Format and Definition
  • Gain a Deeper Dive on a Specific Application, Geography, Customer or Competitor
  • Any level of Personalization
REQUEST A FREE CUSTOMIZATION
LET US HELP YOU!
  • What are the Known and Unknown Adjacencies Impacting the Waste Management Market
  • What will your New Revenue Sources be?
  • Who will be your Top Customer; what will make them switch?
  • Defend your Market Share or Win Competitors
  • Get a Scorecard for Target Partners
CUSTOMIZED WORKSHOP REQUEST
+1-888-600-6441
  • Call Us
  • +1-888-600-6441 (Corporate office hours)
  • +1-888-600-6441 (US/Can toll free)
  • +44-800-368-9399 (UK office hours)
CONNECT WITH US
ABOUT TRUST ONLINE
©2024 MarketsandMarkets Research Private Ltd. All rights reserved
DMCA.com Protection Status Website Feedback