
Artificial Intelligence in Energy Market

Artificial Intelligence in Energy Market by Application (Energy Demand Forecasting, Grid Optimization & Management, Energy Storage Optimization), End Use (Generation, Transmission, Distribution, Consumption) - Global Forecast to 2030


OVERVIEW
Source: Secondary Research, Interviews with Experts, MarketsandMarkets Analysis
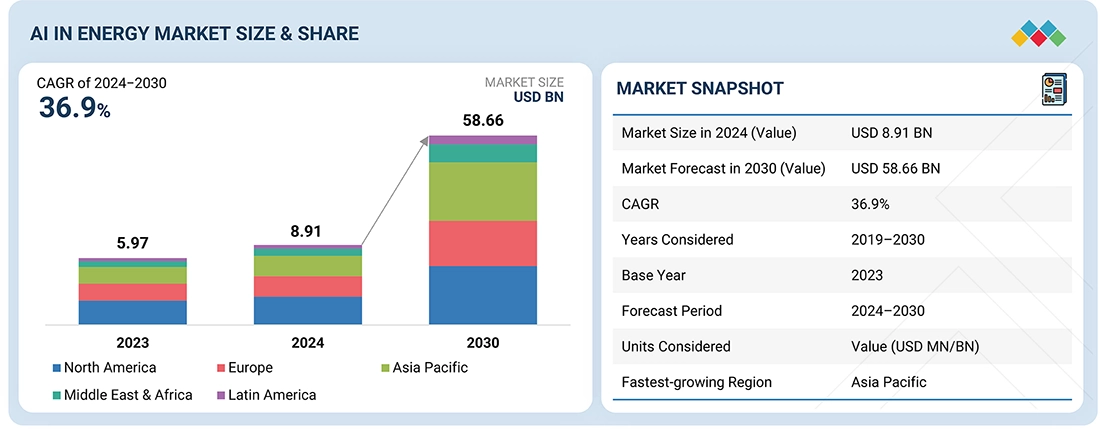
The AI in energy market is estimated to be worth USD 8.91 billion in 2024 and is projected to reach USD 58.66 billion by 2030 at a Compound Annual Growth Rate (CAGR) of 36.9 % during the same period. The complementary rise of distributed energy systems and aggressive load growth presents a new challenge for load forecasters and grid planners. Distributed energy systems have shifted both generation and loads from centralized, utility-coordinated industrial sites to being integrated into residential and commercial areas, with varying levels of visibility from grid planners.
Market Size and Forecast:
- Market Size in 2023: USD 5.97 Billion
- 2024 Market Size: USD 8.91 Billion
- 2030 Forecasted Market Size: USD 58.66 Billion
- Growth Rate (2024-2030): CAGR of 36.9%
- Forecast period: 2024–2030
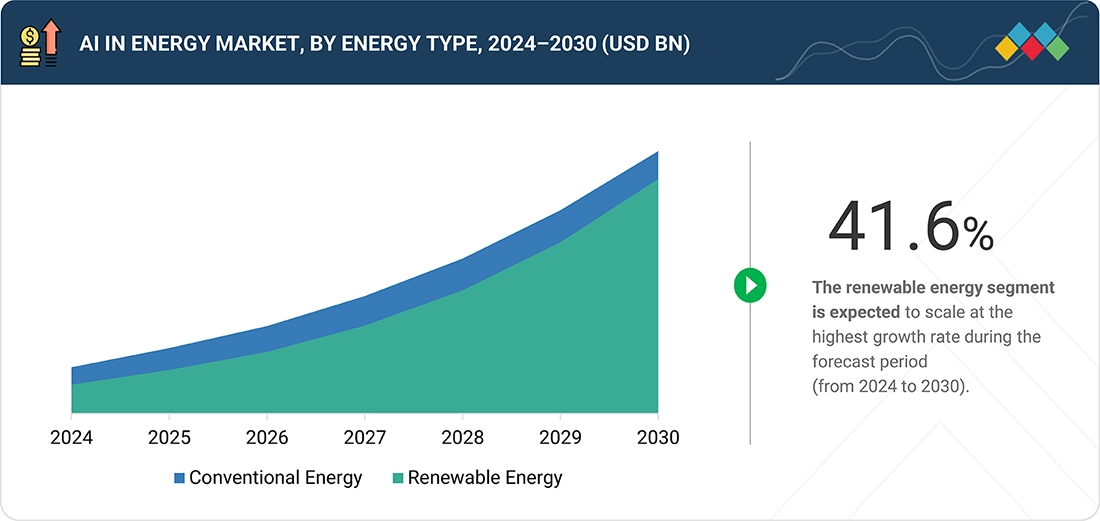
- The renewable energy segment is projected to scale at the highest growth rate of 41.6% during the forecast period.
Key Market Trends and Insights
- By Application Type: AI-driven grid optimization, predictive maintenance, and energy forecasting accelerate energy sector transformation.
-
Key Advantages: AI improves energy efficiency, grid reliability, asset performance, and real-time operational decision-making.
- Growing Trends: Utilities are adopting smart grids, digital twins, renewable forecasting, and AI-powered energy automation.
- Growth Opportunities: Renewable integration, energy storage optimization, and intelligent grid management drive AI adoption growth.
KEY TAKEAWAYS
-
BY OFFERINGThe AI in energy segment comprises advanced solutions and services designed to optimize energy generation, distribution, and consumption. Solutions typically include predictive maintenance systems, grid optimization platforms, energy forecasting tools, and AI-powered renewable energy integration technologies. Services encompass consulting, implementation, and training to enable energy providers to leverage AI effectively, alongside ongoing support to ensure seamless adoption and scalability.
-
BY ENERGY TYPEIn the AI in energy market, segmentation by energy type into conventional energy and renewable energy highlights the distinct roles artificial intelligence plays across traditional and emerging power sources. AI-driven forecasting and resource optimization are critical in mitigating intermittency challenges and ensuring grid stability.
-
BY TYPEGenerative AI and other AI technologies like Machine Learning (ML), Natural Language Processing (NLP), predictive analytics, and computer vision are playing a transformative role in the energy sector. Together, these AI technologies are driving innovation, increasing efficiency, and accelerating the transition to sustainable energy systems across the industry.
-
BY APPLICATIONThe growing use of AI in the energy sector is transforming numerous applications by improving efficiency, sustainability, and resilience. One notable application is energy demand forecasting, which utilizes AI to predict consumption patterns. This capability enables utilities to better plan and optimize their supply.
-
BY END USEThe end-use segment includes energy generation, transmission, distribution, and consumption, each benefiting significantly from advanced technologies. Innovations in these processes collectively enhance efficiency, reliability, and sustainability in the energy sector.
-
BY REGIONAsia Pacific is expected to grow the fastest, with a CAGR of 40.7%, fueled by some of the world's fastest-growing economies, including China, India, and Japan. These areas are known for their young, tech-savvy populations that are driving a demand for digital transformation and growing deployment of AI-powered solutions to optimize energy production, enhance grid stability, and manage renewable energy resources more efficiently.
-
COMPETITIVE LANDSCAPEThe major market players have adopted both organic and inorganic strategies, including partnerships, collaborations, and investments. For instance, in October 2024, POoredoo and Schneider Electric partnered to drive Qatar’s digital and sustainable future. The partnership will focus on integrating innovative solutions such as cloud computing, AI, and green data centers, driving efficiency and sustainability across industries like utilities, healthcare, energy, and infrastructure.
The growth of the AI in energy market is primarily driven by the rising need for energy efficiency and optimization, as utilities and enterprises strive to reduce costs and waste while improving sustainability. The increasing integration of renewable energy sources such as solar and wind has further amplified the demand for AI, enabling accurate forecasting, grid balancing, and intermittency management. At the same time, the rapid digitalization of energy infrastructure through smart meters, IoT sensors, and cloud-based platforms is creating a foundation for AI-powered predictive maintenance, real-time monitoring, and intelligent decision-making.
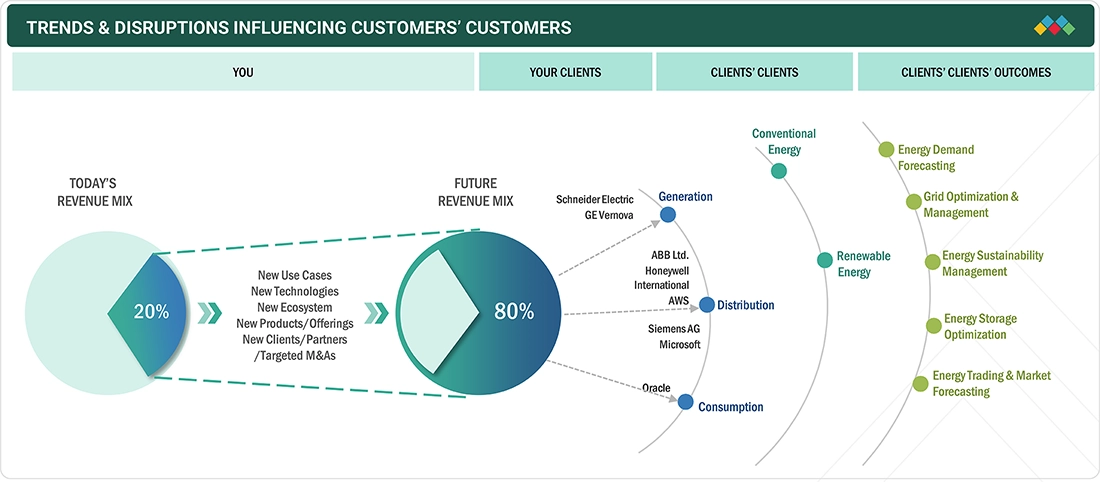
TRENDS & DISRUPTIONS IMPACTING CUSTOMERS' CUSTOMERS
The AI in energy market is projected to grow at a CAGR of 36.9% during the forecast period. The AI in energy market is shaped by trends such as the growing adoption of renewable energy, grid decentralization, and the demand for predictive maintenance and energy efficiency. Disruptive technologies like blockchain, IoT, and edge computing are transforming data management and decision-making in real-time energy applications. Sustainability goals and regulatory shifts push AI solutions to focus on optimizing renewable integration and reducing carbon footprints. Additionally, advancements in AutoML and autonomous AI systems streamline energy operations, while cybersecurity concerns drive innovation in securing AI-powered infrastructure. These dynamics collectively accelerate the evolution of the energy landscape.
Source: Secondary Research, Interviews with Experts, MarketsandMarkets Analysis
MARKET DYNAMICS
Level
-
Energy market volatility and risk management

-
Rising consumer demand for smart energy solutions

Level
-
High implementation costs

-
Data privacy and security

Level
-
Increasing shift toward carbon emission reduction and sustainability

-
Renewable energy integration

Level
-
Insufficient real-time energy data limiting training and deployment of AI models

-
Lack of skilled professionals in AI and energy analytics

Source: Secondary Research, Interviews with Experts, MarketsandMarkets Analysis
Driver: Energy market volatility and risk management
The major factors driving the increased adoption of AI in the energy sector are energy market volatility and risk management. Market fluctuations due to geopolitical instability and harsh weather conditions make it unpredictable and disrupt the disturbed supply-demand balance. AI helps these companies through advanced analytics by designing appropriate forecasting models on market trends and price movements. Using predictive models and machine learning algorithms, an organization can assess risk factors and optimize strategies for energy procurement that hedge against price changes. With AI-driven risk management tools, companies can clearly understand their potential risks and opportunities and minimize losses that could be sustained for relatively stable operations. This is very important in maintaining profitability and sustainability, as the constantly changing energy market defines today's operations. Higher volatility also means that AI will help organizations make better business decisions based on data.
Restraint: High implementation costs
The high implementation cost of AI technologies is a significant hindrance for energy companies, especially those with lower budgets. Developing, deploying, and maintaining AI solutions requires considerable investments in infrastructure, skilled personnel, and technology integration. For many energy companies, especially smaller firms, these costs are too high and thus limit the possibility of adopting AI-driven solutions. Furthermore, integrating AI with existing legacy systems complicates things more and imposes a more significant financial burden on such initiatives, making return on investment difficult to justify. To overcome this restraint, a business might have to rely on government incentives, partnerships, or a phase-by-phase strategy to reduce the cost of implementing it and make it more affordable.
Opportunity: Increasing shift towards carbon emission reduction and sustainability
The rising global demand for carbon emission reduction and sustainability presents a massive opportunity for AI in the energy sector. As government and industrial climate ambitions are pushing towards more stringent post-Paris Climate Change Agreements, there will be a greater demand for innovative methods of monitoring, reducing, and optimizing carbon footprint in energy operations. Using AI enables more accurate predictions regarding energy consumption, which helps businesses and utilities to shift toward greener energy consumption by reducing emissions. Integrate AI in renewable energy sources - wind and solar - to better predict outputs, balance supply and demand, and move away from reliance on fossil fuels. AI-driven systems improve energy efficiency in buildings, transport, and manufacturing, all major contributors to carbon emissions. AI can thus be used to track actual progress, optimize resource usage in real-time, and achieve global environmental standards. The former is integrated with other process automation options like carbon capture and storage, thus helping make them efficient and cost-effective. This burgeoning carbon reduction focus aligns well with consumer expectations and regulatory frameworks. Companies will experience a competitive edge in this scenario in the emerging energy landscape.
Challenge: Insufficient real-time energy data limiting the training and deployment of AI models
Lack of real-time energy data is a significant challenge in training and deploying AI models. With big, precise, and, most importantly, up-to-date datasets, AI systems can work to make highly accurate predictions and then optimize energy management. However, limited access to real-time information about grid operations, consumption patterns, or infrastructure performance may hinder the development of effective AI models. This can hamper predictive analytics, energy demand forecasting, and optimization in systems. Hence, it tends to hinder AI solutions from yielding maximum service efficiency. Better data collection technologies, integration across different energy networks, and real-time data sharing shall enable such AI models to be trained over timely and relevant information.
Artificial Intelligence in Energy Market: COMMERCIAL USE CASES ACROSS INDUSTRIES
| COMPANY | USE CASE DESCRIPTION | BENEFITS |
|---|---|---|
 |
Blackstone’s vast portfolio includes companies across multiple regions and industries, each with distinct energy requirements and sustainability goals. With a complex and sizable energy spend, Blackstone faced the challenge of collecting actionable energy and sustainability data that could support its aggressive cost-savings initiatives. Additionally, the firm needed a unified approach to manage data consistently across regions, allowing for strategic insights and improved negotiation capabilities with suppliers. | The strategic collaboration with Schneider Electric has delivered significant results, with active energy management programs contributing to tens of millions in energy savings across Blackstone’s portfolio. The use of Resource Advisor data has also enabled Blackstone to foster long-term relationships with companies even after divestment, continuing to drive cost reductions. The platform’s historical data allows Anderson and his team to showcase proven savings, strengthening their ability to make the business case for sustainability initiatives in new ventures. |
 |
A petrochemical company faced significant obstacles in achieving its energy and sustainability objectives. The existing sustainability program required manual calculations to establish emissions and energy baselines, resulting in time-consuming and labor-intensive processes that often lacked frequency and accuracy. These manual inputs hindered real-time visibility, making it difficult for the sustainability team to identify improvement opportunities quickly. Additionally, equipment-level energy and emissions data, critical for driving actionable insights, had to be manually transformed into emissions metrics, limiting the ability of the team to implement real-time improvements. | The implementation of C3 AI Energy Management delivered substantial benefits, allowing the company to realize energy cost savings of up to USD 3.2 million annually across its two ethylene facilities and achieve a 4% reduction in energy consumption per facility. With continuous, automated visibility into emissions and energy usage, the company reduced 80,000 metric tons of GHG emissions each year, aligning with its sustainability objectives. The AI-enabled insights facilitated a unified source of truth for sustainability performance across the organization, helping the company maintain compliance, accelerate goal attainment, and foster synergy between sustainability and operational teams. This AI-driven approach streamlined reporting and established the company as a forward-thinking leader in energy-efficient and environmentally responsible petrochemical production. |
 |
The residents of West Atlanta face several obstacles in achieving energy equity and sustainability. Aging homes with inefficient wiring, poor insulation, and outdated appliances contribute to high energy costs and decreased resilience during power outages. The centralized grid structure exacerbates this vulnerability, with slower recovery times during outages and higher energy bills. To support modernization, the project needed to address structural upgrades for homes and the technical demands of integrating renewable energy sources into a microgrid system. | The West Atlanta AI-powered microgrid project has delivered tangible benefits, including enhanced energy resilience, job creation, and potential cost savings for the community. The microgrid improves energy security and aligns with the community’s sustainability goals by optimizing power usage and reducing reliance on the centralized grid. The AI-driven insights have been instrumental in identifying inefficiencies and improving household energy management, empowering residents to reduce costs while maintaining access to clean energy. Additionally, the ongoing installation of solar panels across VCC and WAWA underscores a commitment to long-term environmental and economic benefits, demonstrating the role of AI-supported microgrids in building equitable, community-centered energy solutions. |
Logos and trademarks shown above are the property of their respective owners. Their use here is for informational and illustrative purposes only.
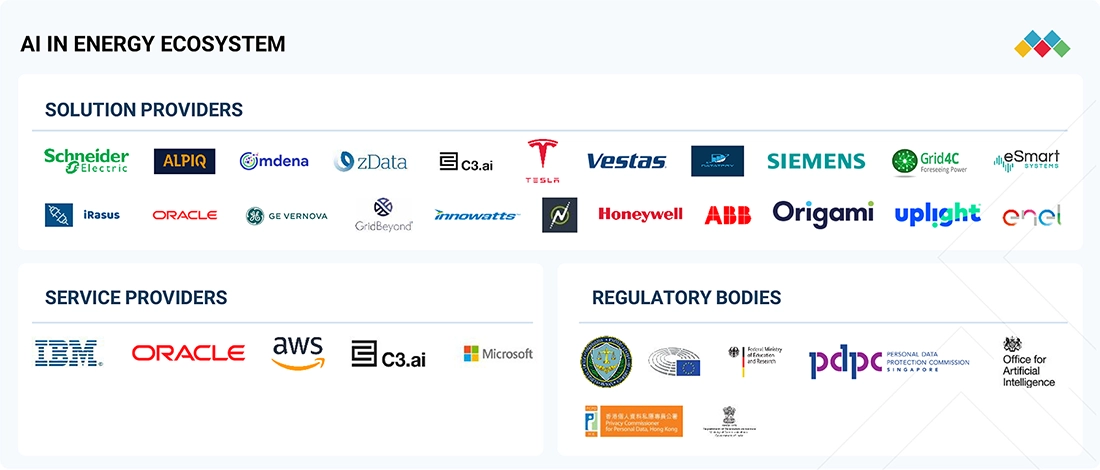
MARKET ECOSYSTEM
The prominent players in the AI in energy market include Schneider Electric SE (France), GE Vernova (US), and Siemens AG (Germany). These companies have been operating in the market for several years and possess a diversified product portfolio, state-of-the-art technologies, and a well-established geographic footprint. These companies are rigorously working towards the research & development of AI in energy infrastructure.
Logos and trademarks shown above are the property of their respective owners. Their use here is for informational and illustrative purposes only.
MARKET SEGMENTS
Source: Secondary Research, Interviews with Experts, MarketsandMarkets Analysis
BY OFFERING
The AI in energy segment comprises advanced solutions and services designed to optimize energy generation, distribution, and consumption. Solutions typically include predictive maintenance systems, grid optimization platforms, energy forecasting tools, and AI-powered renewable energy integration technologies. These aim to enhance operational efficiency, reduce costs, and support sustainability goals. Services encompass consulting, implementation, and training to enable energy providers to leverage AI effectively, alongside ongoing support to ensure seamless adoption and scalability. Together, these offerings empower energy stakeholders to achieve smarter, data-driven decision-making in increasingly complex and dynamic energy ecosystems.
BY ENERGY TYPE
In the AI in energy market, segmentation by energy type into conventional energy and renewable energy highlights the distinct roles artificial intelligence plays across traditional and emerging power sources. In the conventional energy segment, which includes oil, gas, and coal-based power generation, AI is primarily used to optimize exploration, production, and refining operations, enhance predictive maintenance, improve asset performance, and reduce operational costs. It also aids in demand forecasting, emissions monitoring, and process automation to improve efficiency and sustainability. The renewable energy segment leverages AI for grid optimization, energy storage management, predictive analytics for solar and wind output, and intelligent energy trading. AI-driven forecasting and resource optimization are critical in mitigating intermittency challenges and ensuring grid stability.
BY TYPE
Generative AI and other AI technologies like Machine Learning (ML), Natural Language Processing (NLP), Predictive Analytics, and Computer Vision are playing a transformative role in the energy sector. Generative AI is applied to design and optimize energy systems, enabling more efficient resource management and reducing operational costs. ML and predictive analytics are critical in forecasting energy demand, improving grid management, and enhancing the performance of renewable energy sources. NLP is increasingly used to interpret and manage large volumes of data from energy systems, while computer vision aids in infrastructure monitoring and maintenance. Together, these AI technologies drive innovation, increase efficiency, and accelerate the transition to sustainable energy systems across the industry.
BY APPLICATION
The increasing use of AI in the energy sector is transforming various applications by enhancing efficiency, sustainability, and resilience. Energy demand forecasting uses AI to predict consumption patterns, helping utilities plan and optimize supply. Grid optimization and management leverage AI for real-time monitoring and adjustments, improving grid stability and reducing downtime. AI-driven energy storage optimization ensures efficient use of storage systems, balancing supply and demand. In renewables integration, AI helps manage intermittent energy sources like solar and wind, ensuring smooth integration with existing grids. Energy trading and market forecasting benefit from AI's ability to predict price fluctuations and optimize trading strategies. Energy sustainability management utilizes AI to monitor consumption, reduce waste, and support environmental goals. Finally, AI enhances disaster resilience and recovery by predicting potential disruptions, optimizing response efforts, and ensuring quick restoration of services. Together, these applications drive a more efficient, reliable, and sustainable energy ecosystem.
BY END USE
The end-use segment includes energy generation, energy transmission, energy distribution, and energy consumption, each benefiting significantly from advanced technologies. AI optimizes resource forecasting in energy generation, enhances renewable integration, and supports predictive maintenance to ensure reliable energy production. Transmission leverages AI for real-time grid monitoring, automated fault detection, and efficient energy flow management to reduce losses. Distribution uses AI for dynamic load balancing, demand-side management, and proactive outage prevention, ensuring seamless energy delivery to end consumers. In energy consumption, AI enables smarter energy usage through real-time monitoring, predictive analytics, and personalized energy-saving recommendations. These innovations collectively enhance efficiency, reliability, and sustainability in the energy sector.
REGION
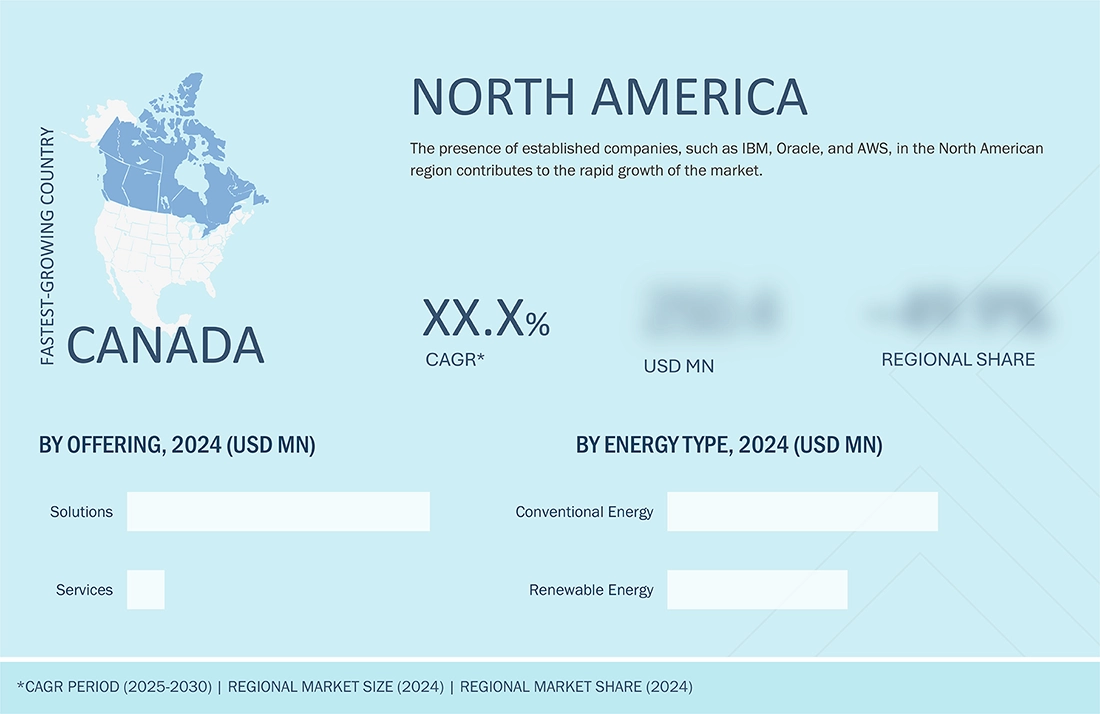
North America is estimated to account for the largest market share during the forecast period
In April 2024, the U.S. Department of Energy (DOE) launched the VoltAIc Initiative with $13 million to develop PolicyAI, an AI tool for streamlining permitting under the National Environmental Policy Act. Concurrently, in October 2022, UN-Habitat and Mila in Canada explored AI applications for sustainable urbanization in energy, mobility, public safety, and healthcare. Additionally, Canada is advancing AI-driven materials discovery through various Platforms aimed at reducing research timelines and costs. These initiatives highlight the increasing use of AI in the U.S. and Canada to enhance innovation and efficiency in the energy sector, promoting a more sustainable and technologically advanced landscape.
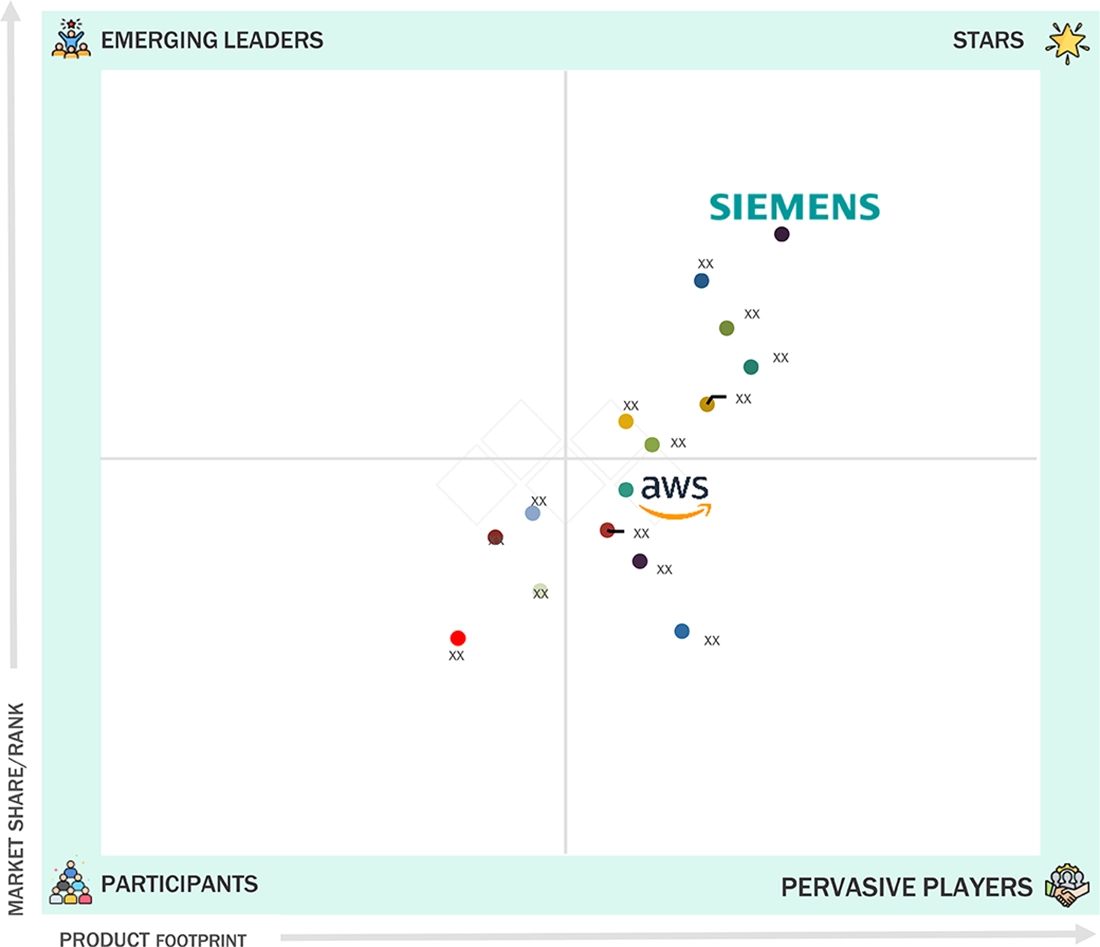
Artificial Intelligence in Energy Market: COMPANY EVALUATION MATRIX
In the AI in energy market matrix, Siemens AG (Star) secures its position with a strong market share by leveraging its deep expertise in grid automation, predictive maintenance, and renewable integration solutions. The company continues to invest in AI-driven platforms that optimize energy efficiency, enhance grid resilience, and support the global transition toward decarbonization. Amazon Web Services (AWS) (Pervasive Player) maintains a broad presence by offering scalable AI and cloud-based analytics solutions across the energy value chain, enabling utilities, oil & gas firms, and renewable operators to deploy machine learning for forecasting, asset monitoring, and intelligent decision-making at scale.
Source: Secondary Research, Interviews with Experts, MarketsandMarkets Analysis
KEY MARKET PLAYERS
MARKET SCOPE
| REPORT METRIC | DETAILS |
|---|---|
| Market Size in 2024 (Value) | USD 8.91 Billion |
| Market Forecast in 2030 (value) | USD 58.66 Billion |
| Growth Rate | CAGR of 36.9% from 2024 to 2030 |
| Years Considered | 2019–2030 |
| Base Year | 2023 |
| Forecast Period | 2024–2030 |
| Units Considered | Value (USD Million/Billion) |
| Report Coverage | Revenue forecast, company ranking, competitive landscape, growth factors, and trends |
| Segments Covered | By offering, energy type, type, application, end use, and region |
| Regions Covered | North America, Europe, Asia Pacific, Middle East & Africa, and Latin America |
WHAT IS IN IT FOR YOU: Artificial Intelligence in Energy Market REPORT CONTENT GUIDE
DELIVERED CUSTOMIZATIONS
We have successfully delivered the following deep-dive customizations:
| CLIENT REQUEST | CUSTOMIZATION DELIVERED | VALUE ADDS |
|---|---|---|
| Leading Service Provider (US) |
|
|
| Company Information | Detailed analysis and profiling of additional market players (up to 5) |
|
RECENT DEVELOPMENTS
- January 2025 : ABB partnered with Edgecom to transform AI-powered energy management. The partnership includes a minority investment by ABB Electrification Ventures, the venture capital arm of ABB Electrification. It will enable industrial and commercial users to manage energy by leveraging Edgecom’s AI-driven platform, which optimizes power demand and reduces peaks.
- November 2024 : Microsoft and Abu Dhabi National Oil Company collaborated to drive AI and low-carbon innovations, aiming to decarbonize the global energy system and foster a sustainable future.
- October 2024 : Ooredoo and Schneider Electric partnered to drive Qatar’s digital and sustainable future. The partnership will focus on integrating cutting-edge solutions such as cloud computing, AI and green data centers, driving efficiency and sustainability across industries such as utilities, healthcare, energy, and infrastructure.
- August 2024 : Honeywell collaborated with Cisco to develop an AI-powered solution that automatically adapts building systems based on fluctuating usage levels, reducing energy consumption and optimizing the environment for worker productivity and comfort.
- April 2024 : ABB partnered with Carbon Re to cooperate on optimizing and decarbonizing cement production with the help of AI.
Table of Contents
 Exclusive indicates content/data unique to MarketsandMarkets and not available with any competitors.
Methodology
This research study involved the extensive use of secondary sources, directories, and databases, such as Dun & Bradstreet (D&B) Hoovers and Bloomberg BusinessWeek, to identify and collect information useful for a technical, market-oriented, and commercial study of the AI in energy market. The primary sources have been mainly industry experts from the core and related industries and preferred suppliers, manufacturers, distributors, service providers, technology developers, alliances, and organizations related to all segments of the value chain of this market. In-depth interviews have been conducted with various primary respondents, including key industry participants, subject matter experts, C-level executives of key market players, and industry consultants, to obtain and verify critical qualitative and quantitative information.
Secondary Research
The market size of companies across the globe offering WCM products was arrived at based on the secondary data available through paid and unpaid sources. It was also arrived at by analyzing the product portfolios of major companies and rating companies based on their performance and quality.
The market for companies offering AI in energy solutions and services to different end users has been estimated and projected based on the secondary data made available through paid and unpaid sources, and by analyzing their product portfolios in the ecosystem of the AI in energy market. In the secondary research process, various sources such as IEEE Xplore, International Journal of Science and Research Archive (IJSRA), and Frontiers have been referred to for identifying and collecting information for this study on the AI in energy market. Secondary sources included annual reports, press releases, investor presentations of companies, white papers, journals, certified publications, and articles by recognized authors, directories, and databases. Secondary research has been mainly used to obtain essential information about the supply chain of the market, the total pool of key players, market classification, segmentation according to industry trends to the bottommost level, regional markets, and key developments from both market- and technology-oriented perspectives that primary sources have further validated.
Primary Research
In the primary research process, various primary sources from both the supply and demand sides were interviewed to obtain qualitative and quantitative information on the market. The primary sources from the supply side included various industry experts, including Chief Experience Officers (CXOs); Vice Presidents (VPs); directors from business development, marketing, and product development/innovation teams; related critical executives from AI in energy service vendors, system integrators, professional service providers, and industry associations; and key opinion leaders. Primary interviews were conducted to gather insights, such as market statistics, revenue data collected from services, market breakups, market size estimations, market forecasts, and data triangulation. Primary research also helped in understanding various trends related to technologies, applications, deployments, and regions. Stakeholders from the demand side, such as Chief Information Officers (CIOs), Chief Technology Officers (CTOs), Chief Strategy Officers (CSOs), and end users using AI in energy services, were interviewed to understand the buyer’s perspective on suppliers, products, service providers, and their current usage of AI in energy services which would impact the overall AI in energy market.

Note: Others include sales managers, marketing managers, and product managers.
To know about the assumptions considered for the study, download the pdf brochure
Market Size Estimation
Multiple approaches were adopted to estimate and forecast the size of the AI in energy market. The first approach involves estimating market size by summing up the revenue companies generate by selling AI in energy solutions and services.
Both top-down and bottom-up approaches were used to estimate and validate the total size of the AI in energy market. These methods were extensively used to estimate the size of various segments in the market. The research methodology used to estimate the market size includes the following:
- Key players in the market have been identified through extensive secondary research.
- In terms of value, the industry’s supply chain and market size have been determined through primary and secondary research processes.
- All percentage shares, splits, and breakups have been determined using secondary sources and verified through primary sources.
- After arriving at the overall market size, the AI in energy market was divided into several segments and subsegments.
Artificial Intelligence in Energy Market : Top-Down and Bottom-Up Approach

Data Triangulation
After arriving at the overall market size, the AI in energy market was divided into several segments and subsegments.
The data was triangulated by studying various factors and trends from the demand and supply sides. Along with data triangulation and market breakdown, the market size was validated by the top-down and bottom-up approaches.
Market Definition
The AI in energy market encompasses the application of artificial intelligence technologies to optimize various aspects of the energy sector, including generation, transmission, distribution, and consumption. It leverages advanced tools like machine learning, predictive analytics, computer vision, and natural language processing to enhance efficiency, reduce costs, and support sustainability goals. By integrating AI, the energy industry can address challenges like energy demand forecasting, grid stability, renewable energy management, and risk mitigation. This market drives innovation in smart energy solutions, enabling the transition to cleaner and more decentralized energy systems while improving operational reliability and environmental impact.
Stakeholders
- Energy Companies
- Technology Providers
- Governments and Regulatory Bodies
- Energy Consumers (Industrial, Commercial, Residential)
- Research and Academic Institutions
- AI and Data Analytics Firms
- Utilities and Grid Operators
- Energy Storage Solution Providers
- Renewable Energy Developers
Report Objectives
- To determine, segment, and forecast the AI in energy market based on end user, offering, type, and region in terms of value
- To forecast the segment’s size with respect to five main regions: North America, Europe, Asia Pacific (Asia Pacific), Latin America, and the Middle East & Africa
- To provide detailed information about the major factors (drivers, restraints, opportunities, and challenges) influencing the market
- To study the complete value chain and related industry segments, and perform a value chain analysis
- To strategically analyze macro and micro-markets with respect to individual growth trends, prospects, and contributions to the market
- To analyze industry trends, regulatory landscape, and patents & innovations
- To analyze opportunities for stakeholders by identifying the high-growth segments
- To track and analyze competitive developments, such as agreements, partnerships, collaborations, and R&D activities
Available Customizations
With the given market data, MarketsandMarkets offers customizations as per the company’s specific needs. The following customization options are available for the report:
Country-wise information
- Analysis for additional countries (up to five)
Company Information
- Detailed analysis and profiling of additional market players (up to 5)
Key Questions Addressed by the Report
Need a Tailored Report?
Customize this report to your needs
Get 10% FREE Customization
Customize This ReportPersonalize This Research
- Triangulate with your Own Data
- Get Data as per your Format and Definition
- Gain a Deeper Dive on a Specific Application, Geography, Customer or Competitor
- Any level of Personalization
Let Us Help You
- What are the Known and Unknown Adjacencies Impacting the Artificial Intelligence in Energy Market
- What will your New Revenue Sources be?
- Who will be your Top Customer; what will make them switch?
- Defend your Market Share or Win Competitors
- Get a Scorecard for Target Partners

Custom Market Research Services
We Will Customise The Research For You, In Case The Report Listed Above Does Not Meet With Your Requirements
Get 10% Free CustomisationTESTIMONIALS


Growth opportunities and latent adjacency in Artificial Intelligence in Energy Market