The study involves four major activities that estimate the size of the compressed air filter and dryer market. Exhaustive secondary research was conducted to collect information related to the market. Following this was validating these findings, assumptions, and sizing with the industry experts across the value chain through primary research. Both top-down and bottom-up approaches were employed to estimate the overall size of the compressed air filter and dryer market. Subsequently, market breakdown and data triangulation procedures were used to determine the extent of different segments and subsegments of the market.
Secondary Research:
Secondary sources in this research study include corporate filings (such as annual reports, investor presentations, and financial statements); trade, business, and professional associations; white papers, certified publications, articles from recognized authors; directories; and databases. The secondary data were collected and analyzed to estimate the overall market size, further validated by primary research. The relevant data is collected from various secondary sources, it is analyzed to extract insights and information relevant to the market research objectives. This analysis has involved summarizing the data, identifying trends, and drawing conclusions based on the available information.
Primary Research
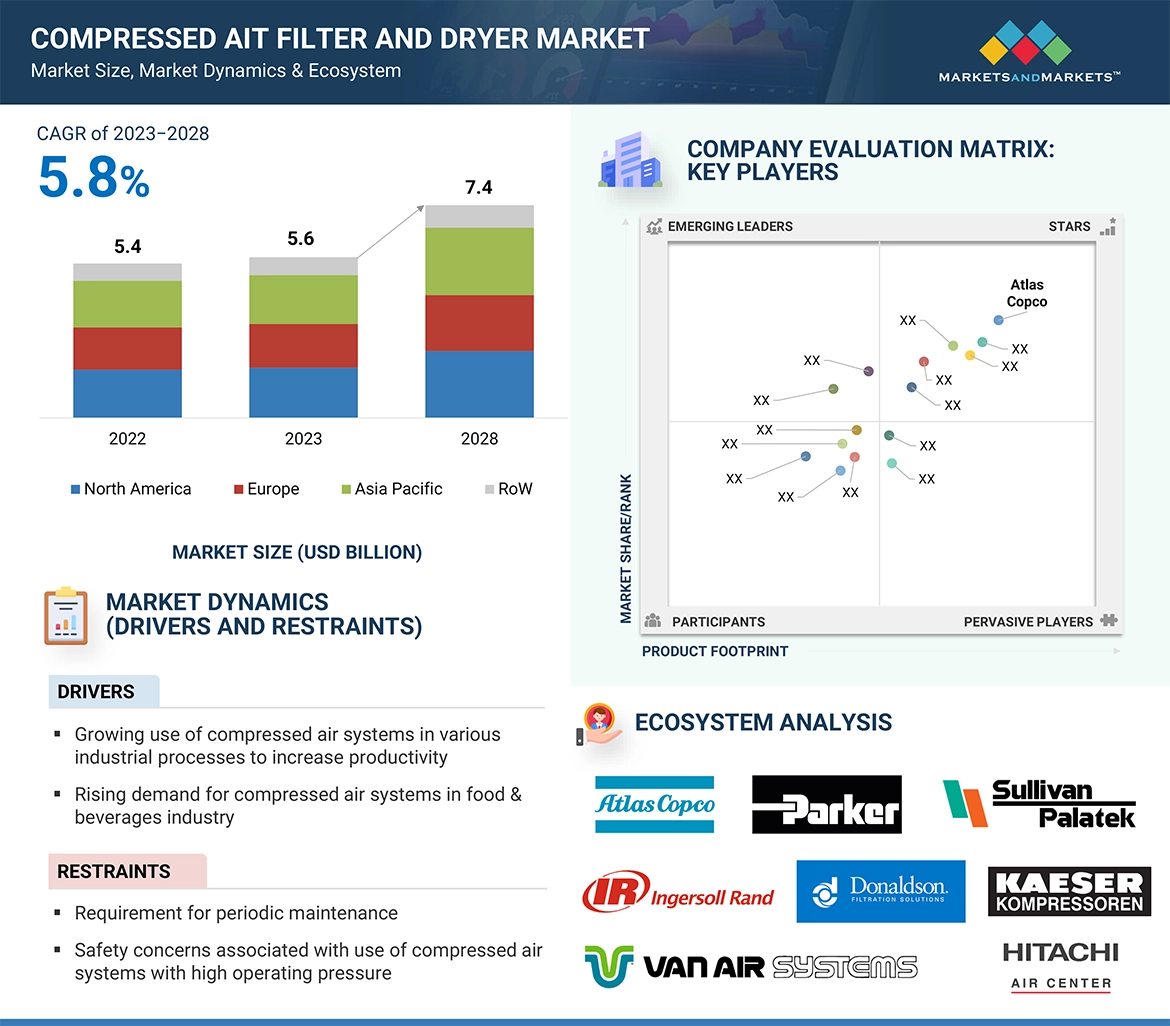
In the primary research process, numerous sources from both supply and demand sides were interviewed to obtain qualitative and quantitative information about this report. The primary sources from the supply-side included various industry experts such as Chief X Officers (CXOs), Vice Presidents (VPs), and Directors from business development, marketing, product development/innovation teams, and related key executives from compressed air filter and dryer providers, (such as Atlas Copco, Ingersoll Rand, PARKER HANNIFIN CORP, Pentair, Donaldson Company, Inc., BOGE, Hitachi Global Air Power US, LLC.) research organizations, distributors, professional and managed service providers, industry associations, and key opinion leaders. Approximately 25% of the primary interviews were conducted with the demand side and 75% with the supply side. These data were collected mainly through questionnaires, emails, and telephonic interviews, accounting for 80% of the primary interviews.

To know about the assumptions considered for the study, download the pdf brochure
Market Size Estimation
In the market engineering process, both top-down and bottom-up approaches were implemented, along with several data triangulation methods, to estimate and validate the size of the compressed air filter and dryer market and other dependent submarkets listed in this report.
-
The key players in the industry and markets were identified through extensive secondary research.
-
Both the supply chain of the industry and the market size, in terms of value, were determined through primary and secondary research.
-
All percentage shares, splits, and breakdowns were determined using secondary sources and verified through primary sources.
Market Size Estimation Methodology-Bottom-up Approach

Co-packaged optics market: Top-down Approach

Data Triangulation
After estimating the overall market size, the total market was split into several segments. The market breakdown and data triangulation procedures were employed wherever applicable to complete the overall market engineering process and gauge exact statistics for all segments. The data were triangulated by studying various factors and trends from both the demand and supply sides. The market was also validated using both top-down and bottom-up approaches.
Market Definition
Compressed air filters filter suspended particulate impurities, water solvents, and oil-soluble impurities from a compressed air stream, while compressed air dryers maintain the dryness of compressed air at different temperatures throughout a compressed air system by separating water vapor or moisture from industrial processed air. A compressed air system needs filters and dryers to produce ultra-pure and dry compressed air for use in industries such as automotive, oil & gas, metals & machinery, pharmaceuticals, electronics, and chemicals for different applications.
The compressed air filter and dryer ecosystem includes various manufacturers and providers. The market is diversified, with more than 25 companies competing across the value chain to sustain their position in the market and increase their market share.
Stakeholders
-
Government bodies and policymakers
-
Industry organizations, forums, alliances, and associations
-
Market research and consulting firms
-
Raw material suppliers and distributors
-
Research institutes and organizations
-
Manufacturers and distributors of compressed air filters and dryers
-
Traders and suppliers
-
Energy and power companies
-
Automobile companies
-
Food and beverage companies
-
Packaging companies
-
Pharmaceutical companies
-
Manufacturing consulting companies
-
Investors and venture capitalists
-
Manufacturers implementing AI technology
-
Government bodies, venture capitalists, and private equity firms
The main objectives of this study are as follows:
-
To define, describe, and forecast the compressed air filter and dryer market on the basis of product, industry, and geography
-
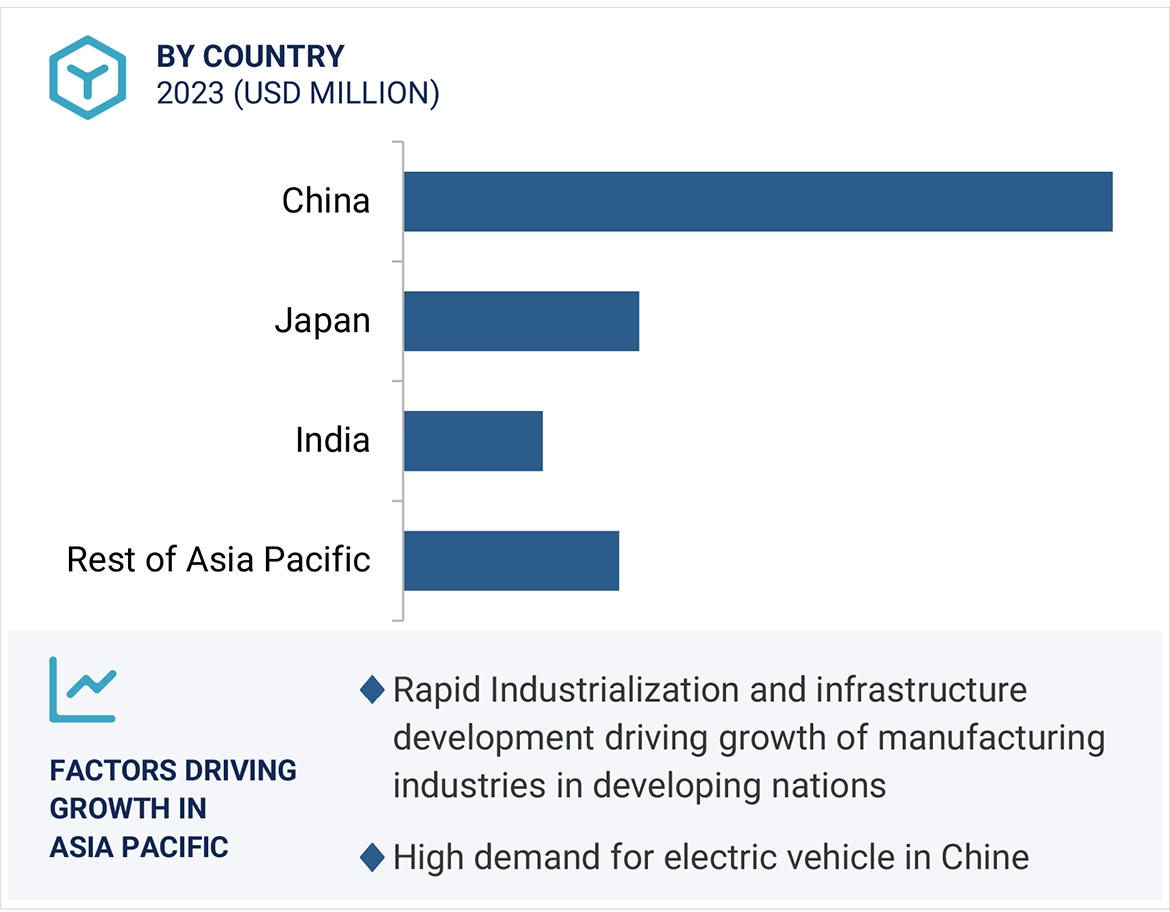
To describe and forecast the size of the market in four regions: North America, Europe, Asia Pacific, and the Rest of the World
-
To provide detailed information regarding the factors (drivers, restraints, opportunities, and challenges) influencing the market’s growth
-
To provide an overview of the recent trends in the market
-
To strategically analyze micromarkets1 with respect to individual growth trends, prospects, and contributions to the overall market size
-
To study the complete value chain of the market
-
To analyze the probable impact of the recession on the market in the near future
-
To analyze the opportunities for stakeholders by identifying the high-growth segments of the market
-
To strategically profile the key players and comprehensively analyze their market positions in terms of their ranking and core competencies2
-
To analyze the competitive developments such as joint ventures, collaborations, agreements, contracts, partnerships, mergers and acquisitions, product launches, and research and development (R&D) in the compressed air filter and dryer market
-
To provide an analysis of the recession impact on the growth of the market and its segments
Available Customizations:
With the given market data, MarketsandMarkets offer customizations according to the specific requirements of companies. The following customization options are available for the report:
Country-wise Information:
-
Analysis for additional countries (up to five)
Company Information:
-
Detailed analysis and profiling of different market players (up to five)


Growth opportunities and latent adjacency in Compressed Air Filter and Dryer Market