The research study involved extensive secondary sources, directories, and databases such as Bloomberg Businessweek and Factiva to identify and collect information useful for a technical, market-oriented, and commercial study of the alginates and derivatives market. In-depth interviews were conducted with various primary respondents—such as key industry participants, subject matter experts (SMEs), C-level executives of key market players, and industry consultants—to obtain and verify critical qualitative and quantitative information and assess prospects.
Secondary Research
In the secondary research process, sources such as annual reports, press releases, and investor presentations of companies, white papers, certified publications, articles from recognized authors, gold standard and silver standard websites, food safety organizations, regulatory bodies, trade directories, government websites, and databases were used to identify and collect information.
Secondary research was used to obtain key information about the industry’s supply chain, the market’s monetary chain, the total pool of key players, market classification, and segmentation according to industry trends to the bottom-most level, geographic markets, and key developments from market- and technology-oriented perspectives.
Primary Research
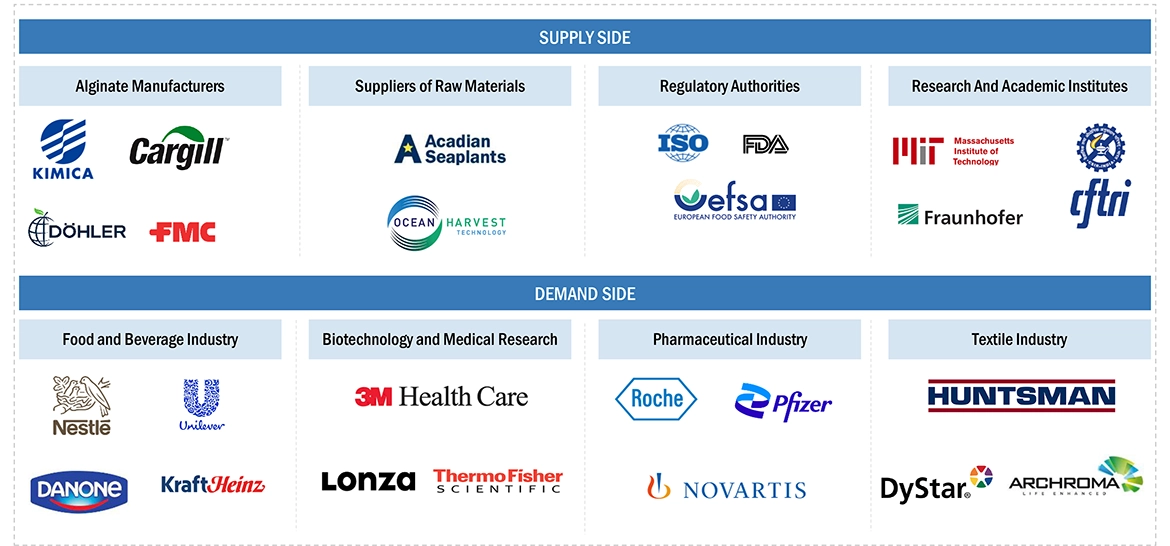
The market includes several stakeholders in the supply chain, such as suppliers, processors, and end-product manufacturers. The demand side of the market is characterized by the presence of key food, pharmaceutical, textile, animal feed/pet food, and cosmetics manufacturers. The supply side is characterized by the presence of farmers and key technology providers for the extraction of alginates. Various primary sources from the supply and demand sides of both markets were interviewed to obtain qualitative and quantitative information.
The primary interviewees from the demand side include key opinion leaders, executives, vice presidents, and CEOs from the F&B, pharmaceutical, animal feed/pet food, and chemical industries. The primary sources from the supply side include research institutions involved in R&D to introduce technology, key opinion leaders, distributors, and alginate manufacturers.
-
Breakdown of Primary Participants

To know about the assumptions considered for the study, download the pdf brochure
Market Size Estimation
Both top-down and bottom-up approaches were used to estimate and validate the total size of the alginates & derivatives market. These approaches were also used extensively to estimate the size of various sub-segments in the market. The research methodology used to estimate the market size includes the following details:
-
The key players in the industry and markets were identified through extensive secondary research
-
The alginates & derivatives industry’s value chain and market size, in terms of value and volume, were determined through primary and secondary research
-
All percentage shares, splits, and breakdowns were determined using secondary sources and verified through primary sources
-
All the possible parameters that affect the market covered in this research study have been accounted for, viewed in extensive detail, verified through primary research, and analyzed to obtain the final quantitative and qualitative data
-
Secondary research included the study of reports, reviews, and newsletters of top market players, along with extensive interviews for key opinions from leaders, such as CEOs, directors, and marketing executives.
Market Size Estimation: Bottom-up Approach

To know about the assumptions considered for the study, Request for Free Sample Report
Market Size Estimation Methodology: Top-Down Approach

Data Triangulation
After arriving at the overall market size—using the market size estimation processes as explained above—the market was split into several segments and sub-segments. In order to complete the overall market engineering process and arrive at the exact statistics of each market segment and sub-segment, data triangulation and market breakdown procedures were employed, wherever applicable. The data was triangulated by studying various factors and trends from the demand and supply sides, in the food, pharmaceutical, and non-food industries. The market size was validated using the top-down and bottom-up approaches.
Market Definition
Alginates can be defined as natural hydrocolloids with unique functionalities that are derived from various species of brown seaweeds (phaecohyceae). Alginates provide properties such as gelling, viscosifying, suspending, and stabilizing in processed food & beverage products.
Alginates are primarily the alkali or alkaline earth salts of alginic acid extracted usually from seaweeds. Alginates are present in the cell walls of brown algae as the calcium, magnesium, and sodium salts of alginic acid. They are frequently sold as blends that increase the volume of a product in the food & beverage and pharmaceutical industries.
Key Stakeholders
-
Raw material suppliers
-
Regulatory bodies
-
Food safety agencies such as the FDA, EFSA, USDA, and FSANZ
-
Government agencies and NGOs
-
Food safety agencies
-
End-users
-
Food & beverage manufacturers/suppliers
-
Pharmaceutical manufacturers/suppliers
-
Animal feed/pet food manufacturers/suppliers
-
Companies (manufacturers/suppliers) involved in industrial segments such as textile, printing, and cosmetics
-
Retailers
-
Commercial research and development (R&D) institutions and financial institutions
-
Importers and exporters of alginates & derivatives
-
Traders, distributors, and suppliers
-
Government and research organizations
-
Trade associations and industry bodies
Report Objectives
Market Intelligence
-
Determining and projecting the size of the alginates and derivatives market with respect to type, application, form, and region, over a five-year period ranging from 2023 to 2028.
-
Identifying the attractive opportunities in the market by determining the largest and fastest-growing segments across regions
-
Providing detailed information about the key factors influencing the growth of the market (drivers, restraints, opportunities, and industry-specific challenges)
-
Analyzing the micro-markets with respect to individual growth trends, prospects, and their contribution to the total market
Competitive Intelligence
-
Identifying and profiling the key market players in the alginates and derivatives market.
-
Providing a comparative analysis of the market leaders on the basis of the following:
-
Product offerings
-
Business strategies
-
Strengths and weaknesses
-
Key financials
-
Understanding the competitive landscape and identifying the major growth strategies adopted by players across the key regions.
-
Providing insights on key product innovations and investments in the alginates and derivatives market.
Available Customizations:
With the given market data, MarketsandMarkets offers customizations according to company-specific scientific needs.
The following customization options are available for the report:
Product Analysis
-
Product Matrix, which gives a detailed comparison of the product portfolio of each company.
Geographic Analysis
With the given market data, MarketsandMarkets offers customizations according to company-specific scientific needs.
-
Further breakdown of the Rest of European alginates and derivatives market, by key country
-
Further breakdown of the Rest of the South American alginates and derivatives market, by key country
-
Further breakdown of the Rest of Asia Pacific alginates and derivatives market, by key country
Company Information
-
Detailed analyses and profiling of additional market players


Growth opportunities and latent adjacency in Alginates and Derivatives Market