Aluminum Fluoride (AlF3) Market by Product Type (Anhydrous, Dry, Wet), Bulk Density (Low, High), Form (Powder, Granules), Grade (Smelter, Catalyst, Technical, High-purity), Application (Electrolyte Additive, Flux Agent, Catalyst/Catalyst Support, Optical Coating Material), End-use Industry (Aluminum, Electronics & Optics, Ceramics & Glass, Automotive) - Global Forecast to 2030

icon1
USD 3.12 BN
MARKET SIZE, 2030
icon2
CAGR 5.9%
(2025-2030)
icon3
240
REPORT PAGES
icon4
150
MARKET TABLES

ALUMINUM FLUORIDE MARKET OVERVIEW

Source: Secondary Research, Interviews with Experts, MarketsandMarkets Analysis

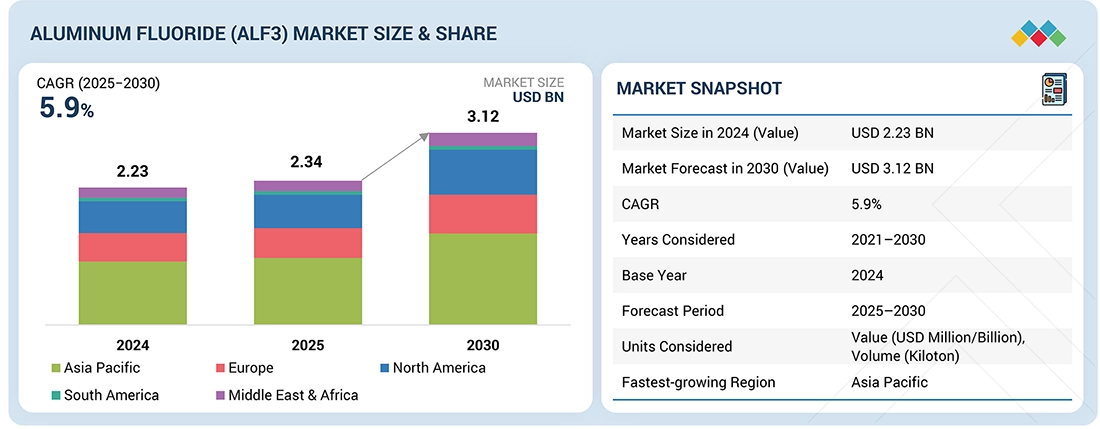
The aluminum fluoride (AlF3) market was valued at USD 2.34 billion in 2025 and is projected to reach USD 3.12 billion by 2030, growing at 5.9% cagr from 2025 to 2030. Aluminum fluoride is an inorganic compound primarily used as a flux in aluminum smelting and as a component in specialty chemicals and ceramics. Its market growth is driven by increasing aluminum production, rising demand from the automotive, aerospace, and construction industries, and expanding applications in chemicals and ceramics. Additionally, supportive government policies in key aluminum-producing countries that improve smelting efficiency and reduce energy consumption are boosting aluminum fluoride production and revenues.

KEY TAKEAWAYS

  • BY PRODUCT TYPE
    The aluminum fluoride market comprises anhydrous, dry, and wet forms. Anhydrous aluminum fluoride holds the largest share and is primarily used in aluminum smelting for fluxing, while dry and wet forms are applied in specialty chemical and industrial processes.
  • BY BULK DENSITY
    High-bulk-density aluminum fluoride dominates the market due to its superior flowability and efficiency in smelting operations, whereas low-bulk-density variants find limited applications in niche chemical processes.
  • BY FORM
    Powdered aluminum fluoride represents the largest segment, favored for its ease of handling, precise dosing, and rapid dissolution in electrolytes during smelting. Granules and pellets are used in applications where controlled release or handling characteristics are required, such as in specialized chemical reactions or industrial processes. The form of aluminum fluoride directly affects operational efficiency, storage, and transportation logistics.
  • BY GRADE
    Smelter-grade aluminum fluoride accounts for the largest market share, driven by the global demand for aluminum production and the critical role of aluminum fluoride in enhancing smelting efficiency. Catalyst-grade aluminum fluoride is utilized in chemical processes to promote reactions, while technical and laboratory grades are employed in research, development, and small-scale industrial applications. High-purity grades are required in electronics, optical coatings, and specialized chemical industries, where extremely low impurities are critical for performance.
  • BY APPLICATION
    Electrolyte additives are the largest application segment, as aluminum fluoride is essential in the electrolytic smelting of aluminum, reducing energy consumption and increasing process efficiency. Other significant applications include its use as a flux agent in ceramics and glass, as a catalyst or catalyst support in chemical processes, as a functional additive for material modification, as an optical coating material, and as a fluoro intermediate in specialty chemical production. The versatility of aluminum fluoride across these applications underpins its growing market demand.
  • BY END-USE INDUSTRY
    The aluminum industry leads in consumption due to the necessity of aluminum fluoride in smelting processes. The automotive and aerospace industries follow, leveraging aluminum for lightweight and high-strength components, indirectly boosting demand for aluminum fluoride. The construction sector, ceramics & glass industry, chemical & petrochemical sector, and electronics & optics industries also contribute to demand, driven by requirements for enhanced material performance, energy efficiency, and innovative applications.
  • COMPETITIVE LANDSCAPE
    The major market players have adopted organic and inorganic strategies, including partnerships and investments. For instance, Fluorsid renewed its strategic partnership with Norsk Hydro ASA, one of the world’s leading aluminum producers. Under the agreement, Fluorsid’s Odda plant will allocate approximately 50% of its aluminum fluoride production to supply Hydro’s five aluminum smelters over the next five years. This includes the Sunndal facility, the largest primary aluminum plant in Europe.

The aluminum fluoride market is expected to expand significantly over the next decade, supported by innovations in raw material sourcing and sustainable production processes. Aluminum fluoride is essential in reducing energy consumption and improving efficiency in aluminum electrolysis, making it a critical material for modern smelters. Growing investments in aluminum production and the modernization of smelting facilities are increasing the demand for high-quality aluminum fluoride. Additionally, the adoption of alternative production methods, such as fluorosilicic acid (FSA)-based processes, and the emphasis on minimizing environmental impact are creating opportunities for producers to offer more efficient and eco-friendly solutions.

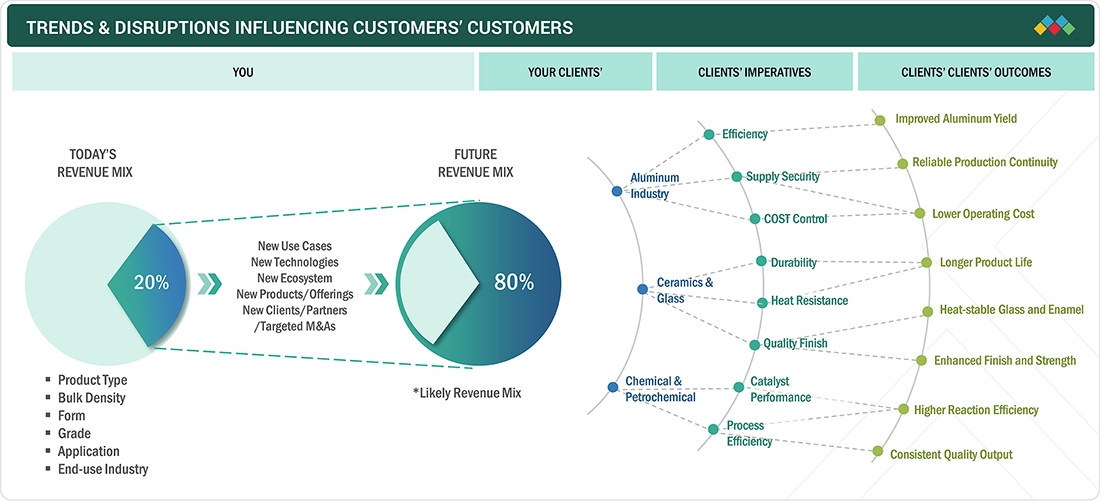
TRENDS & DISRUPTIONS IMPACTING CUSTOMERS' CUSTOMERS

The impact on consumers’ business arises from customer trends or disruptions in the aluminum industry. Aluminum smelters are the primary clients of aluminum fluoride manufacturers, while downstream industries such as automotive, construction, and packaging represent the end-user applications of aluminum. Shifts in these sectors, including changes in aluminum demand, technological upgrades, or regulatory requirements, can influence the operational costs and procurement strategies of end users. Any variation in the revenue or production volumes of aluminum consumers will, in turn, impact the purchasing requirements of smelters, which subsequently affects the revenues of aluminum fluoride manufacturers. This interconnected relationship demonstrates how trends, disruptions, or changes in demand across the aluminum value chain can directly affect market conditions and the financial performance of aluminum fluoride producers.

Source: Secondary Research, Interviews with Experts, MarketsandMarkets Analysis

ALUMINUM FLUORIDE MARKET DYNAMICS

Drivers
Impact
Level
  • Surging aluminum production to elevate aluminum fluoride requirements in electrolytic processes
  • Improved smelter utilization ensures steady demand
RESTRAINTS
Impact
Level
  • Declining fluorite and aluminum hydroxide prices exert margin pressure on producers
OPPORTUNITIES
Impact
Level
  • Shift toward fluorosilicic acid (FSA)-based aluminum fluoride production
  • Growing adoption of vertical integration by aluminum producers to supply aluminum fluoride and stabilize costs
CHALLENGES
Impact
Level
  • Regulatory pressure on hydrofluoric acid use
  • Just-in-time procurement by aluminum smelters limits demand recovery

Source: Secondary Research, Interviews with Experts, MarketsandMarkets Analysis

Driver: Surging aluminum production to elevate aluminum fluoride requirements in electrolytic processes

The expansion of global aluminum production is significantly increasing the demand for aluminum fluoride, an essential component in the electrolytic production of aluminum. Aluminum fluoride functions to lower the melting point of alumina and enhance the conductivity of the electrolyte, ensuring efficient and stable electrolytic operations. As the scale of aluminum production rises to meet growing requirements from sectors such as construction and automotive, the quantity of aluminum fluoride required in smelting processes increases proportionally. Furthermore, advancements in aluminum production technologies aimed at improving energy efficiency and reducing carbon emissions necessitate precise control of electrolyte composition, which further elevates the consumption of high-purity aluminum fluoride. The establishment of new smelting facilities and the expansion of existing capacities in regions including Asia, the Middle East, and Latin America contribute additional growth to regional demand. These factors position aluminum fluoride as a critical input to produce aluminum, making it indispensable for sustaining large-scale, efficient, and technologically advanced smelting operations, thereby driving steady growth in the global aluminum fluoride market.

Restraint: Declining fluorite and aluminum hydroxide prices exert margin pressure on producers

The decline in prices of fluorite and aluminum hydroxide is placing considerable margin pressure on aluminum fluoride producers, which can act as a restraint on the growth of the aluminum fluoride market. Aluminum fluoride production relies heavily on fluorite and aluminum hydroxide as primary raw materials, and price fluctuations directly impact production costs and profitability. Sustained reductions in raw material prices may constrain the financial capacity of manufacturers to invest in production expansion, technological improvements, and process optimization, limiting overall market growth. Furthermore, price volatility in key inputs can introduce uncertainty in long-term supply agreements and strategic planning, discouraging large-scale procurement by downstream aluminum producers. In certain instances, cost pressures may compel producers to compromise on quality standards, potentially affecting the performance of aluminum fluoride in electrolytic processes and reducing its market appeal. As a result, despite increasing global demand for aluminum, the financial and operational pressures from declining fluorite and aluminum hydroxide prices are a significant limiting factor, moderating production expansion and restricting growth in the global aluminum fluoride market.

Opportunity: Shift toward fluorosilicic acid (FSA)-based aluminum fluoride production

The increasing adoption of fluorosilicic acid (FSA)-based processes for aluminum fluoride production presents significant opportunities for the aluminum fluoride market. FSA-based production offers several technical and economic advantages over traditional methods, including lower energy consumption, reduced dependency on high-purity fluorite, and the ability to utilize by-products from the phosphate industry, thereby enhancing sustainability. The flexibility of FSA-based production allows manufacturers to optimize process efficiency and control product quality, meeting the growing demand for high-purity aluminum fluoride in advanced aluminum smelting operations. Additionally, the use of FSA provides cost advantages in regions where fluorosilicic acid is readily available as a by-product of phosphoric acid production, enabling localized production and reducing reliance on imported raw materials. The environmental benefits associated with FSA-based processes, such as reduced waste generation and improved resource utilization, align with global trends toward sustainable industrial practices. Consequently, the shift toward FSA-based aluminum fluoride production not only supports more efficient and environmentally responsible operations but also opens avenues for market expansion, technological innovation, and increased adoption of aluminum fluoride across diverse smelting regions.

Challenge: Regulatory pressure on hydrofluoric acid use

Regulatory pressure on hydrofluoric acid (HF) presents a significant challenge for the aluminum fluoride market, as HF is a critical raw material in its production. Stricter environmental and safety regulations in key producing regions aim to limit HF emissions and manage its handling due to its highly corrosive and toxic nature. Compliance with these regulations often requires substantial investments in safety infrastructure, emission control systems, and process modifications, increasing production costs for aluminum fluoride manufacturers. In some cases, stringent restrictions may limit production capacity or delay plant expansions, constraining market supply. Furthermore, regulatory restrictions can lead to uncertainties in the supply of raw materials, as hydrofluoric acid suppliers may be subject to production limits or transportation restrictions, which can adversely impact aluminum fluoride manufacturers. These factors may also slow the adoption of aluminum fluoride in emerging markets where regulatory frameworks are evolving. Consequently, the imposition of tighter controls on hydrofluoric acid use increases operational complexity, raises production costs, and may restrict supply growth, posing a considerable challenge to the expansion and stability of the global aluminum fluoride market.

Aluminum Fluoride (AlF3): COMMERCIAL USE CASES ACROSS INDUSTRIES

COMPANY USE CASE DESCRIPTION BENEFITS
Aluminum fluoride is used in primary aluminum electrolysis to improve cell stability, enhance metal purity, and optimize production efficiency. Enhanced electrolyte conductivity, lower energy consumption, improved aluminum yield
Application of aluminum fluoride in advanced smelting cells enables controlled alumina dissolution, consistent electrolysis, and reduced energy consumption. Reduced alumina melting point, stabilized electrolysis, extended cell life
Aluminum fluoride is used in global primary aluminum smelters to optimize electrolysis, improve energy efficiency, and consistently produce high-quality aluminum. Enhanced electrolysis efficiency, lower energy consumption, improved aluminum yield and quality
Specialty electrical-grade aluminum incorporates aluminum fluoride to enhance conductivity, reduce defects, and maintain consistent material properties for electrical applications. Improved conductivity, reduced defects, stable quality for electrical components

Logos and trademarks shown above are the property of their respective owners. Their use here is for informational and illustrative purposes only.

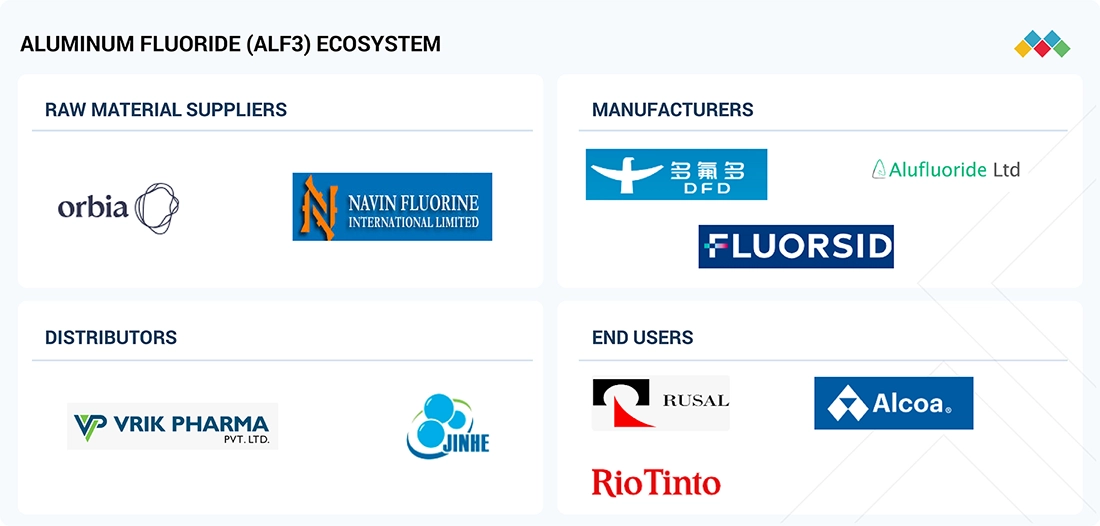
ALUMINUM FLUORIDE MARKET ECOSYSTEM

The aluminum fluoride ecosystem involves identifying and analyzing interconnected relationships among stakeholders, including raw material suppliers, manufacturers, distributors, and end users. The raw material suppliers provide critical inputs such as hydrofluoric acid, fluorite, and aluminum hydroxide to aluminum fluoride manufacturers. The manufacturers utilize processes such as the hydrofluoric acid route and fluorosilicic acid (FSA)-based production to produce high-purity aluminum fluoride for electrolytic aluminum production. The distributors and suppliers serve as intermediaries between manufacturers and end users, ensuring the efficient flow of aluminum fluoride to aluminum smelters and other downstream industries. By consolidating the supply chain, these stakeholders enhance operational efficiency, reduce logistical complexities, and support profitability, while enabling consistent and timely delivery of aluminum fluoride to meet the growing demand in global aluminum production.

Logos and trademarks shown above are the property of their respective owners. Their use here is for informational and illustrative purposes only.

ALUMINUM FLUORIDE MARKET SEGMENTS

Source: Secondary Research, Interviews with Experts, MarketsandMarkets Analysis

Aluminum Fluoride (ALF3) Market, By Product Type

Anhydrous aluminum fluoride holds the largest share in the aluminum fluoride market due to its essential role in large-scale aluminum smelting. Its high thermal stability and low moisture content make it ideal for electrolytic reduction cells, ensuring consistent electrolyte composition, high current efficiency, and reduced energy losses. Compared to wet aluminum fluoride, the anhydrous type is more effective in maintaining optimal cryolite ratios and stable molten bath chemistry. It is also easier to handle, store, and transport, supporting long-distance supply chains. With modern smelters optimized for anhydrous grades, its dominance is reinforced and expected to continue alongside global aluminum capacity expansion.

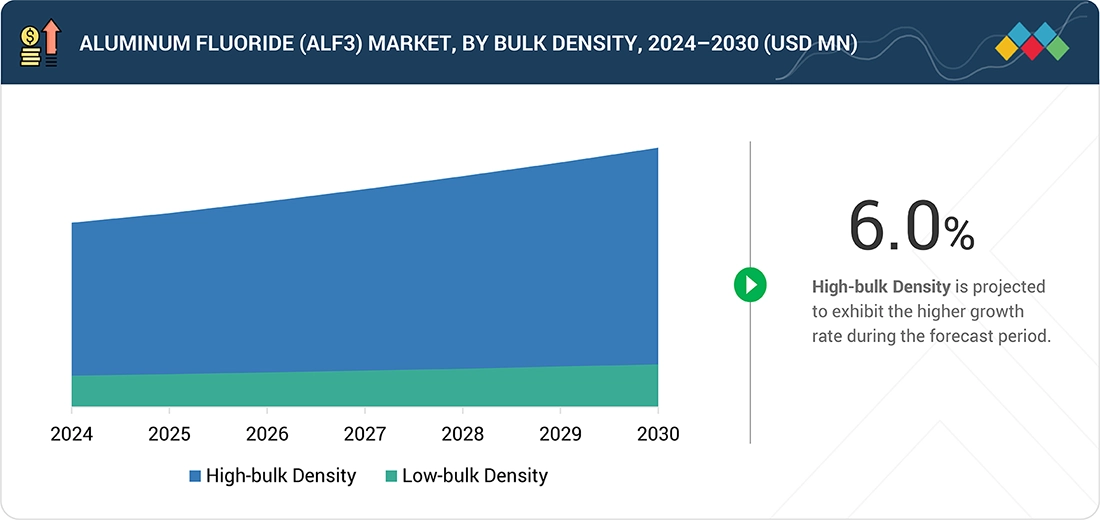
Aluminum Fluoride (ALF3) Market, By Bulk Density

High bulk density aluminum fluoride accounts for the largest share in the market due to its operational and logistical advantages in aluminum production. Materials with higher bulk density occupy less volume per unit weight, allowing for more efficient storage and transportation, which is particularly important for large-scale smelters and long-distance supply chains. In electrolytic aluminum production, high bulk density aluminum fluoride improves handling in dosing systems, ensures uniform distribution in the electrolyte, and supports stable molten bath chemistry, contributing to higher current efficiency and consistent metal quality. Furthermore, it reduces shipping and storage costs compared to low-density grades, making it economically attractive for smelters. These combined technical and cost benefits make high bulk density aluminum fluoride the preferred choice for modern aluminum smelting operations, sustaining its dominant market share.

Aluminum Fluoride (ALF3) Market, By Form

Powdered aluminum fluoride dominates the market due to its versatility in aluminum smelting and other industrial applications. Its fine particle size provides a higher surface area, enhancing reactivity and enabling faster dissolution in the molten bath, which ensures uniform electrolyte composition and stable cell performance. Powdered aluminum fluoride also allows precise dosing and easier blending with other additives, supporting efficient process control. Logistically, it can be packaged in bags or bulk containers, integrates seamlessly with automated feeding systems, and reduces manual handling and material loss. The production process is well-established and scalable, ensuring a reliable global supply. Additionally, its adaptability extends to ceramics, glass, and chemical manufacturing, making powdered aluminum fluoride the most widely used and preferred form in the market.

Aluminum Fluoride (ALF3) Market, By Grade

Smelter-grade aluminum fluoride holds the largest share in the market because it directly serves aluminum smelters, the primary consumers of aluminum fluoride. This grade is specifically designed for large-scale electrolytic cells, ensuring optimal cryolite ratio, stable bath conditions, and enhanced current efficiency during continuous aluminum production. Produced in bulk and optimized for cost-effectiveness, smelter-grade aluminum fluoride is preferred for high-volume operations requiring consistent quality at competitive pricing. Its standardization ensures compatibility with feeding systems across different smelter designs, reducing the need for customization. The global expansion of aluminum smelting capacity and the requirement for reliable, large-scale supply chains further reinforce the dominance of smelter-grade aluminum fluoride, making it indispensable for day-to-day aluminum production.

Aluminum Fluoride (ALF3) Market, By Application

Electrolyte additive is the largest application of aluminum fluoride because it is directly linked to the scale and continuity of aluminum smelting operations. Unlike secondary uses, aluminum fluoride as an electrolyte additive is consumed continuously due to losses from evaporation and chemical reactions in reduction cells, creating consistently high demand. Maintaining the correct aluminum fluoride -to-alumina ratio in the cryolite bath is essential for stable pot performance and aluminum quality, preventing smelters from reducing usage without affecting output. As global aluminum production grows, aluminum fluoride consumption increases proportionally, reinforcing its recurring requirement. Additionally, most production capacity is designed to supply smelters with this form, and with no effective substitutes, the electrolyte additive application remains the primary driver of market demand.

Aluminum Fluoride (ALF3) Market, By End-Use Industry

The aluminum industry is the largest end-use segment in the aluminum fluoride market due to its high consumption volume and dependence on the material for smelting operations. Unlike ceramics, glass, or specialty chemicals, where aluminum fluoride is used in limited applications, aluminum smelters require it as a critical operational input across all facilities. Most aluminum fluoride production is aligned with aluminum demand to ensure a consistent, large-volume supply. The industry’s dominance is reinforced by major smelting clusters in China, the Middle East, and Russia, and long-term procurement contracts create stable, predictable demand. As global aluminum production grows to serve construction, automotive, and aerospace sectors, aluminum fluoride consumption increases proportionally, securing the aluminum industry’s position as the primary end-use segment.

REGION

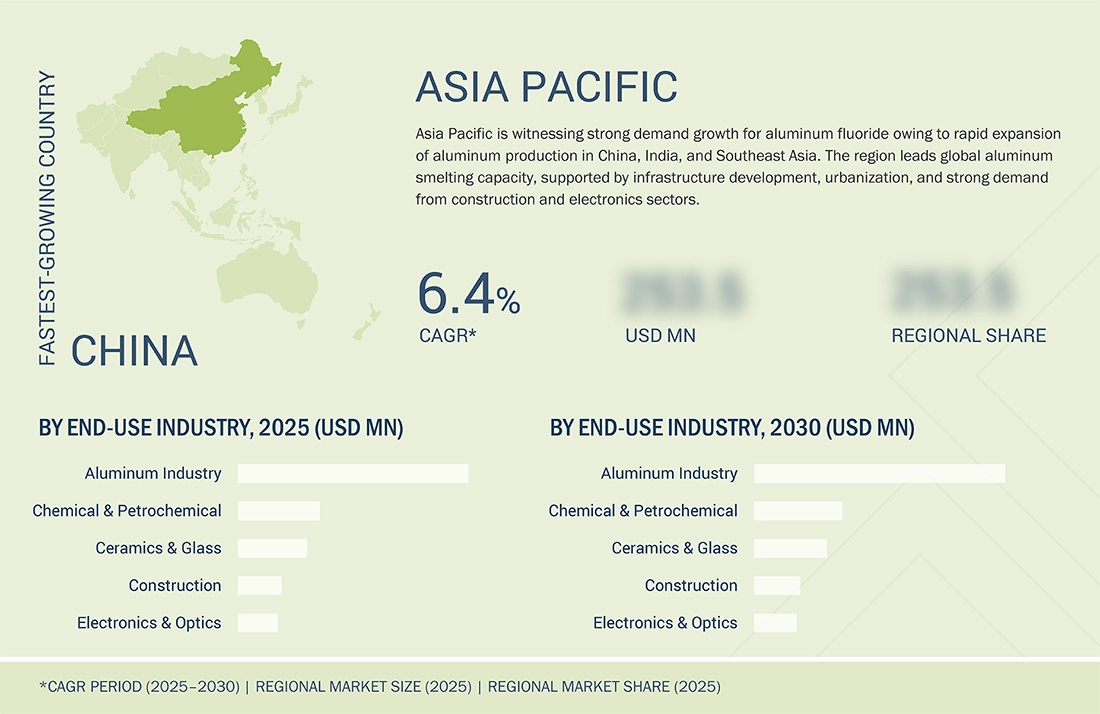
Asia Pacific to be the largest and fastest-growing region in the global aluminum fluoride market during the forecast period

The Asia Pacific region is the largest and fastest-growing market for aluminum fluoride due to its dominant position in global aluminum production and ongoing industrial expansion. Countries such as China, India, Japan, and South Korea host extensive aluminum smelting capacities, accounting for a substantial share of global output. Rising demand from key downstream sectors, including automotive, construction, and electrical industries, drives the need for continuous and large-scale aluminum fluoride consumption. China is home to some of the world’s largest smelters, which require high-purity aluminum fluoride to maintain stable electrolytic processes, optimize current efficiency, and improve metal quality. Additionally, governments in the region are investing in modernizing smelting facilities with energy-efficient and environmentally compliant technologies, further increasing the demand for high-quality aluminum fluoride. Well-established raw material supply chains, including fluorite and hydrofluoric acid, support local production and reduce dependence on imports, enhancing market stability. Rapid industrialization, urbanization, and growth in aluminum-intensive sectors, combined with large-scale smelting infrastructure and strong government support, collectively make Asia Pacific the largest and fastest-growing global market for aluminum fluoride.

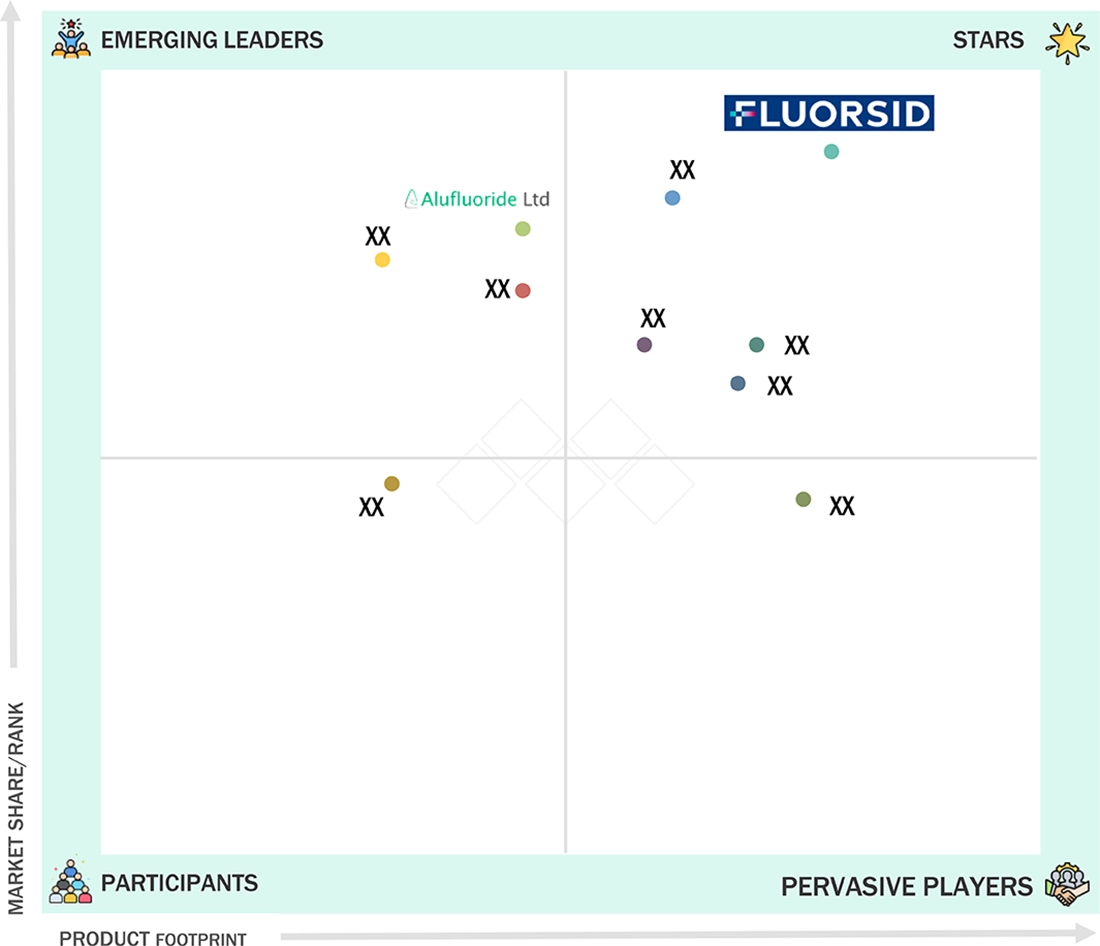
Aluminum Fluoride (AlF3): COMPANY EVALUATION MATRIX

The aluminum fluoride market is characterized by a mix of emerging leaders, participants, pervasive players, and dominant stars. The chart highlights Fluorsid as a strong market leader in terms of both market share and product footprint, occupying the "Stars" quadrant. Alufluoride Limited falls within the "Emerging Leaders" quadrant. Several smaller players cluster in the "Participants" and "Pervasive Players" zones, reflecting niche positioning or early-stage growth potential. Overall, market dynamics suggest strong competition, with global giants driving innovation while smaller companies strive for differentiation and market penetration.

Source: Secondary Research, Interviews with Experts, MarketsandMarkets Analysis

ALUMINUM FLUORIDE MARKET SCOPE

REPORT METRIC DETAILS
Market Size in 2024 (Value) USD 2.2 Billion
Market Forecast in 2030 (value) USD 3.1 Billion
Growth Rate 5.9%
Years Considered 2021–2030
Base Year 2024
Forecast Period 2025–2030
Units Considered Value (USD Million/Billion), Volume (Kiloton)
Report Coverage Revenue Forecast, Company Ranking, Competitive Landscape, Growth Factors, and Trends
Segments Covered
  • By Form:
    • Powder
    • Granules
    • Pellets
  • By Product Type:
    • Anhydrous
    • Dry
    • Wet
  • By Bulk Density:
    • Low-bulk Density
    • High-bulk Density
  • By Grade:
    • Smelter Grade
    • Catalyst Grade
    • Technical Grade
    • Laboratory Grade
    • High-purity Grade
  • By Application:
    • Electrolyte Additive
    • Flux Agent
    • Catalyst/Catalyst Support
    • Functional Additive
    • Optical Coating Material
    • Fluoro Intermediate
    • Other Applications
  • By End-Use Industry:
    • Aluminum Industry
    • Automotive
    • Construction
    • Aerospace
    • Ceramics & Glass
    • Chemical & Petrochemical
    • Electronics & Optics
    • Other End-use Industries
Regions Covered Asia Pacific, North America, Europe, Middle East & Africa, South America

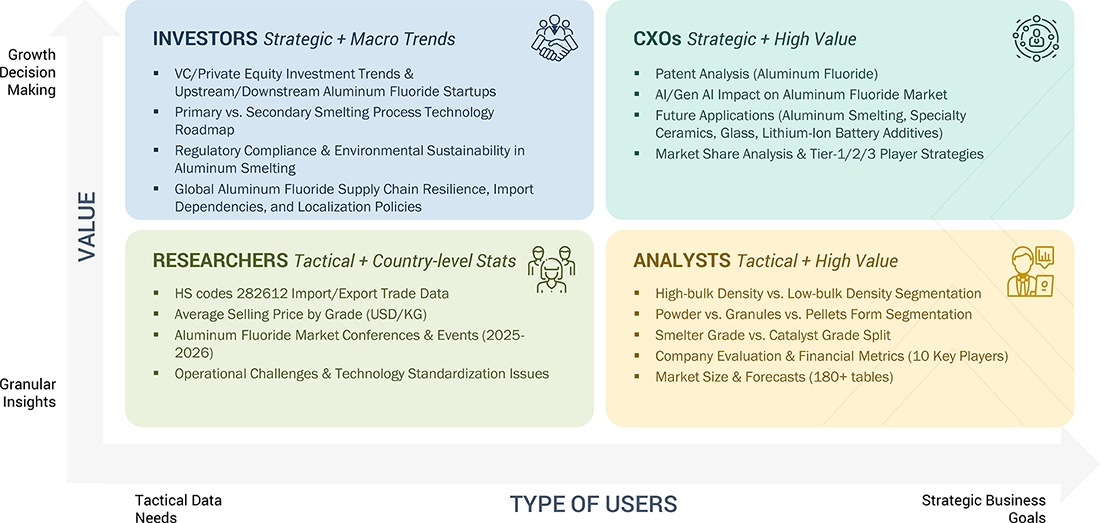
WHAT IS IN IT FOR YOU: Aluminum Fluoride (AlF3) REPORT CONTENT GUIDE

DELIVERED CUSTOMIZATIONS

We have successfully delivered the following deep-dive customizations:

CLIENT REQUEST CUSTOMIZATION DELIVERED VALUE ADDS
Country-Level Breakdown Instead of just regional coverage, the report can provide country-specific market data (e.g., India, Brazil, Saudi Arabia, South Africa, Mexico). This includes demand drivers, production capacities, import/export trends, and regulatory outlooks. Helps companies identify high-growth national markets and plan market entry strategies with greater accuracy
Bulk Density-Specific Deep Dive A customized focus on specific aluminum fluoride density, such as low-bulk density and high-bulk density. Includes end-user adoption rates, OEM partnerships, and future demand projections for each bulk density. Supports clients targeting niche segments, enabling them to design product portfolios or allocate R&D spending more effectively
Form Customization Comparative analysis of powdered and granule forms. Covers performance benchmarks, technical advantages, pricing, and suitability for different industries. Enables manufacturers and buyers to optimize purity selection, align pricing with performance
Competitive Benchmarking Extended profiling of regional and niche players alongside global leaders (Fluorsid and Industries Chimiques du Fluor). Includes SWOT analysis, product differentiation, technology focus, and market positioning. Provides a clear competitive landscape, helping clients identify potential partners, acquisition targets, or competitive threats

RECENT DEVELOPMENTS

  • June 2025 : Orbia Fluor & Energy Materials announced a corporate rebranding to unify its identity under the Orbia Fluor & Energy Materials (Orbia F&EM) brand. Effective immediately, this brand will serve as the sole identity for the business, both internally and externally, replacing the previous Koura brand.
  • April 2024 : Fluorsid renewed its strategic partnership with Norsk Hydro ASA, one of the world’s leading aluminum producers. Under the agreement, Fluorsid’s Odda plant will allocate approximately 50% of its aluminum fluoride production to supply Hydro’s five aluminum smelters over the next five years. This includes the Sunndal facility, the largest primary aluminum plant in Europe.
  • April 2024 : RUSAL and PhosAgro strengthened their long-term collaboration by extending the supply agreement for aluminum fluoride until 2044. As part of this partnership, PhosAgro’s facility will increase production capacity from 75,000 tons to 96,000 tons annually, with additional supplies expected from mid-2026.
  • November 2024 : PhosAgro undertook a significant expansion initiative as part of its strategic development plan toward 2025, with a record investment of USD 0.8 billion. This expansion focuses on increasing aluminum fluoride production capacity across key facilities, including the Cherepovets and Volkhov plants.
  • May 2021 : Alufluoride Limited commenced commercial production at its newly expanded aluminum fluoride plant in Visakhapatnam, increasing its production capacity to 12,000 TPA. This expansion marked a key milestone in the company’s growth, enabling it to meet the growing demand for aluminum fluoride from both domestic and international customers.


Table of Contents

Exclusive indicates content/data unique to MarketsandMarkets and not available with any competitors.

TITLE
PAGE NO
1
INTRODUCTION


28
2
RESEARCH METHODOLOGY


32
3
EXECUTIVE SUMMARY


43
4
PREMIUM INSIGHTS


50
5
MARKET OVERVIEW
Aluminum fluoride market thrives on increased production, vertical integration, and FSA-based innovations.


55
 
5.1
INTRODUCTION


5.2
MARKET DYNAMICS


5.2.1
DRIVERS


5.2.1.1
Surging aluminum production to elevate aluminum fluoride requirements in electrolytic processes


5.2.1.2
Improved smelter utilization ensures steady demand


5.2.2
RESTRAINTS


5.2.2.1
Declining fluorite and aluminum hydroxide prices exert margin pressure on producers


5.2.3
OPPORTUNITIES


5.2.3.1
Shift toward fluorosilicic acid (FSA)-based aluminum fluoride production


5.2.3.2
Growing adoption of vertical integration by aluminum producers to supply aluminum fluoride and stabilize costs


5.2.4
CHALLENGES


5.2.4.1
Just-in-time procurement by aluminum smelters limits demand recovery


5.2.4.2
Regulatory pressure on hydrofluoric acid use
 
 
5.3
GENERATIVE AI


5.3.1
INTRODUCTION


5.3.2
IMPACT ON ALUMINUM FLUORIDE MARKET
 
 
6
INDUSTRY TRENDS
Discover emerging disruptions reshaping supply chains and investment in aluminum fluoride markets.


63
 
6.1
INTRODUCTION


6.2
TRENDS/DISRUPTIONS IMPACTING CUSTOMER BUSINESS


6.3
SUPPLY CHAIN ANALYSIS


6.4
INVESTMENT LANDSCAPE AND FUNDING SCENARIO


6.5
PRICING ANALYSIS


6.5.1
AVERAGE SELLING PRICE OF ALUMINUM FLUORIDE, BY REGION, 2021–2024


6.5.2
AVERAGE SELLING PRICE OF ALUMINUM FLUORIDE, BY GRADE, 2021–2024


6.5.3
AVERAGE SELLING PRICE OF ALUMINUM FLUORIDE, BY GRADE, 2024


6.6
ECOSYSTEM ANALYSIS


6.7
TECHNOLOGY ANALYSIS


6.7.1
KEY TECHNOLOGIES


6.7.2
COMPLEMENTARY TECHNOLOGIES


6.7.3
ADJACENT TECHNOLOGIES


6.8
PATENT ANALYSIS


6.8.1
METHODOLOGY


6.8.2
PATENTS GRANTED WORLDWIDE, 2015–2024


6.8.2.1
Patent publication trends


6.8.3
INSIGHTS


6.8.4
LEGAL STATUS OF PATENTS


6.8.5
JURISDICTION ANALYSIS


6.8.6
TOP APPLICANTS


6.8.7
LIST OF MAJOR PATENTS


6.9
TRADE ANALYSIS


6.9.1
IMPORT SCENARIO (HS CODE 282612)


6.9.2
EXPORT SCENARIO (HS CODE 282612)


6.10
KEY CONFERENCES AND EVENTS, 2025–2026


6.11
TARIFF AND REGULATORY LANDSCAPE


6.11.1
TARIFF ANALYSIS


6.11.2
STANDARDS AND REGULATORY LANDSCAPE


6.11.2.1
Regulatory bodies, government agencies, and other organizations


6.11.2.2
Standards
 
 
6.12
PORTER’S FIVE FORCES ANALYSIS


6.12.1
THREAT OF NEW ENTRANTS


6.12.2
THREAT OF SUBSTITUTES


6.12.3
BARGAINING POWER OF SUPPLIERS


6.12.4
BARGAINING POWER OF BUYERS


6.12.5
INTENSITY OF COMPETITIVE RIVALRY


6.13
KEY STAKEHOLDERS AND BUYING CRITERIA


6.13.1
KEY STAKEHOLDERS IN BUYING PROCESS


6.13.2
BUYING CRITERIA


6.14
MACROECONOMIC OUTLOOK


6.14.1
GDP TRENDS AND FORECASTS OF MAJOR ECONOMIES


6.15
CASE STUDY ANALYSIS


6.15.1
IMPROVEMENT IN SODIUM REDUCTION PROCESS DURING TAC THROUGH ALF3


6.15.2
VARIATION IN ALUMINUM SMELTING CELL THERMAL STATE WITH CONTROL IMPLICATIONS


6.15.3
OPTIMIZING ALUMINUM SMELTING EFFICIENCY WITH SYSTEMATIC FLUORIDE CONTROL


6.16
IMPACT OF 2025 US TARIFF - ALUMINUM FLUORIDE MARKET


6.16.1
INTRODUCTION


6.16.2
KEY TARIFF RATES


6.16.3
PRICE IMPACT ANALYSIS


6.16.4
IMPACT ON REGION


6.16.4.1
North America


6.16.4.2
Europe


6.16.4.3
Asia Pacific


6.16.5
IMPACT ON PRODUCT TYPE
 
 
7
ALUMINUM FLUORIDE MARKET, BY GRADE
Market Size & Growth Rate Forecast Analysis to 2030 in USD Million and Kilotons | 4 Data Tables


98
 
7.1
INTRODUCTION


7.2
SMELTER GRADE


7.2.1
EFFECTIVE FLUXING AGENT IN ELECTROLYTIC REDUCTION OF ALUMINA TO ALUMINUM METAL—KEY FACTOR DRIVING MARKET


7.3
CATALYST GRADE


7.3.1
WIDELY USED IN PROCESSES WHERE PRECISE CONTROL OVER REACTION KINETICS AND SELECTIVITY IS CRITICAL


7.4
TECHNICAL GRADE


7.4.1
BROAD UTILITY, COST-EFFICIENCY, AND ADAPTABLE CHARACTERISTICS TO DRIVE ADOPTION


7.5
LABORATORY GRADE


7.5.1
EXCEPTIONAL CHEMICAL PURITY, MINIMAL IMPURITIES, AND CONSISTENT PHYSICAL PROPERTIES TO DRIVE GROWTH


7.6
HIGH-PURITY GRADE


7.6.1
DEMAND FOR ULTRA-PURE ALUMINUM FLUORIDE IN PRECISION MANUFACTURING TO DRIVE MARKET
 
 
8
ALUMINUM FLUORIDE MARKET, BY PRODUCT TYPE
Market Size & Growth Rate Forecast Analysis to 2030 in USD Million and Kilotons | 4 Data Tables


104
 
8.1
INTRODUCTION


8.2
ANHYDROUS


8.2.1
PREFERRED CHOICE FOR APPLICATIONS REQUIRING MAXIMUM RELIABILITY AND EFFICIENCY


8.3
DRY


8.3.1
IMPROVES SMELTING PERFORMANCE AND PRODUCT QUALITY THROUGH EFFICIENT MOISTURE-CONTROLLED FLUXING SOLUTIONS


8.4
WET


8.4.1
DRIVES EFFICIENT SMELTING AND RECYCLING INNOVATION THROUGH MOISTURE-RICH ALUMINUM FLUORIDE SOLUTIONS
 
 
9
ALUMINUM FLUORIDE MARKET, BY FORM
Market Size & Growth Rate Forecast Analysis to 2030 in USD Million and Kilotons | 4 Data Tables


109
 
9.1
INTRODUCTION


9.2
POWDER


9.2.1
PREFERRED CHOICE DUE TO SUPERIOR CHEMICAL PERFORMANCE AND FLEXIBILITY IN DOSING


9.3
GRANULE


9.3.1
COMPATIBILITY WITH VARIETY OF DOSING SYSTEMS TO SUPPORT ADOPTION


9.4
PELLET


9.4.1
LARGER PARTICLE SIZE AND DENSE COMPOSITION TO DRIVE ADOPTION
 
 
10
ALUMINUM FLUORIDE MARKET, BY BULK DENSITY
Market Size & Growth Rate Forecast Analysis to 2030 in USD Million and Kilotons | 4 Data Tables


114
 
10.1
INTRODUCTION


10.2
LOW-BULK DENSITY


10.2.1
ADVANTAGEOUS IN CERTAIN SMELTING TECHNOLOGIES WHERE RAPID INCORPORATION INTO BATH IS REQUIRED


10.3
HIGH-BULK DENSITY


10.3.1
SUPERIOR HANDLING, PACKING EFFICIENCY, AND PURITY TO DRIVE MARKET GROWTH
 
 
11
ALUMINUM FLUORIDE MARKET, BY APPLICATION
Market Size & Growth Rate Forecast Analysis to 2030 in USD Million and Kilotons | 4 Data Tables


118
 
11.1
INTRODUCTION


11.2
ELECTROLYTE ADDITIVE


11.2.1
ROLE OF ALUMINUM FLUORIDE IN OPTIMIZING ELECTROLYTIC BATH EFFICIENCY AND ENERGY SAVINGS TO DRIVE MARKET


11.3
FLUX AGENT


11.3.1
ENERGY SAVINGS AND IMPROVED REFINING IN METAL PRODUCTION WITH ADVANCED FLUX AGENTS TO PROPEL MARKET


11.4
CATALYST/CATALYST SUPPORT


11.4.1
IMPROVED CATALYTIC PERFORMANCE AND DURABILITY IN DIVERSE CHEMICAL MANUFACTURING PROCESSES TO DRIVE MARKET


11.5
FUNCTIONAL ADDITIVE


11.5.1
ADVANCING INDUSTRIAL MATERIALS WITH MULTIFUNCTIONAL ADDITIVES FOR ENHANCED DURABILITY AND PERFORMANCE TO DRIVE MARKET


11.6
OPTICAL COATING MATERIAL


11.6.1
OPTICAL CLARITY AND DURABILITY FUELED BY ADVANCED COATING MATERIALS TO DRIVE DEMAND


11.7
FLUORO INTERMEDIATE


11.7.1
HIGH-QUALITY PRODUCTION OF FLUORINE-CONTAINING COMPOUNDS TO PROPEL MARKET


11.8
OTHER APPLICATIONS


11.8.1
CORROSION INHIBITORS


11.8.2
ETCHING/SURFACE TREATMENT
 
 
12
ALUMINUM FLUORIDE MARKET, BY END-USE INDUSTRY
Market Size & Growth Rate Forecast Analysis to 2030 in USD Million and Kilotons | 4 Data Tables


126
 
12.1
INTRODUCTION


12.2
ALUMINUM


12.2.1
OPTIMIZING ELECTROLYTE BATH PERFORMANCE FOR EFFICIENT AND SUSTAINABLE ALUMINUM SMELTING PROCESSES TO DRIVE MARKET


12.3
CERAMICS & GLASS


12.3.1
INCREASING CERAMIC TILE PRODUCTION AND GLASS INNOVATION TO PROPEL CONSUMPTION OF ALUMINUM FLUORIDE


12.4
CHEMICAL & PETROCHEMICAL


12.4.1
CATALYTIC EFFICIENCY AND FLUORINATION NEEDS TO PROPEL DEMAND FOR ALUMINUM FLUORIDE


12.5
ELECTRONICS & OPTICS


12.5.1
DEMAND FOR ULTRA-PURE MATERIALS TO DRIVE MARKET


12.6
AUTOMOTIVE


12.6.1
ADVANCEMENTS IN VEHICLE DESIGN DRIVE DEMAND FOR LIGHTWEIGHT MATERIALS


12.7
AEROSPACE


12.7.1
ADVANCEMENTS IN LIGHTWEIGHT AEROSPACE MATERIALS AND RIGOROUS QUALITY STANDARDS TO DRIVE DEMAND


12.8
CONSTRUCTION


12.8.1
ENHANCED ALUMINUM ALLOY REQUIREMENTS IN CONSTRUCTION TO DRIVE DEMAND


12.9
OTHER END-USE INDUSTRIES


12.9.1
METALWORKING & WELDING


12.9.2
MEDICAL & PHARMACEUTICAL
 
 
13
ALUMINUM FLUORIDE MARKET, BY REGION
Market Size & Growth Rate Forecast Analysis to 2030 in USD Million and Kilotons | 236 Data Tables


135
 
13.1
INTRODUCTION


13.2
ASIA PACIFIC


13.2.1
CHINA


13.2.1.1
Dominance in global aluminum production to drive market


13.2.2
JAPAN


13.2.2.1
Growth in electronics sector to increase demand


13.2.3
INDIA


13.2.3.1
Rising demand from automotive and aerospace sectors to drive market


13.2.4
SOUTH KOREA


13.2.4.1
Growth of export-oriented ceramics and glass manufacturing industries to drive market


13.2.5
REST OF ASIA PACIFIC


13.3
NORTH AMERICA


13.3.1
US


13.3.1.1
Growing aerospace and automotive industries to increase demand


13.3.2
CANADA


13.3.2.1
Presence of established aluminum industry to propel market


13.3.3
MEXICO


13.3.3.1
Rise as key manufacturing hub for aluminum to support market growth
 
 
13.4
EUROPE


13.4.1
GERMANY


13.4.1.1
Growth in commercial vehicle and specialty automotive sectors to drive market


13.4.2
ITALY


13.4.2.1
Growth in construction industry to drive demand


13.4.3
FRANCE


13.4.3.1
Research into aluminum alloys to boost usage


13.4.4
UK


13.4.4.1
Growth in industrial and manufacturing sectors to drive market


13.4.5
SPAIN


13.4.5.1
Rising adoption of low-carbon footprint tires to drive market


13.4.6
RUSSIA


13.4.6.1
Expansion of domestic aluminum smelting capacity to propel market


13.4.7
REST OF EUROPE


13.5
MIDDLE EAST & AFRICA


13.5.1
GCC COUNTRIES


13.5.1.1
Saudi Arabia


13.5.1.2
UAE


13.5.1.3
Rest of GCC countries


13.5.2
SOUTH AFRICA


13.5.2.1
Growing construction activities to increase consumption of aluminum fluoride


13.5.3
REST OF MIDDLE EAST & AFRICA


13.6
SOUTH AMERICA


13.6.1
ARGENTINA


13.6.1.1
Expansion of automotive sector to drive demand


13.6.2
BRAZIL


13.6.2.1
Rise in aluminum production to propel demand


13.6.3
REST OF SOUTH AMERICA
 
 
14
COMPETITIVE LANDSCAPE
Uncover strategies and market positions driving key players' dominance and emerging leaders' rise.


235
 
14.1
INTRODUCTION


14.2
KEY PLAYER STRATEGIES/RIGHT TO WIN


14.3
MARKET SHARE ANALYSIS


14.4
REVENUE ANALYSIS


14.5
COMPANY EVALUATION MATRIX: KEY PLAYERS, 2024


14.5.1
STARS


14.5.2
EMERGING LEADERS


14.5.3
PERVASIVE PLAYERS


14.5.4
PARTICIPANTS


14.5.5
COMPANY FOOTPRINT: KEY PLAYERS, 2024


14.5.5.1
Company footprint


14.5.5.2
Region footprint


14.5.5.3
Form footprint


14.5.5.4
Grade footprint


14.5.5.5
End-use industry footprint
 
 
14.6
COMPANY EVALUATION MATRIX: STARTUPS/SMES, 2024


14.6.1
PROGRESSIVE COMPANIES


14.6.2
RESPONSIVE COMPANIES


14.6.3
DYNAMIC COMPANIES


14.6.4
STARTING BLOCKS


14.6.5
COMPETITIVE BENCHMARKING: STARTUPS/SMES, 2024


14.6.5.1
Detailed list of key startups/SMEs


14.6.5.2
Competitive benchmarking of key startups/SMEs
 
 
14.7
BRAND/PRODUCT COMPARISON


14.8
COMPANY VALUATION AND FINANCIAL METRICS


14.9
COMPETITIVE SCENARIO


14.9.1
DEALS


14.9.2
EXPANSIONS


14.9.3
OTHER DEVELOPMENTS
 
 
15
COMPANY PROFILES
In-depth Company Profiles of Leading Market Players with detailed Business Overview, Product and Service Portfolio, Recent Developments, and Unique Analyst Perspective (MnM View)


255
 
15.1
KEY PLAYERS


15.1.1
FLUORSID


15.1.1.1
Business overview


15.1.1.2
Products/Solutions/Services offered


15.1.1.3
Recent developments


15.1.1.4
MnM view


15.1.2
INDUSTRIES CHIMIQUES DU FLUOR


15.1.3
ALUFLUOR


15.1.4
GULF FLUOR


15.1.5
ALUFLUORIDE LIMITED


15.1.6
ORBIA FLUOR & ENERGY MATERIALS


15.1.7
PHOSAGRO GROUP


15.1.8
DO-FLUORIDE NEW MATERIALS CO., LTD.


15.1.9
HUNAN NONFERROUS FLUORIDE CHEMICAL GROUP CO., LTD.


15.1.10
AB LIFOSA


15.2
OTHER PLAYERS


15.2.1
SHANDONG HAIRUN NEW MATERIAL TECHNOLOGY CO., LTD.


15.2.2
HENAN JINHE INDUSTRY CO., LTD.


15.2.3
ELIXIRGROUP


15.2.4
HENAN WEILAI ALUMINUM (GROUP) CO., LTD


15.2.5
NAVIN FLUORINE INTERNATIONAL LIMITED


15.2.6
DERIVADOS DEL FLUOR


15.2.7
TANFAC INDUSTRIES LTD.


15.2.8
YINGKE NEW MATERIALS CO., LTD.


15.2.9
LICHE OPTO GROUP CO., LTD


15.2.10
JIAOZUO JINHONGLI ALUMINUM CO., LTD.


15.2.11
VRIK PHARMA


15.2.12
FOSHAN NANHAI SHUANGFU CHEMICAL CO., LTD


15.2.13
HENAN YELLOW RIVER NEW MATERIAL TECHNOLOGY CO., LTD.


15.2.14
PARTH INDUSTRIES


15.2.15
S B CHEMICALS
 
 
16
APPENDIX


293
 
16.1
DISCUSSION GUIDE


16.2
KNOWLEDGESTORE: MARKETSANDMARKETS’ SUBSCRIPTION PORTAL


16.3
CUSTOMIZATION OPTIONS


16.4
RELATED REPORTS


16.5
AUTHOR DETAILS


LIST OF TABLES


TABLE 1
AVERAGE SELLING PRICE OF ALUMINUM FLUORIDE, BY REGION, 2021–2024 (USD/KG)


TABLE 2
AVERAGE SELLING PRICE OF ALUMINUM FLUORIDE, BY GRADE, 2021–2024 (USD/KG)


TABLE 3
AVERAGE SELLING PRICE OF KEY PLAYERS FOR ALUMINUM FLUORIDE, BY GRADE (USD/KG), 2024


TABLE 4
ALUMINUM FLUORIDE MARKET: ROLE OF COMPANIES IN ECOSYSTEM


TABLE 5
ALUMINUM FLUORIDE MARKET: KEY TECHNOLOGIES


TABLE 6
ALUMINUM FLUORIDE MARKET: COMPLEMENTARY TECHNOLOGIES


TABLE 7
ALUMINUM FLUORIDE MARKET: ADJACENT TECHNOLOGIES


TABLE 8
ALUMINUM FLUORIDE MARKET: TOTAL NUMBER OF PATENTS


TABLE 9
ALUMINUM FLUORIDE MARKET: LIST OF MAJOR PATENT OWNERS


TABLE 10
ALUMINUM FLUORIDE MARKET: LIST OF MAJOR PATENTS, 2015–2024


TABLE 11
ALUMINUM FLUORIDE MARKET: LIST OF KEY CONFERENCES AND EVENTS, 2025–2026


TABLE 12
TARIFF RELATED TO ALUMINUM FLUORIDE MARKET


TABLE 13
NORTH AMERICA: REGULATORY BODIES, GOVERNMENT AGENCIES, AND OTHER ORGANIZATIONS


TABLE 14
EUROPE: REGULATORY BODIES, GOVERNMENT AGENCIES, AND OTHER ORGANIZATIONS


TABLE 15
ASIA PACIFIC: REGULATORY BODIES, GOVERNMENT AGENCIES, AND OTHER ORGANIZATIONS


TABLE 16
MIDDLE EAST & AFRICA: REGULATORY BODIES, GOVERNMENT AGENCIES, AND OTHER ORGANIZATIONS


TABLE 17
SOUTH AMERICA: LIST OF REGULATORY BODIES, GOVERNMENT AGENCIES, AND OTHER ORGANIZATIONS


TABLE 18
STANDARDS AND REGULATIONS FOR PLAYERS IN ALUMINUM FLUORIDE MARKET


TABLE 19
ALUMINUM FLUORIDE MARKET: PORTER’S FIVE FORCES ANALYSIS


TABLE 20
INFLUENCE OF STAKEHOLDERS ON BUYING PROCESS, BY END-USE INDUSTRY (%)


TABLE 21
KEY BUYING CRITERIA, BY END-USE INDUSTRY


TABLE 22
GDP TRENDS AND FORECASTS, BY KEY COUNTRY, 2023–2025 (USD MILLION)


TABLE 23
ALUMINUM FLUORIDE MARKET, BY GRADE, 2021–2024 (USD MILLION)


TABLE 24
ALUMINUM FLUORIDE MARKET, BY GRADE, 2025–2030 (USD MILLION)


TABLE 25
ALUMINUM FLUORIDE MARKET, BY GRADE, 2021–2024 (KILOTON)


TABLE 26
ALUMINUM FLUORIDE MARKET, BY GRADE, 2025–2030 (KILOTON)


TABLE 27
ALUMINUM FLUORIDE MARKET, BY PRODUCT TYPE, 2021–2024 (USD MILLION)


TABLE 28
ALUMINUM FLUORIDE MARKET, BY PRODUCT TYPE, 2025–2030 (USD MILLION)


TABLE 29
ALUMINUM FLUORIDE MARKET, BY PRODUCT TYPE, 2021–2024 (KILOTON)


TABLE 30
ALUMINUM FLUORIDE MARKET, BY PRODUCT TYPE, 2025–2030 (KILOTON)


TABLE 31
ALUMINUM FLUORIDE MARKET, BY FORM, 2021–2024 (USD MILLION)


TABLE 32
ALUMINUM FLUORIDE MARKET, BY FORM, 2025–2030 (USD MILLION)


TABLE 33
ALUMINUM FLUORIDE MARKET, BY FORM, 2021–2024 (KILOTON)


TABLE 34
ALUMINUM FLUORIDE MARKET, BY FORM, 2025–2030 (KILOTON)


TABLE 35
ALUMINUM FLUORIDE MARKET, BY BULK DENSITY, 2021–2024 (USD MILLION)


TABLE 36
ALUMINUM FLUORIDE MARKET, BY BULK DENSITY, 2025–2030 (USD MILLION)


TABLE 37
ALUMINUM FLUORIDE MARKET, BY BULK DENSITY, 2021–2024 (KILOTON)


TABLE 38
ALUMINUM FLUORIDE MARKET, BY BULK DENSITY, 2025–2030 (KILOTON)


TABLE 39
ALUMINUM FLUORIDE MARKET, BY APPLICATION, 2021–2024 (USD MILLION)


TABLE 40
ALUMINUM FLUORIDE MARKET, BY APPLICATION, 2025–2030 (USD MILLION)


TABLE 41
ALUMINUM FLUORIDE MARKET, BY APPLICATION, 2021–2024 (KILOTON)


TABLE 42
ALUMINUM FLUORIDE MARKET, BY APPLICATION, 2025–2030 (KILOTON)


TABLE 43
ALUMINUM FLUORIDE MARKET, BY END-USE INDUSTRY, 2021–2024 (USD MILLION)


TABLE 44
ALUMINUM FLUORIDE MARKET, BY END-USE INDUSTRY, 2025–2030 (USD MILLION)


TABLE 45
ALUMINUM FLUORIDE MARKET, BY END-USE INDUSTRY, 2021–2024 (KILOTON)


TABLE 46
ALUMINUM FLUORIDE MARKET, BY END-USE INDUSTRY, 2025–2030 (KILOTON)


TABLE 47
ALUMINUM FLUORIDE MARKET, BY REGION, 2021–2024 (USD MILLION)


TABLE 48
ALUMINUM FLUORIDE MARKET, BY REGION, 2025–2030 (USD MILLION)


TABLE 49
ALUMINUM FLUORIDE MARKET, BY REGION, 2021–2024 (KILOTON)


TABLE 50
ALUMINUM FLUORIDE MARKET, BY REGION, 2025–2030 (KILOTON)


TABLE 51
ASIA PACIFIC: ALUMINUM FLUORIDE MARKET, BY COUNTRY, 2021–2024 (USD MILLION)


TABLE 52
ASIA PACIFIC: ALUMINUM FLUORIDE MARKET, BY COUNTRY, 2025–2030 (USD MILLION)


TABLE 53
ASIA PACIFIC: ALUMINUM FLUORIDE MARKET, BY COUNTRY, 2021–2024 (KILOTON)


TABLE 54
ASIA PACIFIC: ALUMINUM FLUORIDE MARKET, BY COUNTRY, 2025–2030 (KILOTON)


TABLE 55
ASIA PACIFIC: ALUMINUM FLUORIDE MARKET, BY PRODUCT TYPE, 2021–2024 (USD MILLION)


TABLE 56
ASIA PACIFIC: ALUMINUM FLUORIDE MARKET, BY PRODUCT TYPE, 2025–2030 (USD MILLION)


TABLE 57
ASIA PACIFIC: ALUMINUM FLUORIDE MARKET, BY PRODUCT TYPE, 2021–2024 (KILOTON)


TABLE 58
ASIA PACIFIC: ALUMINUM FLUORIDE MARKET, BY PRODUCT TYPE, 2025–2030 (KILOTON)


TABLE 59
ASIA PACIFIC: ALUMINUM FLUORIDE MARKET, BY FORM, 2021–2024 (USD MILLION)


TABLE 60
ASIA PACIFIC: ALUMINUM FLUORIDE MARKET, BY FORM, 2025–2030 (USD MILLION)


TABLE 61
ASIA PACIFIC: ALUMINUM FLUORIDE MARKET, BY FORM, 2021–2024 (KILOTON)


TABLE 62
ASIA PACIFIC: ALUMINUM FLUORIDE MARKET, BY FORM, 2025–2030 (KILOTON)


TABLE 63
ASIA PACIFIC: ALUMINUM FLUORIDE MARKET, BY BULK DENSITY, 2021–2024 (USD MILLION)


TABLE 64
ASIA PACIFIC: ALUMINUM FLUORIDE MARKET, BY BULK DENSITY,2025–2030 (USD MILLION)


TABLE 65
ASIA PACIFIC: ALUMINUM FLUORIDE MARKET, BY BULK DENSITY, 2021–2024 (KILOTON)


TABLE 66
ASIA PACIFIC: ALUMINUM FLUORIDE MARKET, BY BULK DENSITY, 2025–2030 (KILOTON)


TABLE 67
ASIA PACIFIC: ALUMINUM FLUORIDE MARKET, BY GRADE, 2021–2024 (USD MILLION)


TABLE 68
ASIA PACIFIC: ALUMINUM FLUORIDE MARKET, BY GRADE, 2025–2030 (USD MILLION)


TABLE 69
ASIA PACIFIC: ALUMINUM FLUORIDE MARKET, BY GRADE, 2021–2024 (KILOTON)


TABLE 70
ASIA PACIFIC: ALUMINUM FLUORIDE MARKET, BY GRADE, 2025–2030 (KILOTON)


TABLE 71
ASIA PACIFIC: ALUMINUM FLUORIDE MARKET, BY APPLICATION, 2021–2024 (USD MILLION)


TABLE 72
ASIA PACIFIC: ALUMINUM FLUORIDE MARKET, BY APPLICATION, 2025–2030 (USD MILLION)


TABLE 73
ASIA PACIFIC: ALUMINUM FLUORIDE MARKET, BY APPLICATION, 2021–2024 (KILOTON)


TABLE 74
ASIA PACIFIC: ALUMINUM FLUORIDE MARKET, BY APPLICATION, 2025–2030 (KILOTON)


TABLE 75
ASIA PACIFIC: ALUMINUM FLUORIDE MARKET, BY END-USE INDUSTRY, 2021–2024 (USD MILLION)


TABLE 76
ASIA PACIFIC: ALUMINUM FLUORIDE MARKET, BY END-USE INDUSTRY, 2025–2030 (USD MILLION)


TABLE 77
ASIA PACIFIC: ALUMINUM FLUORIDE MARKET, BY END-USE INDUSTRY, 2021–2024 (KILOTON)


TABLE 78
ASIA PACIFIC: ALUMINUM FLUORIDE MARKET, BY END-USE INDUSTRY, 2025–2030 (KILOTON)


TABLE 79
CHINA: ALUMINUM FLUORIDE MARKET, BY END-USE INDUSTRY, 2021–2024 (USD MILLION)


TABLE 80
CHINA: ALUMINUM FLUORIDE MARKET, BY END-USE INDUSTRY, 2025–2030 (USD MILLION)


TABLE 81
CHINA: ALUMINUM FLUORIDE MARKET, BY END-USE INDUSTRY, 2021–2024 (KILOTON)


TABLE 82
CHINA: ALUMINUM FLUORIDE MARKET, BY END-USE INDUSTRY, 2025–2030 (KILOTON)


TABLE 83
JAPAN: ALUMINUM FLUORIDE MARKET, BY END-USE INDUSTRY, 2021–2024 (USD MILLION)


TABLE 84
JAPAN: ALUMINUM FLUORIDE MARKET, BY END-USE INDUSTRY, 2025–2030 (USD MILLION)


TABLE 85
JAPAN: ALUMINUM FLUORIDE MARKET, BY END-USE INDUSTRY, 2021–2024 (KILOTON)


TABLE 86
JAPAN: ALUMINUM FLUORIDE MARKET, BY END-USE INDUSTRY, 2025–2030 (KILOTON)


TABLE 87
INDIA: ALUMINUM FLUORIDE MARKET, BY END-USE INDUSTRY, 2021–2024 (USD MILLION)


TABLE 88
INDIA: ALUMINUM FLUORIDE MARKET, BY END-USE INDUSTRY, 2025–2030 (USD MILLION)


TABLE 89
INDIA: ALUMINUM FLUORIDE MARKET, BY END-USE INDUSTRY, 2021–2024 (KILOTON)


TABLE 90
INDIA: ALUMINUM FLUORIDE MARKET, BY END-USE INDUSTRY, 2025–2030 (KILOTON)


TABLE 91
SOUTH KOREA: ALUMINUM FLUORIDE MARKET, BY END-USE INDUSTRY, 2021–2024 (USD MILLION)


TABLE 92
SOUTH KOREA: ALUMINUM FLUORIDE MARKET, BY END-USE INDUSTRY, 2025–2030 (USD MILLION)


TABLE 93
SOUTH KOREA: ALUMINUM FLUORIDE MARKET, BY END-USE INDUSTRY, 2021–2024 (KILOTON)


TABLE 94
SOUTH KOREA: ALUMINUM FLUORIDE MARKET, BY END-USE INDUSTRY, 2025–2030 (KILOTON)


TABLE 95
REST OF ASIA PACIFIC: ALUMINUM FLUORIDE MARKET, BY END-USE INDUSTRY, 2021–2024 (USD MILLION)


TABLE 96
REST OF ASIA PACIFIC: ALUMINUM FLUORIDE MARKET, BY END-USE INDUSTRY, 2025–2030 (USD MILLION)


TABLE 97
REST OF ASIA PACIFIC: ALUMINUM FLUORIDE MARKET, BY END-USE INDUSTRY, 2021–2024 (KILOTON)


TABLE 98
REST OF ASIA PACIFIC: ALUMINUM FLUORIDE MARKET, BY END-USE INDUSTRY, 2025–2030 (KILOTON)


TABLE 99
NORTH AMERICA: ALUMINUM FLUORIDE MARKET, BY COUNTRY, 2021–2024 (USD MILLION)


TABLE 100
NORTH AMERICA: ALUMINUM FLUORIDE MARKET, BY COUNTRY, 2025–2030 (USD MILLION)


TABLE 101
NORTH AMERICA: ALUMINUM FLUORIDE MARKET, BY COUNTRY, 2021–2024 (KILOTON)


TABLE 102
NORTH AMERICA: ALUMINUM FLUORIDE MARKET, BY COUNTRY, 2025–2030 (KILOTON)


TABLE 103
NORTH AMERICA: ALUMINUM FLUORIDE MARKET, BY PRODUCT TYPE, 2021–2024 (USD MILLION)


TABLE 104
NORTH AMERICA: ALUMINUM FLUORIDE MARKET, BY PRODUCT TYPE, 2025–2030 (USD MILLION)


TABLE 105
NORTH AMERICA: ALUMINUM FLUORIDE MARKET, BY PRODUCT TYPE, 2021–2024 (KILOTON)


TABLE 106
NORTH AMERICA: ALUMINUM FLUORIDE MARKET, BY PRODUCT TYPE, 2025–2030 (KILOTON)


TABLE 107
NORTH AMERICA: ALUMINUM FLUORIDE MARKET, BY FORM, 2021–2024 (USD MILLION)


TABLE 108
NORTH AMERICA: ALUMINUM FLUORIDE MARKET, BY FORM, 2025–2030 (USD MILLION)


TABLE 109
NORTH AMERICA: ALUMINUM FLUORIDE MARKET, BY FORM, 2021–2024 (KILOTON)


TABLE 110
NORTH AMERICA: ALUMINUM FLUORIDE MARKET, BY FORM, 2025–2030 (KILOTON)


TABLE 111
NORTH AMERICA: ALUMINUM FLUORIDE MARKET, BY BULK DENSITY, 2021–2024 (USD MILLION)


TABLE 112
NORTH AMERICA: ALUMINUM FLUORIDE MARKET, BY BULK DENSITY, 2025–2030 (USD MILLION)


TABLE 113
NORTH AMERICA: ALUMINUM FLUORIDE MARKET, BY BULK DENSITY, 2021–2024 (KILOTON)


TABLE 114
NORTH AMERICA: ALUMINUM FLUORIDE MARKET, BY BULK DENSITY, 2025–2030 (KILOTON)


TABLE 115
NORTH AMERICA: ALUMINUM FLUORIDE MARKET, BY GRADE, 2021–2024 (USD MILLION)


TABLE 116
NORTH AMERICA: ALUMINUM FLUORIDE MARKET, BY GRADE, 2025–2030 (USD MILLION)


TABLE 117
NORTH AMERICA: ALUMINUM FLUORIDE MARKET, BY GRADE, 2021–2024 (KILOTON)


TABLE 118
NORTH AMERICA: ALUMINUM FLUORIDE MARKET, BY GRADE, 2025–2030 (KILOTON)


TABLE 119
NORTH AMERICA: ALUMINUM FLUORIDE MARKET, BY APPLICATION, 2021–2024 (USD MILLION)


TABLE 120
NORTH AMERICA: ALUMINUM FLUORIDE MARKET, BY APPLICATION, 2025–2030 (USD MILLION)


TABLE 121
NORTH AMERICA: ALUMINUM FLUORIDE MARKET, BY APPLICATION, 2021–2024 (KILOTON)


TABLE 122
NORTH AMERICA: ALUMINUM FLUORIDE MARKET, BY APPLICATION, 2025–2030 (KILOTON)


TABLE 123
NORTH AMERICA: ALUMINUM FLUORIDE MARKET, BY END-USE INDUSTRY, 2021–2024 (USD MILLION)


TABLE 124
NORTH AMERICA: ALUMINUM FLUORIDE MARKET, BY END-USE INDUSTRY, 2025–2030 (USD MILLION)


TABLE 125
NORTH AMERICA: ALUMINUM FLUORIDE MARKET, BY END-USE INDUSTRY, 2021–2024 (KILOTON)


TABLE 126
NORTH AMERICA: ALUMINUM FLUORIDE MARKET, BY END-USE INDUSTRY, 2025–2030 (KILOTON)


TABLE 127
US: ALUMINUM FLUORIDE MARKET, BY END-USE INDUSTRY, 2021–2024 (USD MILLION)


TABLE 128
US: ALUMINUM FLUORIDE MARKET, BY END-USE INDUSTRY, 2025–2030 (USD MILLION)


TABLE 129
US: ALUMINUM FLUORIDE MARKET, BY END-USE INDUSTRY, 2021–2024 (KILOTON)


TABLE 130
US: ALUMINUM FLUORIDE MARKET, BY END-USE INDUSTRY, 2025–2030 (KILOTON)


TABLE 131
CANADA: ALUMINUM FLUORIDE MARKET, BY END-USE INDUSTRY, 2021–2024 (USD MILLION)


TABLE 132
CANADA: ALUMINUM FLUORIDE MARKET, BY END-USE INDUSTRY, 2025–2030 (USD MILLION)


TABLE 133
CANADA: ALUMINUM FLUORIDE MARKET, BY END-USE INDUSTRY, 2021–2024 (KILOTON)


TABLE 134
CANADA: ALUMINUM FLUORIDE MARKET, BY END-USE INDUSTRY, 2025–2030 (KILOTON)


TABLE 135
MEXICO: ALUMINUM FLUORIDE MARKET, BY END-USE INDUSTRY, 2021–2024 (USD MILLION)


TABLE 136
MEXICO: ALUMINUM FLUORIDE MARKET, BY END-USE INDUSTRY, 2025–2030 (USD MILLION)


TABLE 137
MEXICO: ALUMINUM FLUORIDE MARKET, BY END-USE INDUSTRY, 2021–2024 (KILOTON)


TABLE 138
MEXICO: ALUMINUM FLUORIDE MARKET, BY END-USE INDUSTRY, 2025–2030 (KILOTON)


TABLE 139
EUROPE: ALUMINUM FLUORIDE MARKET, BY COUNTRY, 2021–2024 (USD MILLION)


TABLE 140
EUROPE: ALUMINUM FLUORIDE MARKET, BY COUNTRY, 2025–2030 (USD MILLION)


TABLE 141
EUROPE: ALUMINUM FLUORIDE MARKET, BY COUNTRY, 2021–2024 (KILOTON)


TABLE 142
EUROPE: ALUMINUM FLUORIDE MARKET, BY COUNTRY, 2025–2030 (KILOTON)


TABLE 143
EUROPE: ALUMINUM FLUORIDE MARKET, BY PRODUCT TYPE, 2021–2024 (USD MILLION)


TABLE 144
EUROPE: ALUMINUM FLUORIDE MARKET, BY PRODUCT TYPE, 2025–2030 (USD MILLION)


TABLE 145
EUROPE: ALUMINUM FLUORIDE MARKET, BY PRODUCT TYPE, 2021–2024 (KILOTON)


TABLE 146
EUROPE: ALUMINUM FLUORIDE MARKET, BY PRODUCT TYPE, 2025–2030 (KILOTON)


TABLE 147
EUROPE: ALUMINUM FLUORIDE MARKET, BY FORM, 2021–2024 (USD MILLION)


TABLE 148
EUROPE: ALUMINUM FLUORIDE MARKET, BY FORM, 2025–2030 (USD MILLION)


TABLE 149
EUROPE: ALUMINUM FLUORIDE MARKET, BY FORM, 2021–2024 (KILOTON)


TABLE 150
EUROPE: ALUMINUM FLUORIDE MARKET, BY FORM, 2025–2030 (KILOTON)


TABLE 151
EUROPE: ALUMINUM FLUORIDE MARKET, BY BULK DENSITY, 2021–2024 (USD MILLION)


TABLE 152
EUROPE: ALUMINUM FLUORIDE MARKET, BY BULK DENSITY, 2025–2030 (USD MILLION)


TABLE 153
EUROPE: ALUMINUM FLUORIDE MARKET, BY BULK DENSITY, 2021–2024 (KILOTON)


TABLE 154
EUROPE: ALUMINUM FLUORIDE MARKET, BY BULK DENSITY, 2025–2030 (KILOTON)


TABLE 155
EUROPE: ALUMINUM FLUORIDE MARKET, BY GRADE, 2021–2024 (USD MILLION)


TABLE 156
EUROPE: ALUMINUM FLUORIDE MARKET, BY GRADE, 2025–2030 (USD MILLION)


TABLE 157
EUROPE: ALUMINUM FLUORIDE MARKET, BY GRADE, 2021–2024 (KILOTON)


TABLE 158
EUROPE: ALUMINUM FLUORIDE MARKET, BY GRADE, 2025–2030 (KILOTON)


TABLE 159
EUROPE: ALUMINUM FLUORIDE MARKET, BY APPLICATION, 2021–2024 (USD MILLION)


TABLE 160
EUROPE: ALUMINUM FLUORIDE MARKET, BY APPLICATION, 2025–2030 (USD MILLION)


TABLE 161
EUROPE: ALUMINUM FLUORIDE MARKET, BY APPLICATION, 2021–2024 (KILOTON)


TABLE 162
EUROPE: ALUMINUM FLUORIDE MARKET, BY APPLICATION, 2025–2030 (KILOTON)


TABLE 163
EUROPE: ALUMINUM FLUORIDE MARKET, BY END-USE INDUSTRY, 2021–2024 (USD MILLION)


TABLE 164
EUROPE: ALUMINUM FLUORIDE MARKET, BY END-USE INDUSTRY, 2025–2030 (USD MILLION)


TABLE 165
EUROPE: ALUMINUM FLUORIDE MARKET, BY END-USE INDUSTRY, 2021–2024 (KILOTON)


TABLE 166
EUROPE: ALUMINUM FLUORIDE MARKET, BY END-USE INDUSTRY, 2025–2030 (KILOTON)


TABLE 167
GERMANY: ALUMINUM FLUORIDE MARKET, BY END-USE INDUSTRY, 2021–2024 (USD MILLION)


TABLE 168
GERMANY: ALUMINUM FLUORIDE MARKET, BY END-USE INDUSTRY, 2025–2030 (USD MILLION)


TABLE 169
GERMANY: ALUMINUM FLUORIDE MARKET, BY END-USE INDUSTRY, 2021–2024 (KILOTON)


TABLE 170
GERMANY: ALUMINUM FLUORIDE MARKET, BY END-USE INDUSTRY, 2025–2030 (KILOTON)


TABLE 171
ITALY: ALUMINUM FLUORIDE MARKET, BY END-USE INDUSTRY, 2021–2024 (USD MILLION)


TABLE 172
ITALY: ALUMINUM FLUORIDE MARKET, BY END-USE INDUSTRY, 2025–2030 (USD MILLION)


TABLE 173
ITALY: ALUMINUM FLUORIDE MARKET, BY END-USE INDUSTRY, 2021–2024 (KILOTON)


TABLE 174
ITALY: ALUMINUM FLUORIDE MARKET, BY END-USE INDUSTRY, 2025–2030 (KILOTON)


TABLE 175
FRANCE: ALUMINUM FLUORIDE MARKET, BY END-USE INDUSTRY, 2021–2024 (USD MILLION)


TABLE 176
FRANCE: ALUMINUM FLUORIDE MARKET, BY END-USE INDUSTRY, 2025–2030 (USD MILLION)


TABLE 177
FRANCE: ALUMINUM FLUORIDE MARKET, BY END-USE INDUSTRY, 2021–2024 (KILOTON)


TABLE 178
FRANCE: ALUMINUM FLUORIDE MARKET, BY END-USE INDUSTRY, 2025–2030 (KILOTON)


TABLE 179
UK: ALUMINUM FLUORIDE MARKET, BY END-USE INDUSTRY, 2021–2024 (USD MILLION)


TABLE 180
UK: ALUMINUM FLUORIDE MARKET, BY END-USE INDUSTRY, 2025–2030 (USD MILLION)


TABLE 181
UK: ALUMINUM FLUORIDE MARKET, BY END-USE INDUSTRY, 2021–2024 (KILOTON)


TABLE 182
UK: ALUMINUM FLUORIDE MARKET, BY END-USE INDUSTRY, 2025–2030 (KILOTON)


TABLE 183
SPAIN: ALUMINUM FLUORIDE MARKET, BY END-USE INDUSTRY, 2021–2024 (USD MILLION)


TABLE 184
SPAIN: ALUMINUM FLUORIDE MARKET, BY END-USE INDUSTRY, 2025–2030 (USD MILLION)


TABLE 185
SPAIN: ALUMINUM FLUORIDE MARKET, BY END-USE INDUSTRY, 2021–2024 (KILOTON)


TABLE 186
SPAIN: ALUMINUM FLUORIDE MARKET, BY END-USE INDUSTRY, 2025–2030 (KILOTON)


TABLE 187
RUSSIA: ALUMINUM FLUORIDE MARKET, BY END-USE INDUSTRY, 2021–2024 (USD MILLION)


TABLE 188
RUSSIA: ALUMINUM FLUORIDE MARKET, BY END-USE INDUSTRY, 2025–2030 (USD MILLION)


TABLE 189
RUSSIA: ALUMINUM FLUORIDE MARKET, BY END-USE INDUSTRY, 2021–2024 (KILOTON)


TABLE 190
RUSSIA: ALUMINUM FLUORIDE MARKET, BY END-USE INDUSTRY, 2025–2030 (KILOTON)


TABLE 191
REST OF EUROPE: ALUMINUM FLUORIDE MARKET, BY END-USE INDUSTRY, 2021–2024 (USD MILLION)


TABLE 192
REST OF EUROPE: ALUMINUM FLUORIDE MARKET, BY END-USE INDUSTRY, 2025–2030 (USD MILLION)


TABLE 193
REST OF EUROPE: ALUMINUM FLUORIDE MARKET, BY END-USE INDUSTRY, 2021–2024 (KILOTON)


TABLE 194
REST OF EUROPE: ALUMINUM FLUORIDE MARKET, BY END-USE INDUSTRY, 2025–2030 (KILOTON)


TABLE 195
MIDDLE EAST & AFRICA: ALUMINUM FLUORIDE MARKET, BY COUNTRY, 2021–2024 (USD MILLION)


TABLE 196
MIDDLE EAST & AFRICA: ALUMINUM FLUORIDE MARKET, BY COUNTRY, 2025–2030 (USD MILLION)


TABLE 197
MIDDLE EAST & AFRICA: ALUMINUM FLUORIDE MARKET, BY COUNTRY, 2021–2024 (KILOTON)


TABLE 198
MIDDLE EAST & AFRICA: ALUMINUM FLUORIDE MARKET, BY COUNTRY, 2025–2030 (KILOTON)


TABLE 199
MIDDLE EAST & AFRICA: ALUMINUM FLUORIDE MARKET, BY PRODUCT TYPE, 2021–2024 (USD MILLION)


TABLE 200
MIDDLE EAST & AFRICA: ALUMINUM FLUORIDE MARKET, BY PRODUCT TYPE, 2025–2030 (USD MILLION)


TABLE 201
MIDDLE EAST & AFRICA: ALUMINUM FLUORIDE MARKET, BY PRODUCT TYPE, 2021–2024 (KILOTON)


TABLE 202
MIDDLE EAST & AFRICA: ALUMINUM FLUORIDE MARKET, BY PRODUCT TYPE, 2025–2030 (KILOTON)


TABLE 203
MIDDLE EAST & AFRICA: ALUMINUM FLUORIDE MARKET, BY FORM, 2021–2024 (USD MILLION)


TABLE 204
MIDDLE EAST & AFRICA: ALUMINUM FLUORIDE MARKET, BY FORM, 2025–2030 (USD MILLION)


TABLE 205
MIDDLE EAST & AFRICA: ALUMINUM FLUORIDE MARKET, BY FORM, 2021–2024 (KILOTON)


TABLE 206
MIDDLE EAST & AFRICA: ALUMINUM FLUORIDE MARKET, BY FORM, 2025–2030 (KILOTON)


TABLE 207
MIDDLE EAST & AFRICA: ALUMINUM FLUORIDE MARKET, BY BULK DENSITY, 2021–2024 (USD MILLION)


TABLE 208
MIDDLE EAST & AFRICA: ALUMINUM FLUORIDE MARKET, BY BULK DENSITY, 2025–2030 (USD MILLION)


TABLE 209
MIDDLE EAST & AFRICA: ALUMINUM FLUORIDE MARKET, BY BULK DENSITY, 2021–2024 (KILOTON)


TABLE 210
MIDDLE EAST & AFRICA: ALUMINUM FLUORIDE MARKET, BY BULK DENSITY, 2025–2030 (KILOTON)


TABLE 211
MIDDLE EAST & AFRICA: ALUMINUM FLUORIDE MARKET, BY GRADE, 2021–2024 (USD MILLION)


TABLE 212
MIDDLE EAST & AFRICA: ALUMINUM FLUORIDE MARKET, BY GRADE, 2025–2030 (USD MILLION)


TABLE 213
MIDDLE EAST & AFRICA: ALUMINUM FLUORIDE MARKET, BY GRADE, 2021–2024 (KILOTON)


TABLE 214
MIDDLE EAST & AFRICA: ALUMINUM FLUORIDE MARKET, BY GRADE, 2025–2030 (KILOTON)


TABLE 215
MIDDLE EAST & AFRICA: ALUMINUM FLUORIDE MARKET, BY APPLICATION, 2021–2024 (USD MILLION)


TABLE 216
MIDDLE EAST & AFRICA: ALUMINUM FLUORIDE MARKET, BY APPLICATION, 2025–2030 (USD MILLION)


TABLE 217
MIDDLE EAST & AFRICA: ALUMINUM FLUORIDE MARKET, BY APPLICATION, 2021–2024 (KILOTON)


TABLE 218
MIDDLE EAST & AFRICA: ALUMINUM FLUORIDE MARKET, BY APPLICATION, 2025–2030 (KILOTON)


TABLE 219
MIDDLE EAST & AFRICA: ALUMINUM FLUORIDE MARKET, BY END-USE INDUSTRY, 2021–2024 (USD MILLION)


TABLE 220
MIDDLE EAST & AFRICA: ALUMINUM FLUORIDE MARKET, BY END-USE INDUSTRY, 2025–2030 (USD MILLION)


TABLE 221
MIDDLE EAST & AFRICA: ALUMINUM FLUORIDE MARKET, BY END-USE INDUSTRY, 2021–2024 (KILOTON)


TABLE 222
MIDDLE EAST & AFRICA: ALUMINUM FLUORIDE MARKET, BY END-USE INDUSTRY, 2025–2030 (KILOTON)


TABLE 223
SAUDI ARABIA: ALUMINUM FLUORIDE MARKET, BY END-USE INDUSTRY, 2021–2024 (USD MILLION)


TABLE 224
SAUDI ARABIA ALUMINUM FLUORIDE MARKET, BY END-USE INDUSTRY, 2025–2030 (USD MILLION)


TABLE 225
SAUDI ARABIA: ALUMINUM FLUORIDE MARKET, BY END-USE INDUSTRY, 2021–2024 (KILOTON)


TABLE 226
SAUDI ARABIA: ALUMINUM FLUORIDE MARKET, BY END-USE INDUSTRY, 2025–2030 (KILOTON)


TABLE 227
UAE: ALUMINUM FLUORIDE MARKET, BY END-USE INDUSTRY, 2021–2024 (USD MILLION)


TABLE 228
UAE: ALUMINUM FLUORIDE MARKET, BY END-USE INDUSTRY, 2025–2030 (USD MILLION)


TABLE 229
UAE: ALUMINUM FLUORIDE MARKET, BY END-USE INDUSTRY, 2021–2024 (KILOTON)


TABLE 230
UAE: ALUMINUM FLUORIDE MARKET, BY END-USE INDUSTRY, 2025–2030 (KILOTON)


TABLE 231
REST OF GCC COUNTRIES: ALUMINUM FLUORIDE MARKET, BY END-USE INDUSTRY, 2021–2024 (USD MILLION)


TABLE 232
REST OF GCC COUNTRIES: ALUMINUM FLUORIDE MARKET, BY END-USE INDUSTRY, 2025–2030 (USD MILLION)


TABLE 233
REST OF GCC COUNTRIES: ALUMINUM FLUORIDE MARKET, BY END-USE INDUSTRY, 2021–2024 (KILOTON)


TABLE 234
REST OF GCC COUNTRIES: ALUMINUM FLUORIDE MARKET, BY END-USE INDUSTRY, 2025–2030 (KILOTON)


TABLE 235
SOUTH AFRICA: ALUMINUM FLUORIDE MARKET, BY END-USE INDUSTRY, 2021–2024 (USD MILLION)


TABLE 236
SOUTH AFRICA: ALUMINUM FLUORIDE MARKET, BY END-USE INDUSTRY, 2025–2030 (USD MILLION)


TABLE 237
SOUTH AFRICA: ALUMINUM FLUORIDE MARKET, BY END-USE INDUSTRY, 2021–2024 (KILOTON)


TABLE 238
SOUTH AFRICA: ALUMINUM FLUORIDE MARKET, BY END-USE INDUSTRY, 2025–2030 (KILOTON)


TABLE 239
REST OF MIDDLE EAST & AFRICA: ALUMINUM FLUORIDE MARKET, BY END-USE INDUSTRY, 2021–2024 (USD MILLION)


TABLE 240
REST OF MIDDLE EAST & AFRICA: ALUMINUM FLUORIDE MARKET, BY END-USE INDUSTRY, 2025–2030 (USD MILLION)


TABLE 241
REST OF MIDDLE EAST & AFRICA: ALUMINUM FLUORIDE MARKET, BY END-USE INDUSTRY, 2021–2024 (KILOTON)


TABLE 242
REST OF MIDDLE EAST & AFRICA: ALUMINUM FLUORIDE MARKET, BY END-USE INDUSTRY, 2025–2030 (KILOTON)


TABLE 243
SOUTH AMERICA: ALUMINUM FLUORIDE MARKET, BY COUNTRY, 2021–2024 (USD MILLION)


TABLE 244
SOUTH AMERICA: ALUMINUM FLUORIDE MARKET, BY COUNTRY, 2025–2030 (USD MILLION)


TABLE 245
SOUTH AMERICA: ALUMINUM FLUORIDE MARKET, BY COUNTRY, 2021–2024 (KILOTON)


TABLE 246
SOUTH AMERICA: ALUMINUM FLUORIDE MARKET, BY COUNTRY, 2025–2030 (KILOTON)


TABLE 247
SOUTH AMERICA: ALUMINUM FLUORIDE MARKET, BY PRODUCT TYPE, 2021–2024 (USD MILLION)


TABLE 248
SOUTH AMERICA: ALUMINUM FLUORIDE MARKET, BY PRODUCT TYPE, 2025–2030 (USD MILLION)


TABLE 249
SOUTH AMERICA: ALUMINUM FLUORIDE MARKET, BY PRODUCT TYPE, 2021–2024 (KILOTON)


TABLE 250
SOUTH AMERICA: ALUMINUM FLUORIDE MARKET, BY PRODUCT TYPE, 2025–2030 (KILOTON)


TABLE 251
SOUTH AMERICA: ALUMINUM FLUORIDE MARKET, BY FORM, 2021–2024 (USD MILLION)


TABLE 252
SOUTH AMERICA: ALUMINUM FLUORIDE MARKET, BY FORM, 2025–2030 (USD MILLION)


TABLE 253
SOUTH AMERICA: ALUMINUM FLUORIDE MARKET, BY FORM, 2021–2024 (KILOTON)


TABLE 254
SOUTH AMERICA: ALUMINUM FLUORIDE MARKET, BY FORM, 2025–2030 (KILOTON)


TABLE 255
SOUTH AMERICA: ALUMINUM FLUORIDE MARKET, BY BULK DENSITY, 2021–2024 (USD MILLION)


TABLE 256
SOUTH AMERICA: ALUMINUM FLUORIDE MARKET, BY BULK DENSITY, 2025–2030 (USD MILLION)


TABLE 257
SOUTH AMERICA: ALUMINUM FLUORIDE MARKET, BY BULK DENSITY, 2021–2024 (KILOTON)


TABLE 258
SOUTH AMERICA: ALUMINUM FLUORIDE MARKET, BY BULK DENSITY, 2025–2030 (KILOTON)


TABLE 259
SOUTH AMERICA: ALUMINUM FLUORIDE MARKET, BY GRADE, 2021–2024 (USD MILLION)


TABLE 260
SOUTH AMERICA: ALUMINUM FLUORIDE MARKET, BY GRADE, 2025–2030 (USD MILLION)


TABLE 261
SOUTH AMERICA: ALUMINUM FLUORIDE MARKET, BY GRADE, 2021–2024 (KILOTON)


TABLE 262
SOUTH AMERICA: ALUMINUM FLUORIDE MARKET, BY GRADE, 2025–2030 (KILOTON)


TABLE 263
SOUTH AMERICA: ALUMINUM FLUORIDE MARKET, BY APPLICATION, 2021–2024 (USD MILLION)


TABLE 264
SOUTH AMERICA: ALUMINUM FLUORIDE MARKET, BY APPLICATION, 2025–2030 (USD MILLION)


TABLE 265
SOUTH AMERICA: ALUMINUM FLUORIDE MARKET, BY APPLICATION, 2021–2024 (KILOTON)


TABLE 266
SOUTH AMERICA: ALUMINUM FLUORIDE MARKET, BY APPLICATION, 2025–2030 (KILOTON)


TABLE 267
SOUTH AMERICA: ALUMINUM FLUORIDE MARKET, BY END-USE INDUSTRY, 2021–2024 (USD MILLION)


TABLE 268
SOUTH AMERICA: ALUMINUM FLUORIDE MARKET, BY END-USE INDUSTRY, 2025–2030 (USD MILLION)


TABLE 269
SOUTH AMERICA: ALUMINUM FLUORIDE MARKET, BY END-USE INDUSTRY, 2021–2024 (KILOTON)


TABLE 270
SOUTH AMERICA: ALUMINUM FLUORIDE MARKET, BY END-USE INDUSTRY, 2025–2030 (KILOTON)


TABLE 271
ARGENTINA: ALUMINUM FLUORIDE MARKET, BY END-USE INDUSTRY, 2021–2024 (USD MILLION)


TABLE 272
ARGENTINA: ALUMINUM FLUORIDE MARKET, BY END-USE INDUSTRY, 2025–2030 (USD MILLION)


TABLE 273
ARGENTINA: ALUMINUM FLUORIDE MARKET, BY END-USE INDUSTRY, 2021–2024 (KILOTON)


TABLE 274
ARGENTINA: ALUMINUM FLUORIDE MARKET, BY END-USE INDUSTRY, 2025–2030 (KILOTON)


TABLE 275
BRAZIL: ALUMINUM FLUORIDE MARKET, BY END-USE INDUSTRY, 2021–2024 (USD MILLION)


TABLE 276
BRAZIL: ALUMINUM FLUORIDE MARKET, BY END-USE INDUSTRY, 2025–2030 (USD MILLION)


TABLE 277
BRAZIL: ALUMINUM FLUORIDE MARKET, BY END-USE INDUSTRY, 2021–2024 (KILOTON)


TABLE 278
BRAZIL: ALUMINUM FLUORIDE MARKET, BY END-USE INDUSTRY, 2025–2030 (KILOTON)


TABLE 279
REST OF SOUTH AMERICA: ALUMINUM FLUORIDE MARKET, BY END-USE INDUSTRY, 2021–2024 (USD MILLION)


TABLE 280
REST OF SOUTH AMERICA: ALUMINUM FLUORIDE MARKET, BY END-USE INDUSTRY, 2025–2030 (USD MILLION)


TABLE 281
REST OF SOUTH AMERICA: ALUMINUM FLUORIDE MARKET, BY END-USE INDUSTRY, 2021–2024 (KILOTON)


TABLE 282
REST OF SOUTH AMERICA: ALUMINUM FLUORIDE MARKET, BY END-USE INDUSTRY, 2025–2030 (KILOTON)


TABLE 283
ALUMINUM FLUORIDE MARKET: OVERVIEW OF STRATEGIES ADOPTED BY KEY PLAYERS


TABLE 284
ALUMINUM FLUORIDE MARKET: DEGREE OF COMPETITION, 2024


TABLE 285
ALUMINUM FLUORIDE MARKET: REGION FOOTPRINT


TABLE 286
ALUMINUM FLUORIDE MARKET: FORM FOOTPRINT


TABLE 287
ALUMINUM FLUORIDE MARKET: GRADE FOOTPRINT


TABLE 288
ALUMINUM FLUORIDE MARKET: END-USE INDUSTRY FOOTPRINT


TABLE 289
ALUMINUM FLUORIDE MARKET: DETAILED LIST OF KEY STARTUPS/SMES


TABLE 290
ALUMINUM FLUORIDE MARKET: COMPETITIVE BENCHMARKING OF KEY STARTUPS/SMES (1/2)


TABLE 291
ALUMINUM FLUORIDE MARKET: COMPETITIVE BENCHMARKING OF KEY STARTUPS/SMES (2/2)


TABLE 292
ALUMINUM FLUORIDE MARKET: DEALS, JANUARY 2021−JULY 2025


TABLE 293
ALUMINUM FLUORIDE MARKET: EXPANSIONS, JANUARY 2021− JULY 2025


TABLE 294
ALUMINUM FLUORIDE MARKET: OTHER DEVELOPMENTS, JANUARY 2021− JULY 2025


TABLE 295
FLUORSID: COMPANY OVERVIEW


TABLE 296
FLUORSID: PRODUCTS/SOLUTIONS/SERVICES OFFERED


TABLE 297
FLUORSID: DEALS


TABLE 298
INDUSTRIES CHIMIQUES DU FLUOR: COMPANY OVERVIEW


TABLE 299
INDUSTRIES CHIMIQUES DU FLUOR: PRODUCTS/SOLUTIONS/SERVICES OFFERED


TABLE 300
ALUFLUOR: COMPANY OVERVIEW


TABLE 301
ALUFLUOR: PRODUCTS/SOLUTIONS/SERVICES OFFERED


TABLE 302
GULF FLUOR: COMPANY OVERVIEW


TABLE 303
GULF FLUOR: PRODUCTS/SOLUTIONS/SERVICES OFFERED


TABLE 304
ALUFLUORIDE LIMITED: COMPANY OVERVIEW


TABLE 305
ALUFLUORIDE LIMITED: PRODUCTS/SOLUTIONS/SERVICES OFFERED


TABLE 306
ALUFLUORIDE LIMITED: EXPANSIONS


TABLE 307
ORBIA FLUOR & ENERGY MATERIALS: COMPANY OVERVIEW


TABLE 308
ORBIA FLUOR & ENERGY MATERIALS: PRODUCTS/SOLUTIONS/SERVICES OFFERED


TABLE 309
ORBIA FLUOR & ENERGY MATERIALS: OTHER DEVELOPMENTS


TABLE 310
PHOSAGRO GROUP: COMPANY OVERVIEW


TABLE 311
PHOSAGRO GROUP: PRODUCTS/SOLUTIONS/SERVICES OFFERED


TABLE 312
PHOSAGRO GROUP: DEALS


TABLE 313
PHOSAGRO GROUP: EXPANSIONS


TABLE 314
DO-FLUORIDE NEW MATERIALS CO., LTD.: COMPANY OVERVIEW


TABLE 315
DO-FLUORIDE NEW MATERIALS CO., LTD.: PRODUCTS/SOLUTIONS/SERVICES OFFERED


TABLE 316
HUNAN NONFERROUS FLUORIDE CHEMICAL GROUP CO., LTD.: COMPANY OVERVIEW


TABLE 317
HUNAN NONFERROUS FLUORIDE CHEMICAL GROUP CO., LTD.: PRODUCTS/SOLUTIONS/SERVICES OFFERED


TABLE 318
AB LIFOSA: COMPANY OVERVIEW


TABLE 319
AB LIFOSA: PRODUCTS/SOLUTIONS/SERVICES OFFERED


TABLE 320
AB LIFOSA: OTHER DEVELOPMENTS


TABLE 321
SHANDONG HAIRUN NEW MATERIAL TECHNOLOGY CO., LTD.: COMPANY OVERVIEW


TABLE 322
HENAN JINHE INDUSTRY CO., LTD.: COMPANY OVERVIEW


TABLE 323
ELIXIRGROUP: COMPANY OVERVIEW


TABLE 324
HENAN WEILAI ALUMINUM (GROUP) CO., LTD: COMPANY OVERVIEW


TABLE 325
NAVIN FLUORINE INTERNATIONAL LIMITED: COMPANY OVERVIEW


TABLE 326
DERIVADOS DEL FLUOR: COMPANY OVERVIEW


TABLE 327
TANFAC INDUSTRIES LTD.: COMPANY OVERVIEW


TABLE 328
YINGKE NEW MATERIALS CO., LTD.: COMPANY OVERVIEW


TABLE 329
LICHE OPTO GROUP CO., LTD: COMPANY OVERVIEW


TABLE 330
JIAOZUO JINHONGLI ALUMINUM CO., LTD.: COMPANY OVERVIEW


TABLE 331
VRIK PHARMA: COMPANY OVERVIEW


TABLE 332
FOSHAN NANHAI SHUANGFU CHEMICAL CO., LTD: COMPANY OVERVIEW


TABLE 333
HENAN YELLOW RIVER NEW MATERIAL TECHNOLOGY CO., LTD.: COMPANY OVERVIEW


TABLE 334
PARTH INDUSTRIES: COMPANY OVERVIEW


TABLE 335
S B CHEMICALS: COMPANY OVERVIEW


LIST OF FIGURES


FIGURE 1
ALUMINUM FLUORIDE MARKET SEGMENTATION AND REGIONAL SCOPE


FIGURE 2
ALUMINUM FLUORIDE MARKET: RESEARCH DESIGN


FIGURE 3
MARKET SIZE ESTIMATION METHODOLOGY: SUPPLY-SIDE APPROACH


FIGURE 4
MARKET SIZE ESTIMATION METHODOLOGY: DEMAND-SIDE APPROACH


FIGURE 5
MARKET SIZE ESTIMATION METHODOLOGY: REVENUE OF MARKET PLAYERS


FIGURE 6
MARKET SIZE ESTIMATION METHODOLOGY: BOTTOM-UP APPROACH


FIGURE 7
MARKET SIZE ESTIMATION METHODOLOGY: TOP-DOWN APPROACH


FIGURE 8
ALUMINUM FLUORIDE MARKET: DATA TRIANGULATION


FIGURE 9
ANHYDROUS PRODUCT TYPE SEGMENT TO DOMINATE MARKET IN 2025


FIGURE 10
HIGH-BULK DENSITY SEGMENT TO DOMINATE MARKET IN 2025


FIGURE 11
POWDER FORM SEGMENT TO DOMINATE MARKET IN 2025


FIGURE 12
SMELTER GRADE SEGMENT TO DOMINATE MARKET IN 2025


FIGURE 13
ELECTROLYTE ADDITIVE APPLICATION SEGMENT TO DOMINATE MARKET IN 2025


FIGURE 14
ALUMINUM INDUSTRY SEGMENT TO DOMINATE MARKET IN 2025


FIGURE 15
ASIA PACIFIC TO REGISTER HIGHEST CAGR DURING FORECAST PERIOD


FIGURE 16
RISING DEMAND FOR LIGHTWEIGHT MATERIALS IN AUTOMOTIVE, CONSTRUCTION, AND AEROSPACE INDUSTRIES TO DRIVE MARKET


FIGURE 17
ANHYDROUS SEGMENT TO REGISTER HIGHEST CAGR DURING FORECAST PERIOD


FIGURE 18
HIGH-BULK DENSITY SEGMENT TO REGISTER HIGHEST CAGR DURING FORECAST PERIOD


FIGURE 19
POWDER SEGMENT TO REGISTER HIGHEST CAGR DURING FORECAST PERIOD


FIGURE 20
SMELTER GRADE SEGMENT TO REGISTER HIGHEST CAGR DURING FORECAST PERIOD


FIGURE 21
ELECTROLYTE ADDITIVE SEGMENT TO REGISTER HIGHEST CAGR DURING FORECAST PERIOD


FIGURE 22
ALUMINUM INDUSTRY SEGMENT TO REGISTER HIGHEST CAGR DURING FORECAST PERIOD


FIGURE 23
CHINA TO BE FASTEST-GROWING MARKET DURING FORECAST PERIOD


FIGURE 24
ALUMINUM FLUORIDE MARKET: DRIVERS, RESTRAINTS, OPPORTUNITIES, AND CHALLENGES


FIGURE 25
USE OF GENERATIVE AI IN ALUMINUM FLUORIDE MARKET


FIGURE 26
TRENDS/DISRUPTIONS INFLUENCING CUSTOMER BUSINESS


FIGURE 27
ALUMINUM FLUORIDE MARKET: SUPPLY CHAIN ANALYSIS


FIGURE 28
ALUMINUM FLUORIDE MARKET: INVESTMENT AND FUNDING SCENARIO, 2023 VS. 2024 (USD MILLION)


FIGURE 29
AVERAGE SELLING PRICE OF ALUMINUM FLUORIDE, BY REGION, 2021–2024 (USD/KG)


FIGURE 30
AVERAGE SELLING PRICE OF KEY PLAYERS FOR ALUMINUM FLUORIDE, BY GRADE, 2024 (USD/KG)


FIGURE 31
ALUMINUM FLUORIDE MARKET: ECOSYSTEM


FIGURE 32
PATENTS GRANTED, 2015−2024


FIGURE 33
ALUMINUM FLUORIDE MARKET: LEGAL STATUS OF PATENTS, 2015–2024


FIGURE 34
PATENTS ANALYSIS FOR ALUMINUM FLUORIDE, BY JURISDICTION, 2015−2024


FIGURE 35
TOP 10 COMPANIES WITH HIGHEST NUMBER OF PATENTS IN LAST 10 YEARS


FIGURE 36
IMPORT DATA FOR HS CODE 282612-COMPLIANT PRODUCTS, BY COUNTRY, 2021–2024 (USD THOUSAND)


FIGURE 37
EXPORT DATA FOR HS CODE 282612-COMPLIANT PRODUCTS, BY COUNTRY, 2021–2024 (USD THOUSAND)


FIGURE 38
ALUMINUM FLUORIDE MARKET: PORTER’S FIVE FORCES ANALYSIS


FIGURE 39
INFLUENCE OF STAKEHOLDERS ON BUYING PROCESS, BY END-USE INDUSTRY


FIGURE 40
KEY BUYING CRITERIA, BY END-USE INDUSTRY


FIGURE 41
SMELTER GRADE SEGMENT TO LEAD MARKET DURING FORECAST PERIOD


FIGURE 42
ANHYDROUS SEGMENT WILL DOMINATE MARKET IN 2030


FIGURE 43
POWDER SEGMENT TO REGISTER FASTEST GROWTH DURING FORECAST PERIOD


FIGURE 44
HIGH-BULK DENSITY SEGMENT TO DOMINATE MARKET DURING FORECAST PERIOD


FIGURE 45
ELECTROLYTE ADDITIVE SEGMENT TO LEAD MARKET DURING FORECAST PERIOD


FIGURE 46
ALUMINUM END-USE INDUSTRY SEGMENT TO LEAD MARKET DURING FORECAST PERIOD


FIGURE 47
ASIA PACIFIC TO BE FASTEST-GROWING MARKET DURING FORECAST PERIOD


FIGURE 48
ASIA PACIFIC: ALUMINUM FLUORIDE MARKET SNAPSHOT


FIGURE 49
NORTH AMERICA: ALUMINUM FLUORIDE MARKET SNAPSHOT


FIGURE 50
EUROPE: ALUMINUM FLUORIDE MARKET SNAPSHOT


FIGURE 51
ALUMINUM FLUORIDE MARKET SHARE ANALYSIS, 2024


FIGURE 52
ALUMINUM FLUORIDE MARKET: REVENUE ANALYSIS OF KEY PLAYERS, 2021–2024 (USD BILLION)


FIGURE 53
ALUMINUM FLUORIDE MARKET: COMPANY EVALUATION MATRIX (KEY PLAYERS), 2024


FIGURE 54
ALUMINUM FLUORIDE MARKET: COMPANY FOOTPRINT


FIGURE 55
ALUMINUM FLUORIDE MARKET: COMPANY EVALUATION MATRIX (STARTUPS/SMES), 2024


FIGURE 56
ALUMINUM FLUORIDE MARKET: BRAND/PRODUCT COMPARATIVE ANALYSIS


FIGURE 57
ALUMINUM FLUORIDE MARKET: EV/EBITDA OF KEY COMPANIES, 2025


FIGURE 58
ALUMINUM FLUORIDE MARKET: YEAR-TO-DATE (YTD) PRICE TOTAL RETURN, 2025


FIGURE 59
INDUSTRIES CHIMIQUES DU FLUOR: COMPANY SNAPSHOT


FIGURE 60
ALUFLUORIDE LIMITED: COMPANY SNAPSHOT


FIGURE 61
PHOSAGRO GROUP: COMPANY SNAPSHOT


FIGURE 62
DO-FLUORIDE NEW MATERIALS CO., LTD.: COMPANY SNAPSHOT


Methodology

The study involved four main activities to estimate the aluminum fluoride (AlF3) market size. Extensive secondary research was conducted to gather information on the market, related markets, and the parent market. The next step was to validate these findings, assumptions, and size estimates with industry experts across the value chain through primary research. Both top-down and bottom-up approaches were used to determine the total market size. Later, market breakdown and data triangulation methods were employed to estimate the sizes of segments and subsegments.

Secondary Research

Various sources were consulted during the secondary research process to gather information for this study. These sources include annual reports, press releases, investor presentations of companies, white papers, certified publications, trade directories, articles from recognized authors, reputable websites, and databases. Secondary research was used to obtain key details about the industry’s value chain, monetary chain, market classification, and segmentation based on industry trends down to the most specific level, and regional markets. It also helped gather information about major developments from a market-oriented perspective.

Primary Research

The aluminum fluoride (AlF3) market includes several stakeholders in the supply chain, such as raw material suppliers, manufacturers, and end users. Various key sources from both the supply and demand sides of the aluminum fluoride (AlF3) market have been interviewed to gather qualitative and quantitative data. On the demand side, primary interviewees include influential leaders in end-use industries. On the supply side, primary sources consist of manufacturers, associations, and institutions involved in the AlF3 industry.

Primary interviews were conducted to gather insights such as market statistics, revenue data from products and services, market breakdowns, market size estimates, market forecasts, and data triangulation. Primary research also helped understand various product types, forms, grades, bulk densities, applications, end-use industries, and regional trends. Stakeholders from the demand side, including CIOs, CTOs, and CSOs, were interviewed to understand the buyers’ perspectives on suppliers, products, component providers, and their current use of AlF3, as well as the future outlook of their business, which will influence the overall market.

The breakdown of profiles of the primary interviewees is illustrated in the figure below:

Aluminum Fluoride (ALF3) Market

Note: Tier 1, Tier 2, and Tier 3 companies are classified based on their market revenue in 2024, available in the public domain, product portfolios, and geographical presence.

Other designations include sales representatives, production heads, and technicians.

To know about the assumptions considered for the study, download the pdf brochure

Market Size Estimation

The top-down approach was used to estimate and validate the size of various submarkets of the AlF3 market for each region. The research methodology used to estimate the market size included the following steps:

  • The key players in the industry have been identified through extensive secondary research.
  • The supply chain has been mapped out using both primary and secondary research.
  • The global market was then divided into five major regions, which industry experts confirmed.
  • All percentage shares, splits, and breakdowns based on product type, bulk density, form, grade, application, end-use industry, and regions were determined from secondary sources and verified through primary sources.
  • All possible parameters influencing the markets discussed in this research were thoroughly examined, verified through primary research, and analyzed to produce the final quantitative and qualitative data. This data was then consolidated, supplemented with detailed inputs and analysis, and presented in this report.
Aluminum Fluoride (ALF3) Market

Data Triangulation

After estimating the total market size for Aluminum Fluoride (AlF3), the overall market has been divided into several segments and sub-segments. Data triangulation and market breakdown procedures have been used wherever applicable to complete the market analysis and determine accurate statistics for all segments. The data was triangulated by examining various factors and trends from both the demand and supply sides. Additionally, the market size was validated using both top-down and bottom-up approaches, along with primary interviews. Therefore, three sources were utilized for each data segment: top-down approach, bottom-up approach, and expert interviews. The data was considered accurate when the values from the three sources matched.

Market Definition

Aluminum Fluoride (AlF3) is a crucial chemical compound widely used in aluminum production to boost the smelting process’s efficiency by lowering alumina’s melting point, reducing energy use, and increasing overall output. Its main use is aluminum smelting, which helps increase production while maintaining operational efficiency. Beyond aluminum, AlF3 is also used in chemical manufacturing, ceramics, and glass-making, showing its versatility across different industries. The demand for aluminum fluoride closely follows the growth of aluminum production and expanding industrial activities that need lightweight, durable metals. Factors like the availability of raw materials, advancements in production technology, and the focus on high-purity, environmentally friendly manufacturing all support the market’s steady growth. As industrialization rises, infrastructure projects grow, and energy-efficient production methods become more common, the importance and long-term prospects of the aluminum fluoride (AlF3) market worldwide continue to strengthen.

Stakeholders

  • AlF3 manufacturers
  • AlF3 traders, distributors, and suppliers
  • Raw material suppliers
  • Government and private research organizations
  • Associations and industrial bodies
  • R&D institutions
  • Environmental support agencies

Report Objectives

  • To define, describe, and forecast the size of the aluminum fluoride (AlF3) market, in terms of value and volume
  • To provide detailed information regarding the major factors (drivers, opportunities, restraints, and challenges) influencing the growth of the market
  • To estimate and forecast the market size based on product type, bulk density, form, grade, application, end-use industry, and region
  • To forecast the size of the market with respect to major regions, namely, Europe, North America, Asia Pacific, the Middle East & Africa, and South America, along with their key countries
  • To strategically analyze micromarkets with respect to individual growth trends, prospects, and their contribution to the overall market
  • To analyze opportunities in the market for stakeholders and provide a competitive landscape of market leaders
  • To track and analyze recent developments, such as partnerships and expansions, in the market
  • To strategically profile key market players and comprehensively analyze their core competencies


Key Questions Addressed by the Report

Which factors influence the growth of the aluminum fluoride (AlF3) market?

Growth is driven by increasing aluminum production, smelting capacity expansions, and rising demand for lightweight materials in industries such as automotive, electronics, and optics. The Hall-Héroult process depends heavily on AlF3, directly linking its demand to global aluminum output. The availability of low-cost energy in emerging markets is further encouraging new smelter projects, fueling AlF3 consumption.

Which region is expected to have the largest market share in the aluminum fluoride (AlF3) market?

Asia Pacific is expected to dominate due to strong aluminum smelting capacity in China, India, and Southeast Asia, along with favorable industrial policies, energy resources, and robust AlF3 production infrastructure.

Who are the major manufacturers?

Key manufacturers include Fluorsid, Industries Chimiques du Fluor, Do-Fluoride New Materials, Alufluor, Alufluoride Limited, Orbia Fluor & Energy Materials, Gulf Fluor, Hunan Nonferrous Fluoride Chemical Group, AB LIFOSA, and PhosAgro Group.

What are the opportunities in the aluminum fluoride (AlF3) market?

Opportunities include the development of alternative production methods to reduce hydrofluoric acid use, expansion into new smelting regions like Africa and Central Asia, and forming long-term supply contracts. Growth is also expected in specialty and high-performance formulations.

Which end-use industry holds the largest aluminum fluoride (AlF3) market share?

The aluminum industry remains the primary end-use sector, accounting for the majority of AlF3 consumption due to its role in electrolytic aluminum production.

Personalize This Research

  • Triangulate with your Own Data
  • Get Data as per your Format and Definition
  • Gain a Deeper Dive on a Specific Application, Geography, Customer or Competitor
  • Any level of Personalization
Request A Free Customisation

Let Us Help You

  • What are the Known and Unknown Adjacencies Impacting the Aluminum Fluoride (AlF3) Market
  • What will your New Revenue Sources be?
  • Who will be your Top Customer; what will make them switch?
  • Defend your Market Share or Win Competitors
  • Get a Scorecard for Target Partners
Customized Workshop Request

Custom Market Research Services

We Will Customise The Research For You, In Case The Report Listed Above Does Not Meet With Your Requirements

Get 10% Free Customisation

Growth opportunities and latent adjacency in Aluminum Fluoride (AlF3) Market

DMCA.com Protection Status