TABLE OF CONTENTS
1INTRODUCTION (Page No 19)
1.1Objectives of the Study
1.2Market Definition
1.3Study Scope
Figure 1Yeast market segmentation
1.4Regional Segmentation
1.5Periodization Considered
1.6Currency Considered
Table 1USD exchange rate, 2014–2018
1.7Unit Considered
1.8Stakeholders
2RESEARCH METHODOLOGY (Page No 24)
2.1Research Data
Figure 2Yeast market: Research design
2.1.1Secondary data
2.1.1.1Key data from secondary sources
2.1.2Primary data
2.1.2.1Key data from primary sources
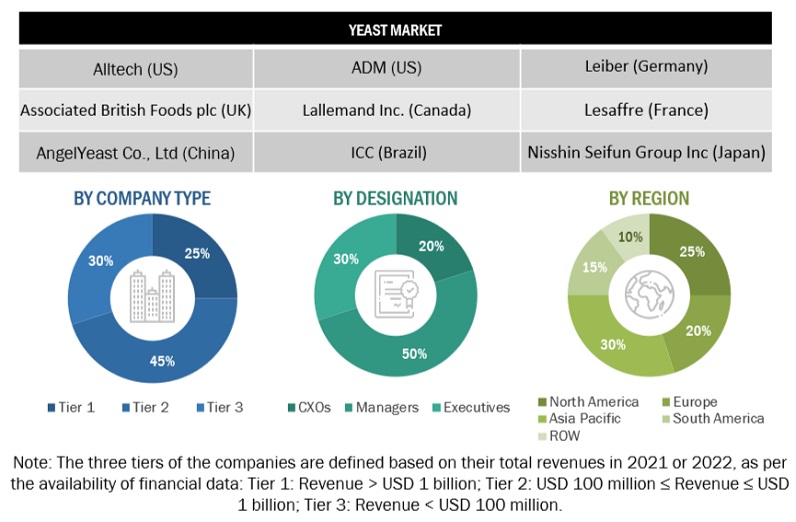
2.1.2.2Breakdown of primaries
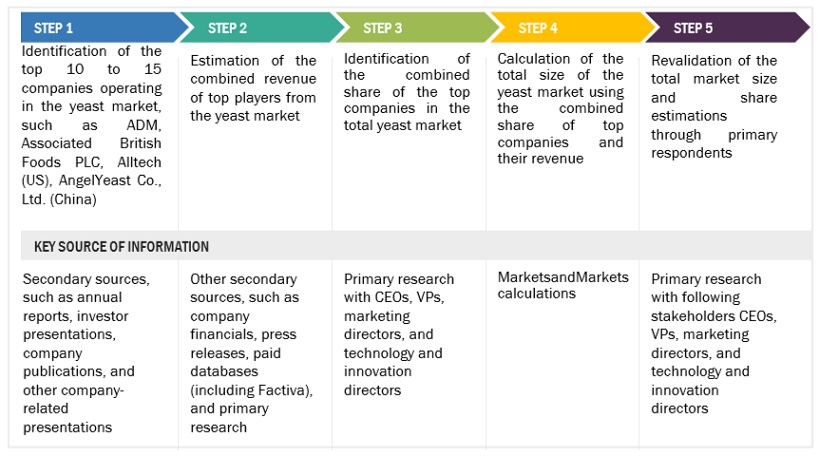
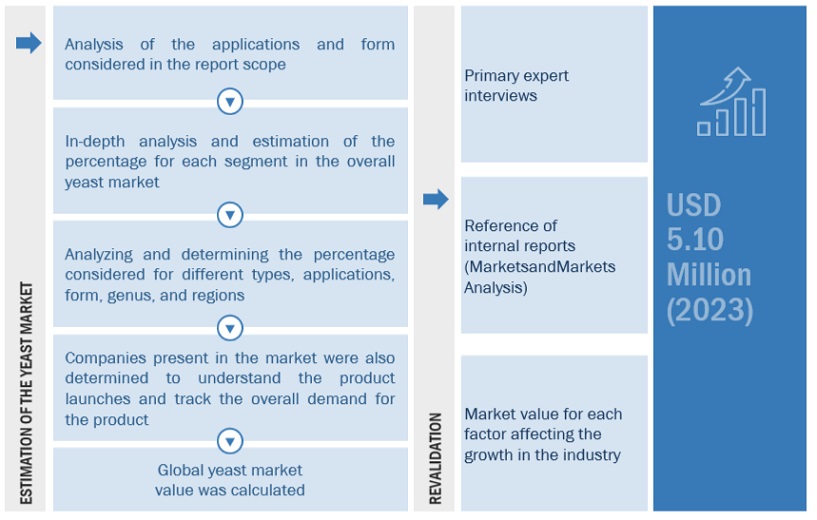
2.2Market Size Estimation
2.2.1Yeast market size estimation: Method 1
2.2.2Yeast market size estimation: Method 2
2.2.3Yeast market size notes
2.3Data Triangulation
Figure 3Data triangulation methodology
2.4Assumptions for the Study
2.5Limitations of the Study
2.6Market Scenarios Considered for Impact of COVID-19
2.6.1Scenario-based modelling
2.7COVID-19 Health Assessment
Figure 4COVID-19: The global propagation
Figure 5COVID-19 propagation: Select countries
2.8COVID-19 Economic Assessment
Figure 6Revised GDP forecasts for select G20 countries in 2020
2.8.1COVID-19 impact on the economy—scenario assessment
Figure 7Criteria impacting the global economy
Figure 8Scenarios for recovery of the global economy
3EXECUTIVE SUMMARY (Page No 38)
Table 2Yeast market snapshot, 2020 vs. 2025
Figure 9Yeast market size, by type, 2020 vs. 2025 (USD Million)
Figure 10Yeast market size, by form, 2020 vs. 2025 (USD Million)
Figure 11Yeast market share & growth (value), by region
4PREMIUM INSIGHTS (Page No 41)
4.1Opportunities in the Yeast Market
Figure 12Growing demand for convenience & bakery food products to drive the growth of the yeast market
4.2Yeast Market, By Genus, 2019
Figure 13Saccharomyces segment accounted for the largest share in the yeast market
4.3Asia Pacific: Yeast Market, By Application and Key Country
Figure 14China dominated the yeast market due to the high consumption of bakery and yeast-based food products and large-scale production by key players in the country
4.4Yeast Market, By Application and Region, 2019
Figure 15Europe accounted for the largest share in the yeast market for food applications in 2019
4.5Yeast Market, By Key Country, 2019
Figure 16The US accounted for the largest market share in 2019
5MARKET OVERVIEW (Page No 44)
5.1Introduction
5.2Market Dynamics
Figure 17Yeast market: Drivers, restraints, opportunities, and challenges
5.2.1Drivers
5.2.1.1Rising demand for bakery products
5.2.1.2Global demand for bioethanol as a fuel
5.2.1.3Increase in nutritional benefits from yeast-based feed products
5.2.2Restraints
5.2.2.1Competition for basic raw material
5.2.2.2Willingness of livestock growers to use antibiotics for feed products
5.2.3Opportunities
5.2.3.1Replacing molasses with other raw materials
5.2.3.2Technological innovations in the feed industry
5.2.3.3Yeast as a promising protein source
5.2.4Challenges
5.2.4.1Commercialization of duplicate and low-quality products
5.2.4.2Impact of COVID-19
5.3Regulations
5.3.1US
5.3.2Canada
5.3.3Europe
5.3.4Australia
5.3.5China
5.4Value Chain Analysis
5.5Ecosystem Map
6YEAST MARKET, BY TYPE (Page No 60)
6.1Introduction
Figure 18Yeast market size, by type, 2020 vs. 2025 (USD Million)
Figure 19Yeast market size, by type, 2020 vs. 2025 (KT)
Table 3Yeast market size, by type, 2018–2025 (USD Million)
Table 4Yeast market size, by type, 2018–2025 (KT)
6.1.1Impact of COVID-19 on the yeast market size, by type
Table 5Yeast market size, by type, 2018–2021 (USD Million) (pessimistic scenario)
Table 6Yeast market size, by type, 2018–2021 (KT) (pessimistic scenario)
Table 7Yeast market size, by type, 2018–2021 (USD Million) (realistic scenario)
Table 8Yeast market size, by type, 2018–2021 (KT) (realistic scenario)
Table 9Yeast market size, by type, 2018–2021 (USD Million) (optimistic scenario)
Table 10Yeast market size, by type, 2018–2021 (KT) (optimistic scenario)
6.2Brewer’s Yeast
6.2.1High nutrition in comparison to other types of yeast to drive the growth of the brewer’s yeast market
Table 11Brewer’s yeast market size, by region, 2018–2025 (USD Million)
Table 12Brewer’s yeast market size, by region, 2018–2025 (KT)
6.3Baker’s Yeast
6.3.1High demand for bakery products, particularly bread, drives the growth of the baker’s yeast segment
Table 13Baker’s yeast market size, by region, 2018–2025 (USD Million)
Table 14Baker’s yeast market size, by region, 2018–2025 (KT)
6.4Wine Yeast
6.4.1Advancements in technology and production of various types of wine with different flavors, colors, and appearances to drive the market growth
Table 15Wine yeast market size, by region, 2018–2025 (USD Million)
Table 16Wine yeast market size, by region, 2018–2025 (KT)
6.5Probiotic Yeast
6.5.1Enhanced probiotic functions using engineered yeast offers growth opportunities for probiotic yeasts manufacturers
Table 17Probiotic yeast market size, by region, 2018–2025 (USD Million)
Table 18Probiotic yeast market size, by region, 2018–2025 (KT)
6.6Other Types
Table 19Other types market size, by region, 2018–2025 (USD Million)
Table 20Other types market size, by region, 2018–2025 (KT)
7YEAST MARKET, BY APPLICATION (Page No 72)
7.1Introduction
Figure 20Yeast market size, by application, 2020 vs. 2025 (USD Million)
Figure 21Yeast market size, by application, 2020 vs. 2025 (KT)
Table 21Yeast market size, by application, 2018–2025 (USD Million)
Table 22Yeast market size, by application, 2018–2025 (KT)
7.2Impact of COVID-19 on the Yeast Market Size, By Application
Table 23Yeast market size, by application, 2018–2021 (USD Million) (pessimistic scenario)
Table 24Yeast market size, by application, 2018–2021 (KT) (pessimistic scenario)
Table 25Yeast market size, by application, 2018–2021 (USD Million) (realistic scenario)
Table 26Yeast market size, by application, 2018–2021 (KT) (realistic scenario)
Table 27Yeast market size, by application, 2018–2021 (USD Million) (optimistic scenario)
Table 28Yeast market size, by application, 2018–2021 (KT) (optimistic scenario)
7.3Food
Table 29Yeast market size for food, by subapplication, 2018–2025 (USD Million)
Table 30Yeast market size for food, by subapplication, 2018–2025 (KT)
Table 31Yeast market size for food, by region, 2018–2025 (USD Million)
Table 32Yeast market size for food, by region, 2018–2025 (KT)
7.3.1Bakery products
7.3.1.1Adding nutritional value in bakery products to drive the growth of the yeast market
7.3.2Prepared meals
7.3.2.1Production of processed & prepared food using yeast as a food additive in developed regions to drive the growth of the market
7.3.3Beverages
7.3.3.1Increasing production and demand for wine and beer in developed regions to encourage the use of yeast as an ingredient
7.3.4Other food applications
7.4Feed
Table 33Yeast market size for feed, by subapplication, 2018–2025 (USD Million)
Table 34Yeast market size for feed, by subapplication, 2018–2025 (KT)
Table 35Yeast market size for feed, by region, 2018–2025 (USD Million)
Table 36Yeast market size for feed, by region, 2018–2025 (KT)
7.4.1Swine
7.4.1.1Increase in pig feed production in European countries to drive the growth of the yeast market
7.4.2Poultry
7.4.2.1Decrease in the usage of antibiotics to drive the demand for yeast-based poultry diets
7.4.3Cattle
7.4.3.1Rise in cattle production to encourage consumption of feed yeast across regions
7.4.4Other feed applications
7.5Other Applications
Table 37Yeast market size for other applications, by region, 2018–2025 (USD Million)
Table 38Yeast market size for other applications, by region, 2018–2025 (KT)
8YEAST MARKET, BY FORM (Page No 85)
8.1Introduction
Figure 22Yeast size, by form, 2020 vs. 2025 (USD Million)
Figure 23Yeast market size, by form, 2020 vs. 2025 (KT)
Table 39Yeast market size, by form, 2018–2025 (USD Million)
Table 40Yeast market size, by form, 2018–2025 (KT)
8.2Impact of COVID-19 on the Yeast Market, By Form
Table 41Yeast market size, by form (Pessimistic Scenario), 2018–2021 (USD Million)
Table 42Yeast market size, by form (Pessimistic Scenario), 2018–2021 (KT)
Table 43Yeast market size, by form (Realistic Scenario), 2018–2021 (USD Million)
Table 44Yeast market size, by form (Realistic Scenario), 2018–2021 (KT)
Table 45Yeast market size, by form (Optimistic Scenario), 2018–2021 (USD Million)
Table 46Yeast market size, by form (Optimistic Scenario), 2018–2021 (KT)
8.2.1Fresh
8.2.1.1Increase in the usage of fresh yeast due to rise in the consumption of bakery products drives the growth of the yeast market
8.2.2Instant
8.2.2.1Growing use of instant yeast commercially to drive the growth of the yeast market
8.2.3Active
8.2.3.1Use of active yeast in the production of wine to drive the market growth
9YEAST MARKET, BY GENUS (Page No 91)
9.1Introduction
Figure 24Yeast size, by genus, 2020 vs. 2025 (USD Million)
Figure 25Yeast market size, by genus, 2020 vs. 2025 (KT)
Table 47Yeast market size, by genus, 2018–2025 (USD Million)
Table 48Yeast market size, by genus, 2018–2025 (KT)
9.2Impact of COVID-19 on the Yeast Market Size, By Genus
Table 49Yeast market size, by genus, 2018–2021 (USD Million) (pessimistic scenario)
Table 50Yeast market size, by genus, 2018–2021 (KT) (pessimistic scenario)
Table 51Yeast market size, by genus, 2018–2021 (USD Million) (realistic scenario)
Table 52Yeast market size, by genus, 2018–2021 (KT) (realistic scenario)
Table 53Yeast market size, by genus, 2018–2021 (USD Million) (optimistic scenario)
Table 54Yeast market size, by genus, 2018–2021 (KT) (optimistic scenario)
9.2.1Saccharomyces
9.2.1.1High usage of saccharomyces in the bakery and feed industries due to its beneficial effects and growth performance
Table 55Saccharomyces market size, by region, 2018–2025 (USD Million)
Table 56Saccharomyces market size, by region, 2018–2025 (KT)
9.2.2Kluyveromyces
9.2.2.1Kluyveromyces marxianus to be the second-most common strain used for feed additives, as it helps in improving the health of animals
Table 57Kluyveromyces market size, by region, 2018–2025 (USD Million)
Table 58Kluyveromyces market size, by region, 2018–2025 (KT)
9.3Other Genera
Table 59Other genera market size, by region, 2018–2025 (USD Million)
Table 60Other genera market size, by region, 2018–2025 (KT)
10YEAST MARKET, BY REGION (Page No 99)
10.1Introduction
Figure 26Global alcoholic beverage production, 2015–2017
Figure 27Asia Pacific to be the fastest-growing market from 2020 to 2025 (volume)
Table 61Yeast market size, by region, 2018–2025 (USD Million)
Table 62Yeast market size, by region, 2018–2025 (KT)
10.1.1Impact of COVID-19 on the North American yeast market
Table 63Yeast market size, by region, 2018–2025 (USD Million) (pessimistic scenario)
Table 64Yeast market size, by region, 2018–2025 (KT) (pessimistic scenario)
Table 65Yeast market size, by region, 2018–2025 (USD Million) (realistic scenario)
Table 66Yeast market size, by region, 2018–2025 (KT) (realistic scenario)
Table 67Yeast market size, by region, 2018–2025 (USD Million) (optimistic scenario)
Table 68Yeast market size, by region, 2018–2025 (KT) (optimistic scenario)
10.2North America
Figure 28Fermented beverage production, North America, 2015–2017
Table 69North America: Yeast market size, by country, 2018–2025 (USD Million)
Table 70North America: Yeast market size, by country, 2018–2025 (KT)
Table 71North America: Yeast market size, by type, 2018–2025 (USD Million)
Table 72North America: Yeast market size, by type, 2018–2025 (KT)
Table 73North America: Yeast market size, by genus, 2018–2025 (USD Million)
Table 74North America: Yeast market size, by genus, 2018–2025 (KT)
Table 75North America: Yeast market size, by application, 2018–2025 (USD Million)
Table 76North America: Yeast market size, by application, 2018–2025 (KT)
10.2.1US
10.2.1.1Growth of the bioethanol industry to drive the market growth in the country
Table 77US: Yeast market size, by application, 2018–2025 (USD Million)
Table 78US: Yeast market size, by application, 2018–2025 (KT)
10.2.2Canada
10.2.2.1High consumption of convenience food products to create growth opportunities for yeast manufacturers
Table 79Canada: Yeast market size, by application, 2018–2025 (USD Million)
Table 80Canada: Yeast market size, by application, 2018–2025 (KT)
10.2.3Mexico
10.2.3.1Increase in production of beer to drive the market growth in the country
Table 81Mexico: Yeast market size, by application, 2018–2025 (USD Million)
Table 82Mexico: Yeast market size, by application, 2018–2025 (KT)
10.3Europe
Figure 29Europe: Yeast market snapshot
Table 83Europe: Yeast market size, by country, 2018–2025 (USD Million)
Table 84Europe: Yeast market size, by country, 2018–2025 (KT)
Table 85Europe: Yeast market size, by type, 2018–2025 (USD Million)
Table 86Europe: Yeast market size, by type, 2018–2025 (KT)
Table 87Europe: Yeast market size, by genus, 2018–2025 (USD Million)
Table 88Europe: Yeast market size, by genus, 2018–2025 (KT)
Table 89Europe: Yeast market size, by application, 2018–2025 (USD Million)
Table 90Europe: Yeast market size, by application, 2018–2025 (KT)
10.3.1UK
10.3.1.1Growth in the UK bakery market and 80% consumption of bakery products to drive the yeast market growth
Table 91UK: Yeast market size, by application, 2018–2025 (USD Million)
Table 92UK: Yeast market size, by application, 2018–2025 (KT)
10.3.2Germany
10.3.2.1The country is the largest producer and exporter of yeast, thus the demand for yeast is projected to remain high
Table 93Germany: Yeast market size, by application, 2018–2025 (USD Million)
Table 94Germany: Yeast market size, by application, 2018–2025 (KT)
10.3.3Spain
10.3.3.1Increase in applications of yeast, such as bakery products made from frozen dough, to drive the market growth
Table 95Spain: Yeast market size, by application, 2018–2025 (USD Million)
Table 96Spain: Yeast market size, by application, 2018–2025 (KT)
10.3.4Italy
10.3.4.1Increase in fresh yeast production due to a rise in preference for ready-to-eat bakery products to drive the market growth in the country
Table 97Italy: Yeast market size, by application, 2018–2025 (USD Million)
Table 98Italy: Yeast market size, by application, 2018–2025 (KT)
10.3.5France
10.3.5.1High livestock production and an increase in domestic demand for bakery products to drive the market growth of yeast in both the food & feed industries
Table 99France: Yeast market size, by application, 2018–2025 (USD Million)
Table 100France: Savory ingredients market size, by application, 2018–2025 (KT)
10.3.6Rest of Europe
Table 101Rest of Europe: Yeast market size, by application, 2018–2025 (USD Million)
Table 102Rest of Europe: Yeast market size, by application, 2018–2025 (KT)
10.4Asia Pacific
Figure 30Asia Pacific: Yeast market snapshot
Table 103Asia Pacific: Yeast market size, by country, 2018–2025 (USD Million)
Table 104Asia Pacific: Yeast market size, by country, 2018–2025 (KT)
Table 105Asia Pacific: Yeast market size, by type, 2018–2025 (USD Million)
Table 106Asia Pacific: Yeast market size, by type, 2018–2025 (KT)
Table 107Asia Pacific: Yeast market size, by genus, 2018–2025 (USD Million)
Table 108Asia Pacific: Yeast market size, by genus, 2018–2025 (KT)
Table 109Asia Pacific: Yeast market size, by application, 2018–2025 (USD Million)
Table 110Asia Pacific: Yeast market size, by application, 2018–2025 (KT)
10.4.1China
10.4.1.1China being a major feed producer in the world to create growth opportunities for feed yeast manufacturers
Table 111China: Yeast market size, by application, 2018–2025 (USD Million)
Table 112China: Yeast market size, by application, 2018–2025 (KT)
10.4.2India
10.4.2.1Increase in dairy and poultry consumption in India to drive the market growth for yeast
Table 113India: Yeast market size, by application, 2018–2025 (USD Million)
Table 114India: Yeast market size, by application, 2018–2025 (KT)
10.4.3Japan
10.4.3.1Increase in the inclination toward microbial feed additives among manufacturers to drive the market growth for yeast in Japan
Table 115Japan: Yeast market size, by application, 2018–2025 (USD Million)
Table 116Japan: Yeast market size, by application, 2018–2025 (KT)
10.4.4Australia
10.4.4.1Presence of established meat industry and high consumption of feed products in the country to drive the demand for yeast
Table 117Australia: Yeast market size, by application, 2018–2025 (USD Million)
Table 118Australia: Yeast market size, by application, 2018–2025 (KT)
10.4.5South Korea
10.4.5.1Increase in the consumption of pork meat products to drive the demand for feed and create growth opportunities for feed yeast manufacturers in the country
Figure 31World pork meat consumption, 2018
Table 119South Korea: Yeast market size, by application, 2018–2025 (USD Million)
Table 120South Korea: Yeast market size, by application, 2018–2025 (KT)
10.4.6Rest of Asia Pacific
Table 121Rest of Asia Pacific: Yeast market size, by application, 2018–2025 (USD Million)
Table 122Rest of Asia Pacific: Yeast market size, by application, 2018–2025 (KT)
10.5South America
Table 123South America: Yeast market size, by country, 2018–2025 (USD Million)
Table 124South America: Yeast market size, by country, 2018–2025 (KT)
Table 125South America: Yeast market size, by type, 2018–2025 (USD Million)
Table 126South America: Yeast market size, by type, 2018–2025 (KT)
Table 127South America: Yeast market size, by genus, 2018–2025 (USD Million)
Table 128South America: Yeast market size, by genus, 2018–2025 (KT)
Table 129South America: Yeast market size, by application, 2018–2025 (USD Million)
Table 130South America: Yeast market size, by application, 2018–2025 (KT)
10.5.1Brazil
10.5.1.1Increase in the consumption and production of processed food in the country to drive the growth of the yeast market
Table 131Brazil: Yeast market size, by application, 2018–2025 (USD Million)
Table 132Brazil: Yeast market size, by application, 2018–2025 (KT)
10.5.2Argentina
10.5.2.1Increase in demand for bioethanol in the country to support the growth of the yeast market
Figure 32Beer production in Argentina, 2015–2017
Table 133Argentina: Yeast market size, by application, 2018–2025 (USD Million)
Table 134Argentina: Yeast market size, by application, 2018–2025 (KT)
10.5.3Rest of South America
Table 135Rest of South America: Yeast market size, by application, 2018–2025 (USD Million)
Table 136Rest of South America: Yeast market size, by application, 2018–2025 (KT)
10.6Rest of the World
Table 137RoW: Yeast market size, by country, 2018–2025 (USD Million)
Table 138RoW: Yeast market size, by country, 2018–2025 (KT)
Table 139RoW: Yeast market size, by type, 2018–2025 (USD Million)
Table 140RoW: Yeast market size, by type, 2018–2025 (KT)
Table 141RoW: Yeast market size, by genus, 2018–2025 (USD Million)
Table 142RoW: Yeast market size, by genus, 2018–2025 (KT)
Table 143RoW: Yeast market size, by application, 2018–2025 (USD Million)
Table 144RoW: Yeast market size, by application, 2018–2025 (KT)
10.6.1Midd East
10.6.1.1Changing consumer lifestyle and high consumption of fast food products to drive the market for yeast
Table 145Midd East: Yeast market size, by application, 2018–2025 (USD Million)
Table 146Midd East: Yeast market size, by application, 2018–2025 (KT)
10.6.2Africa
Table 147Africa: Yeast market size, by application, 2018–2025 (USD Million)
Table 148Africa: Yeast market size, by application, 2018–2025 (KT)
11COMPETITIVE LANDSCAPE (Page No 143)
11.1Overview
11.2Competitive Scenario
Figure 33Market evaluation framework, 2017–2020
11.3Competitive Scenario
11.3.1Expansion
Table 149Expansion, 2017–2020
11.3.2Acquisitions
Table 150Acquisitions, 2017-2019
11.3.3New product launch
Table 151New product launch, 2017–2019
11.4Competitive Leadership Mapping
11.4.1Stars
11.4.2Pervasive
11.4.3Emerging leaders
11.4.4Product footprint
Figure 34Yeast market: Competitive leadership mapping, 2019
11.4.5Strength of product portfolio
Figure 35Product portfolio analysis of top players in the yeast market
11.4.6Business strategy excellence
Figure 36Business strategy excellence of top players in the yeast market
11.5Ranking of Key Players, 2019
Figure 37ANGELYEAST CO., LTD., led the yeast market in 2019
11.6Competitive Leadership Mapping (Startup/SME)
11.6.1Progressive companies
11.6.2Starting blocks
11.6.3Responsive companies
11.6.4Dynamic companies
Figure 38Yeast market: Competitive leadership mapping, 2019
11.6.5Strength of product portfolio
Figure 39Product portfolio analysis of top players in the yeast market (Startup/SME)
11.6.6Business strategy excellence
Figure 40Business strategy excellence of top players in the yeast market (Startup/SME)
12COMPANY PROFILES (Page No 153)
(Business Overview, Products Offered, Recent Developments, SWOT Analysis, MnM View)*
12.1ASSOCIATED BRITISH FOODS PLC
Figure 41ASSOCIATED BRITISH FOODS PLC: Company snapshot
12.2ALLTECH
12.3ANGELYEAST CO., LTD.
12.4CHR. HANSEN HOLDING A/S
Figure 42CHR. HANSEN HOLDING A/S: Company snapshot
12.5KONINKLIJKE DSM N.V.
Figure 43KONINKLIJKE DSM N.V.: Company snapshot
12.6LALLEMAND INC.
12.7LEIBER GMBH
12.8LESAFFRE GROUP
12.9ORIENTAL YEAST CO., LTD.
12.10SYNERGY FLAVORS
12.11HALCYON PROTEINS PVY. LTD.
12.12FOOD CHEM INTERNATIONAL CORPORATION
12.13SENSIENT TECHNOLOGIES CORPORATION
Figure 44SENSIENT TECHNOLOGIES CORPORATION: Company snapshot
12.14PACIFIC FERMENTATION INDUSTRIES
12.15KERRY GROUP PLC
Figure 45KERRY GROUP PLC: Company snapshot
12.16BIORIGIN
12.17ICC BRAZIL
12.18NOVOZYMES
Figure 46NOVOZYMES: Company snapshot
12.19AGENCIAS LEVAPAN
12.20PAKMAYA
*Details on Business Overview, Products Offered, Recent Developments, SWOT Analysis, MnM View might not be captured in case of unlisted companies.
13APPENDIX (Page No 179)
13.1Discussion Guide
13.2Knowledge Store: MarketsandMarkets’ Subscription Portal
13.3Available Customizations
13.4Related Reports
13.1Author Details
Growth opportunities and latent adjacency in Yeast Market