The study involved major activities in estimating the current size of the building integrated photovoltaic market. Exhaustive secondary research was done to collect information on the peer and parent markets. The next step was to validate these findings, assumptions, and sizing with industry experts across the value chain through primary research. Both top-down and bottom-up approaches were employed to estimate the total market size. Thereafter, market breakdown and data triangulation were used to estimate the market size of the segments and subsegments.
Secondary Research
Secondary sources referred to for this research study include annual reports, press releases, and investor presentations of companies; white papers; certified publications; articles by recognized authors; and databases of various companies and associations. Secondary research was mainly used to obtain key information about the industry’s supply chain, the total pool of key players, market classification, and segmentation according to industry trends to the bottom-most level, regional markets, and key developments from both, market- and technology-oriented perspectives.
Primary Research
In the primary research process, various primary sources from the supply and demand sides were interviewed to obtain qualitative and quantitative information for this report. Primary sources from the supply side include industry experts such as chief executive officers (CEOs), vice presidents (VPs), marketing directors, and related key executives from various companies and organizations operating in the building-integrated photovoltaics market.
In the complete market engineering process, the top-down and bottom-up approaches, along with several data triangulation methods, were extensively used to perform the market size estimations and forecasts for all segments and subsegments listed in this report. Extensive qualitative and quantitative analyses were conducted to complete the market engineering process and list key information/insights throughout the report. Following is the breakdown of primary respondents:

To know about the assumptions considered for the study, download the pdf brochure
BIPV Market Size Estimation
The top-down and bottom-up approaches were used to estimate and validate the size of the building-integrated photovoltaic market. The key players in the market were identified through secondary research, and their market share in the respective regions was obtained through primary and secondary research. The research methodology includes the study of the annual and financial reports of the top market players and interviews with industry experts, such as chief executive officers, vice presidents, directors, sales managers, and marketing executives, for key quantitative and qualitative insights related to the BIPV market. The research methodology used to estimate the market size includes the following:
-
Extensive secondary research was used to identify the major players in the industry and market, and their market share was established using both primary and secondary research.
-
Both primary and secondary research methods were used to assess the industry's value chain and market size.
-
All percentage shares, splits, and breakdowns were obtained using secondary sources and validated by primary sources.
Building integrated photovoltaic Market Size: Top-Down Approach

To know about the assumptions considered for the study, Request for Free Sample Report
Building-integrated photovoltaics Market Size: Bottom-Up Approach

Data Triangulation
After arriving at the overall market size from the estimation process explained below, the total market was split into several segments and subsegments. The data triangulation and market breakdown procedures were employed, wherever applicable, to complete the overall market engineering process and arrive at the exact statistics for all segments and subsegments. The data was triangulated by studying various factors and trends from both the demand and supply sides. The market size was validated using the top-down and bottom-up approaches.
Market Definition
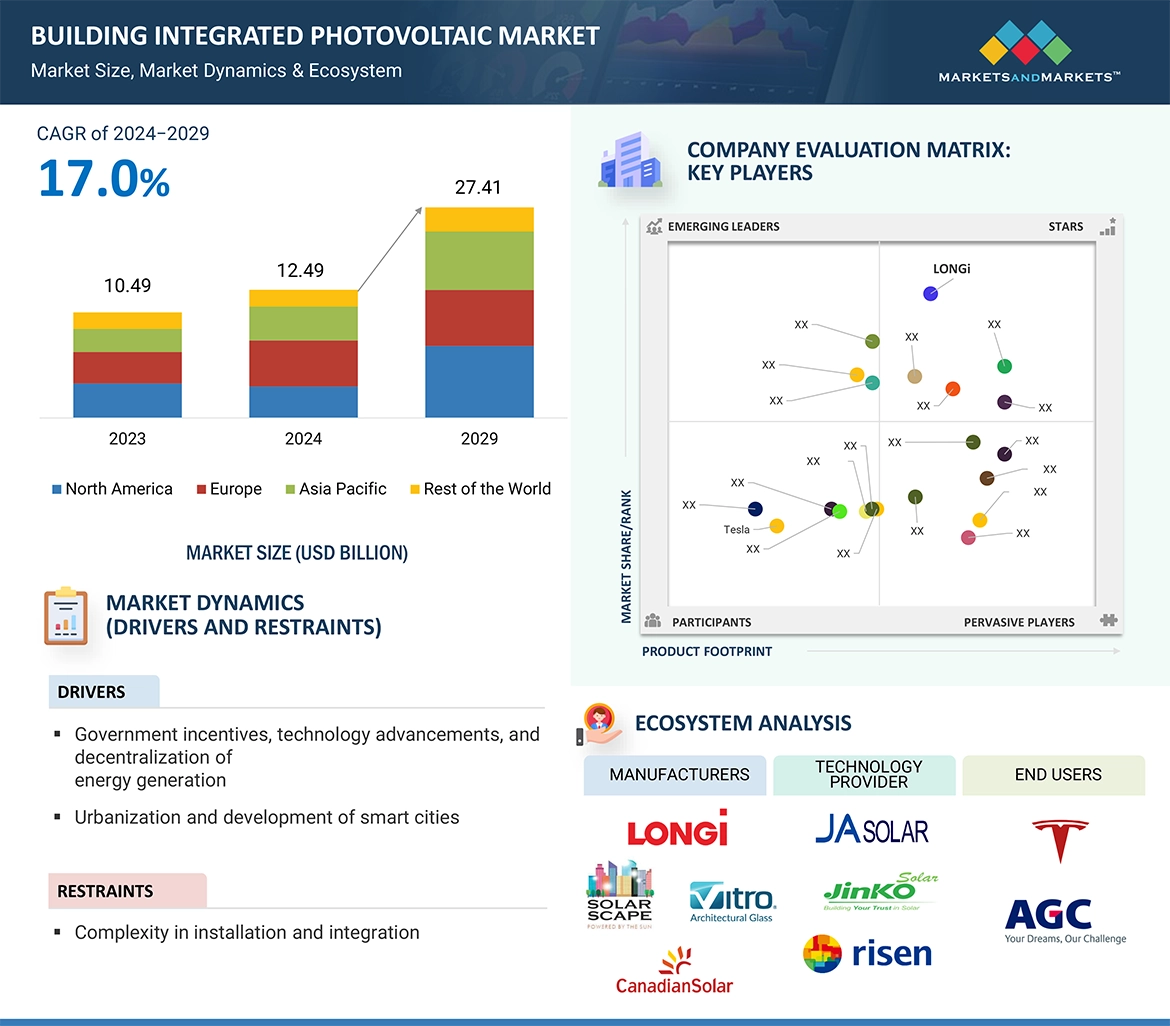
Building integrated photovoltaics (BIPV) refers to photovoltaic materials that are incorporated directly into the building envelope, replacing conventional building components like roofs, walls, windows, facades, skylights, and even walkways.
They also function as building materials, offering weather protection, and insulation, and potentially contributing to daylighting and aesthetics. BIPY seamlessly blends with the building design, becoming an integral part of the structure. It offers the combined benefits of power generation and building material properties.
BIPV is growing technology that contributes to sustainable building practices by generating clean energy and improving building energy efficiency.
Key Stakeholders
-
PV cell manufacturers
-
PV module manufacturers
-
BIPV product manufacturers
-
BIPV product distributors
-
BIPV market technical consultants
-
End users of BIPV-based solutions
-
Raw materials and manufacturing equipment suppliers
-
PV market technical consultants
-
Technology standards organizations, forums, alliances, and associations
-
Governments, financial institutions, and investment communities
-
Research organizations
-
Analysts and strategic business planners
-
Venture capitalists, private equity firms, and start-up companies
-
Distributors
Objectives of the Stud
-
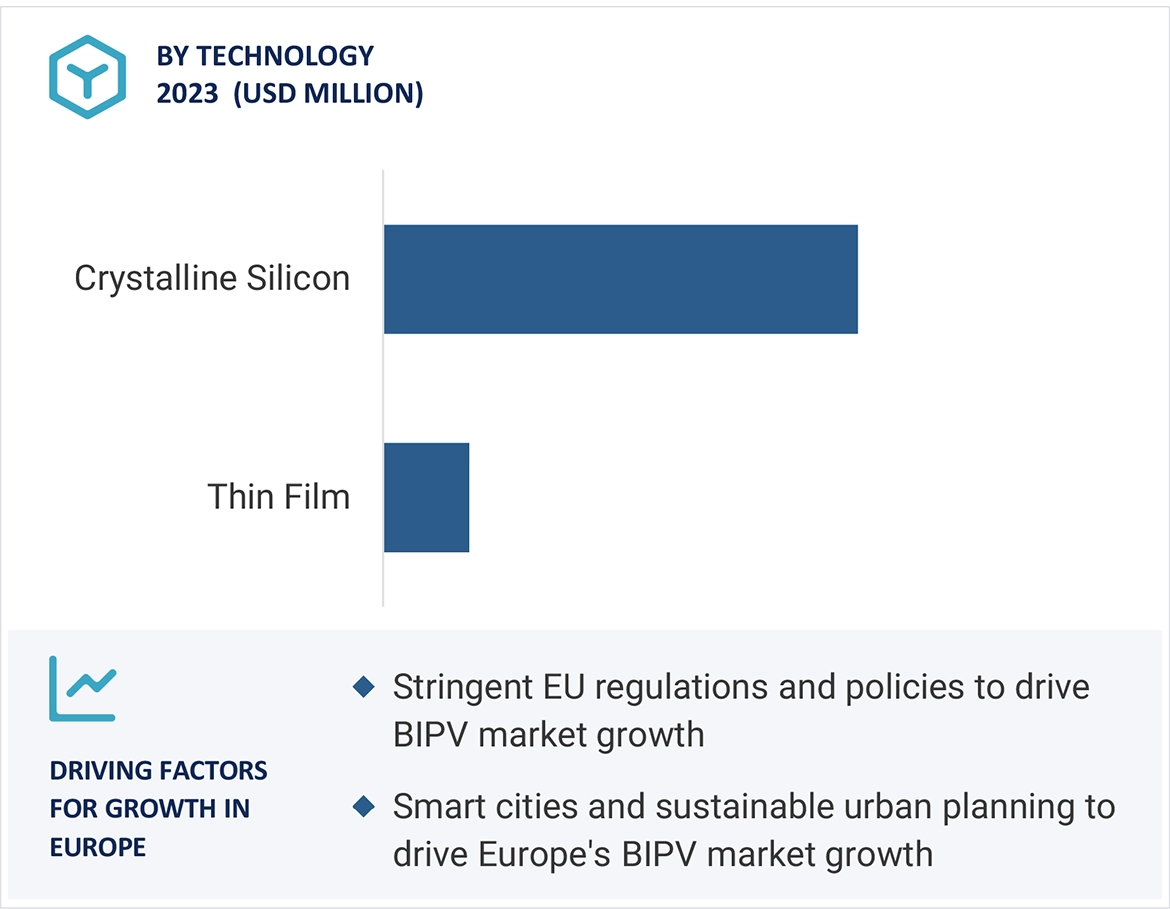
To define, describe, segment, and forecast the building integrated photovoltaic market size, by technology, application, and end-user in terms of value
-
To forecast the market size across four key regions, namely, North America, Europe, Asia Pacific, and the Rest of the World, along with the country-level market sizes in terms of value
-
To forecast the market size across four key regions, namely, North America, Europe, Asia Pacific, and the Rest of the World, in terms of volume.
-
To provide detailed information about the key drivers, restraints, opportunities, and industry-specific challenges influencing the growth of the BIPV market
-
To strategically analyze the BIPV market for individual growth trends, prospects, and contributions of each segment to the market
-
To provide information pertaining to the supply chain, trends/disruptions impacting customer business, ecosystem/market map, pricing of building integrated photovoltaic, and regulatory landscape of the BIPV market
-
To strategically analyze the micromarkets1 with respect to individual growth trends, upcoming expansions, and their contributions to the overall market
-
To analyze opportunities for stakeholders in the BIPV market and draw a competitive landscape for market players
-
To benchmark players within the market using the company evaluation matrix, which analyzes market players on various parameters within the broad categories of business and product strategies
-
To compare key market players with respect to the market share, product specifications, and applications
-
To strategically profile key players and comprehensively analyze their market ranking and core competencies2.
-
To track and analyze competitive developments in the BIPV market, such as contracts, agreements, investments, expansions, product launches, alliances, mergers, partnerships, joint ventures, collaborations, and acquisitions
Available Customizations:
With the given market data, MarketsandMarkets offers customizations according to the specific requirements of companies. The following customization options are available for the report:
PRODUCT ANALYSIS
-
Product Matrix, which provides a detailed comparison of the product portfolio of each company
COMPANY INFORMATION
-
Detailed analyses and profiling of additional market players


Keziah
Mar, 2014
I am currently doing my masters dissertation in modelling and assessing the potential of a BIPV system for a Residential Villa in Dubai. It would be great if you could provide me with the details of different BIPV Systems and the different companies offering it..