The research study involved extensive secondary sources, directories, and databases such as Bloomberg Businessweek and Factiva to identify and collect information useful for a technical, market-oriented, and commercial study of the bottled water processing market. In-depth interviews were conducted with various primary respondents—such as key industry participants, subject matter experts (SMEs), C-level executives of key market players, and industry consultants—to obtain and verify critical qualitative and quantitative information and assess prospects.
Secondary Research
In the secondary research process, various secondary sources were referred to, so as to identify and collect information. These secondary sources included annual reports, press releases & investor presentations of companies, white papers, certified publications, articles by recognized authors, reports by the International Bottled Water Association (IBWA) and regulatory bodies, news articles, trade directories, and databases. They were used to identify and collect information. The secondary research was used mainly to obtain key information about the industry’s supply chain, distribution channels, the total pool of key players, market classification, and segmentation according to the industry trends to the bottom-most level, regional markets and key developments from both market- and technology-oriented perspectives.
Primary Research
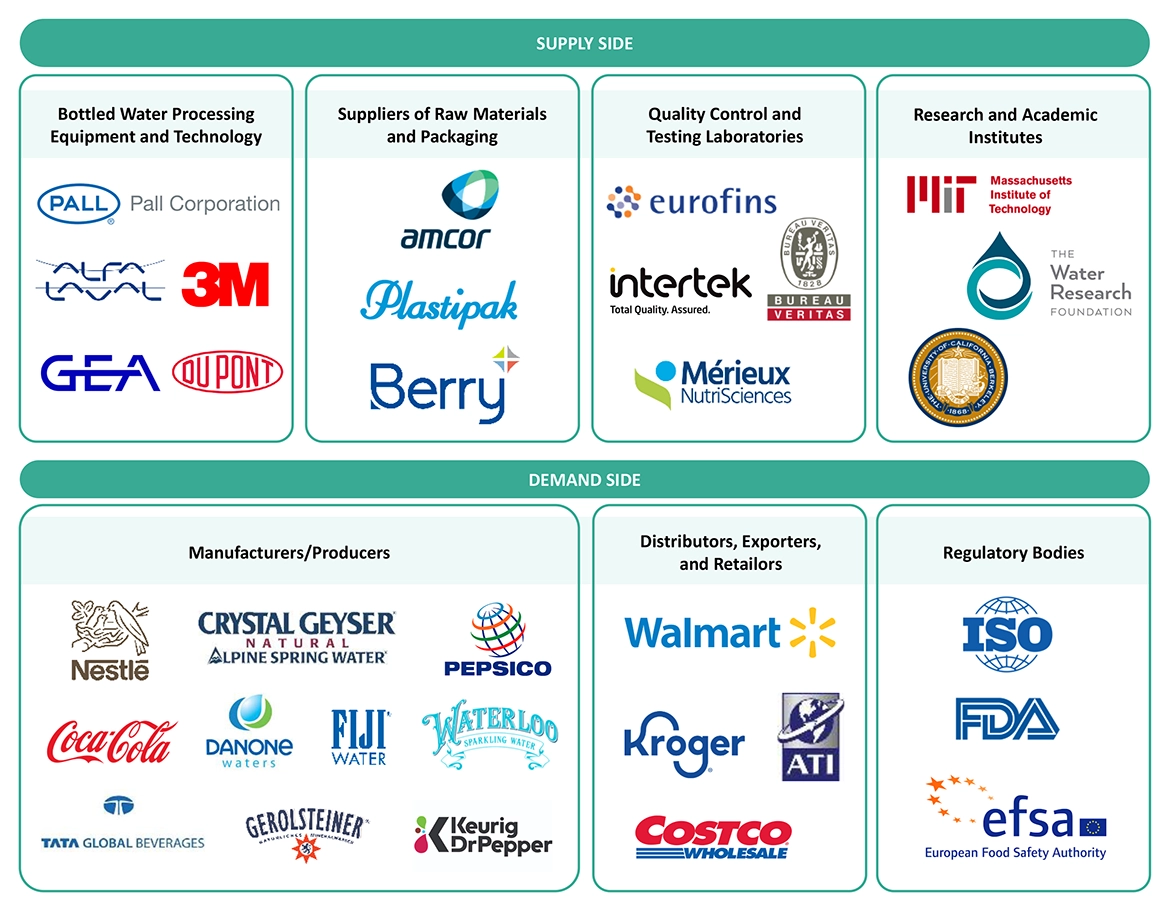
The bottled water processing market comprises several stakeholders, such as raw material suppliers, processors, machine and component manufacturers, and regulatory organizations, in the supply chain. The supply side of the bottled water processing market is characterized by the presence of key machine/equipment manufacturers or assembly manufacturers. The demand side is characterized by the presence of bottled water processors, manufacturers, retailers, and key technology providers for the manufacturing of bottled water. Various key opinion leaders (KOLs) from both the supply and demand sides of the market were interviewed to obtain qualitative and quantitative information. The primary interviewees from the demand side include key opinion leaders, executives, vice presidents, CEOs, managers from public and private organizations, and food & beverage stakeholders. The primary sources from the supply side include the research institutions involved in R&D to introduce technologies for updating equipment, key opinion leaders, distributors, and food equipment manufacturers.

To know about the assumptions considered for the study, download the pdf brochure
Market Size Estimation
Both the top-down and bottom-up approaches were used to estimate and validate the total size of the market. These approaches were also used extensively to estimate the market size of various dependent submarkets in the overall bottled water processing market. The research methodology used to estimate the market size includes the following details:
-
The key players were identified through extensive secondary and primary research.
-
The industry’s value chain and market size, in terms of value, were determined through primary and secondary research.
-
All percentage shares, splits, and breakdowns were determined using secondary research and verified through primary sources.
-
All possible parameters that affect the markets covered in this research study have been accounted for, viewed in extensive detail, verified through primary sources, and analyzed to obtain the final quantitative and qualitative data.
Market size estimation: Top-Down approach


To know about the assumptions considered for the study, Request for Free Sample Report
Market size estimation methodology: Bottom-up approach

Data Triangulation
After arriving at the overall market size from the estimation process explained above, the total market was split into several segments. To complete the overall market engineering process and arrive at the exact statistics for all segments, the data triangulation and market breakdown procedures were employed, wherever applicable. The data was triangulated by studying various factors and trends from both the demand and supply sides. In addition, the market size was validated using both the top-down and bottom-up approaches; it was then verified through primary interviews. Thus, there are three approaches: the first is the top-down approach, the second is the bottom-up approach, and the third is the learning and verification approach through expert interviews. Only when the values arrived at from the three points match, is the data assumed to be correct.
Market Definition
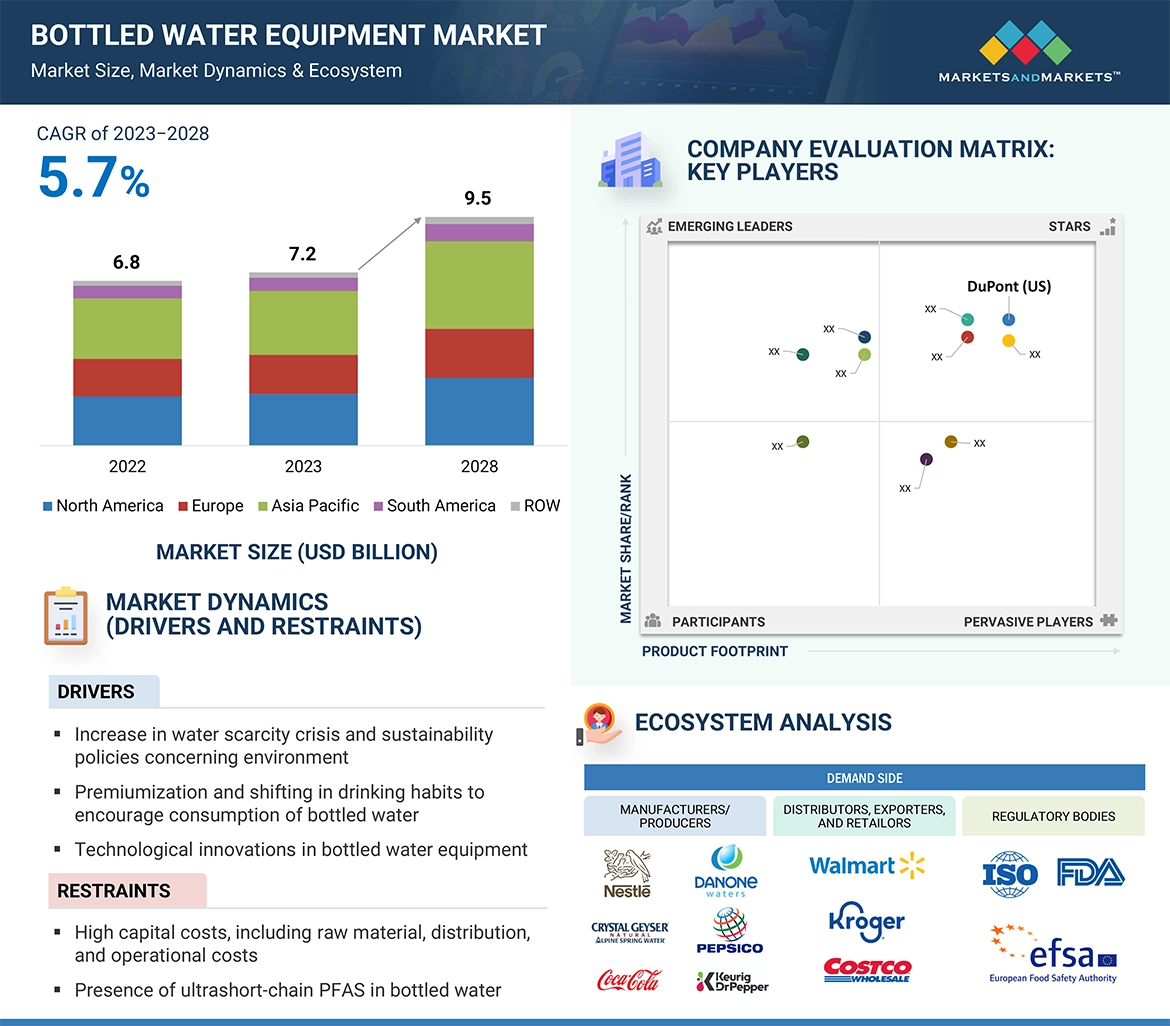
Bottled water processing technology & equipment is defined (for this study) as: “any process, method, and protocol by which the machineries and equipment are used in the manufacturing, handling, packaging, and storing of these.” The global demand and revenue generated by the sales and marketing of these equipment and technology lead to the sizing of the global sales value market.
“Bottled water is an optimal choice for hydration and refreshment, offering consistent safety, quality, good taste, and convenience. The United States Food and Drug Administration (FDA) comprehensively regulates bottled water, treating it as a packaged food product. Bottled water must adhere to the FDA's stringent requirements regarding food safety, labeling, and inspections. It is also subject to state regulations, and members of the International Bottled Water Association (IBWA) are obligated to follow the IBWA Model Code.
The classification of water as "bottled water" or "drinking water" is contingent upon meeting all applicable federal and state standards, being sealed in a sanitary container, and being intended for human consumption. Importantly, FDA standards for bottled water are legally mandated to be at least as rigorous and health-protective as the standards set by the U.S. Environmental Protection Agency (EPA) for public water systems.”
Key Stakeholders
-
Manufacturers/Suppliers
-
Bottled water manufacturers and processors.
-
Polymer industry
-
Bottled water retailers, wholesalers, and distributors.
-
Bottled water equipment manufacturers and providers.
-
Research & development laboratories
-
Regulatory bodies and institutions, and government agencies
-
Organizations such as the Food and Drug Administration (FDA), United States Department of Agriculture (USDA), European Food Safety Agency (EFSA), EUROPA, Codex Alimentarius, and Food Safety Australia and New Zealand (FSANZ)
-
Associations such as International Bottled Water Association (IBWA), International Council of Bottled Water Associations, Canadian Bottled Water Association (CBWA), European Federation of Bottled Waters (EFBW), China Beverage Industry Association (CBIA), Asia and Middle East Bottled Water Association (ABWA), Australasian Bottled Water Institute (ABWI) (Australia and New Zealand), European Bottled Watercooler Association (EBWA), Latin American Bottled Water Association (LABWA)
-
Intermediary suppliers
-
Bottled water logistics service providers and transporters.
Report Objectives
Market Intelligence
-
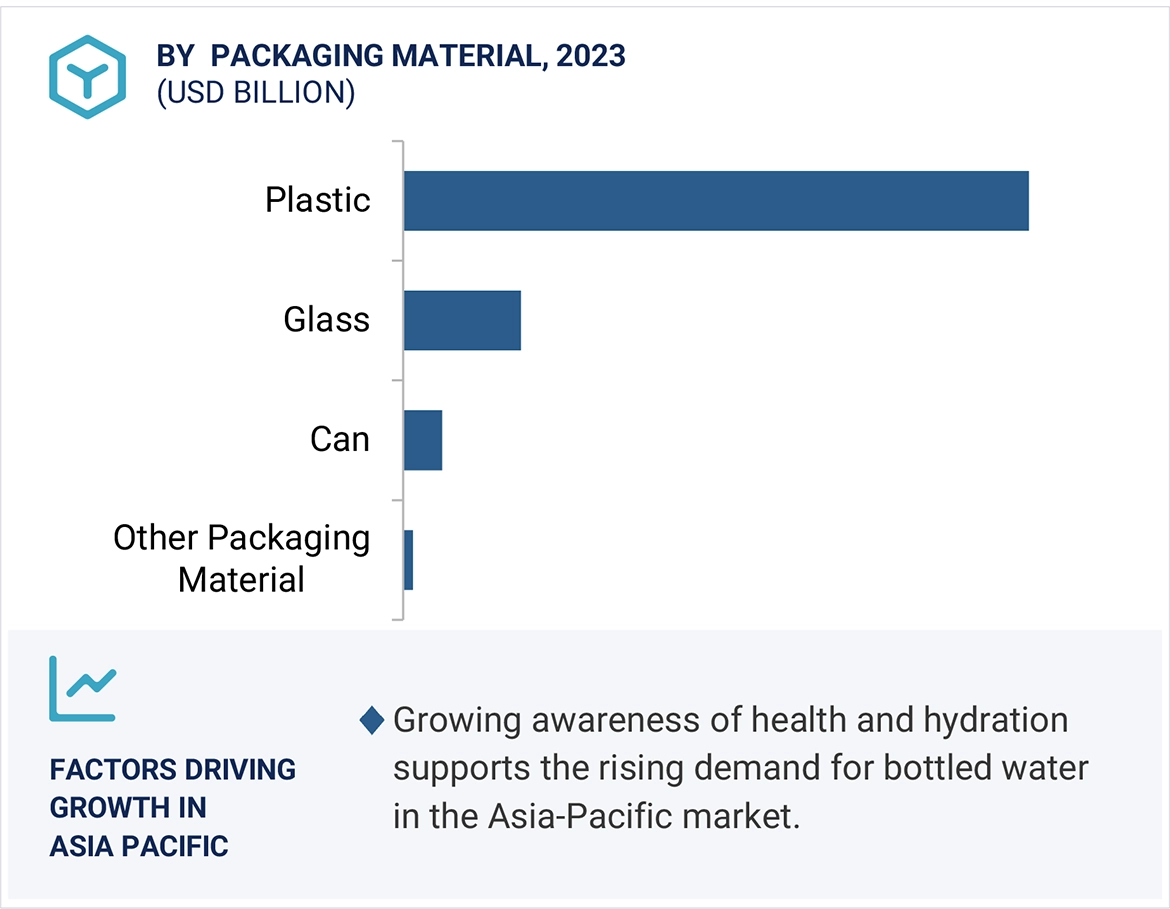
Determining and projecting the size of the bottled water processing market with respect to equipment, technology, product type, packaging material, and region, over a five-year period ranging from 2023 to 2028.
-
Identifying the attractive opportunities in the market by determining the largest and fastest-growing segments across regions
-
Providing detailed information about the key factors influencing the growth of the market (drivers, restraints, opportunities, and industry-specific challenges)
-
Analyzing the micro-markets with respect to individual growth trends, prospects, and their contribution to the total market
Competitive Intelligence
-
Identifying and profiling the key market players in the bottled water processing market.
-
Providing a comparative analysis of the market leaders on the basis of the following:
-
Product offerings
-
Business strategies
-
Strengths and weaknesses
-
Key financials
-
Understanding the competitive landscape and identifying the major growth strategies adopted by players across the key regions.
-
Providing insights on key product innovations and investments in the bottled water processing market.
Available Customizations:
With the given market data, MarketsandMarkets offers customizations according to company-specific scientific needs.
The following customization options are available for the report:
Product Analysis
-
Product Matrix, which gives a detailed comparison of the product portfolio of each company.
Geographic Analysis
With the given market data, MarketsandMarkets offers customizations according to company-specific scientific needs.
-
Further breakdown of the Rest of European bottled water processing market, by key country
-
Further breakdown of the Rest of the South American bottled water processing market, by key country
-
Further breakdown of the Rest of Asia Pacific bottled water processing market, by key country
Company Information
-
Detailed analyses and profiling of additional market players


Growth opportunities and latent adjacency in Bottled Water Processing Market