Bus Duct Market by Material (Copper, Aluminum), Current Rating (up to 800 A, 801-2,000 A, 2,001-5,000 A, Above 5,000 A), End-user (Utilities, Data Centers, Renewable Plants, EV Charging Infrastructure), Voltage, Type, and Region - Global Forecast to 2031

icon1
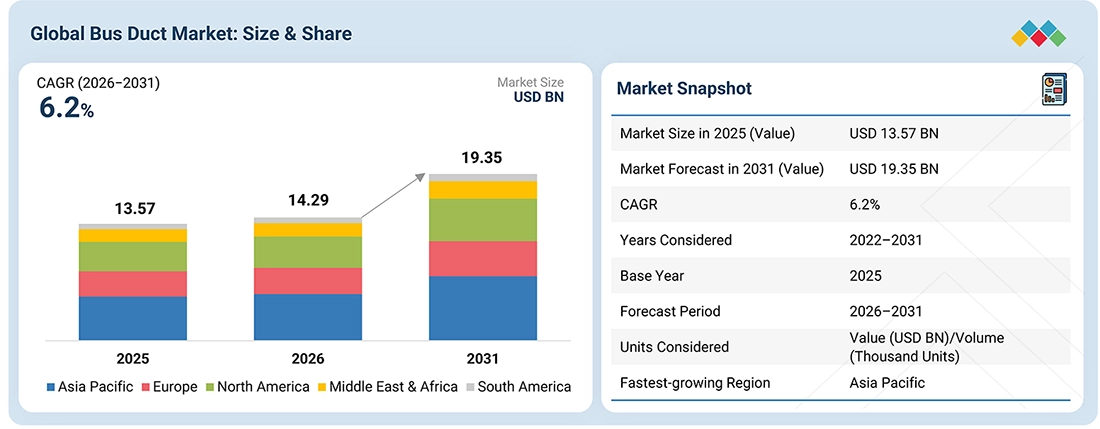
USD 19.35 BN
MARKET SIZE, 2031
icon2
CAGR 6.2%
(2026-2031)
icon3
255
REPORT PAGES
icon4
150
MARKET TABLES

OVERVIEW

bus-duct-market Overview

Source: Secondary Research, Interviews with Experts, MarketsandMarkets Analysis

The global bus duct market is projected to grow from USD 14.29 billion in 2026 to USD 19.35 billion by 2031, at a CAGR of 6.2%. Market growth is supported by increasing requirements for modular power distribution, particularly in facilities where electrical loads change frequently and future capacity additions must be accommodated with minimal disruption. Unlike conventional cable-based layouts, bus duct systems can simplify routing, reduce cable congestion, and enable more organized power distribution in space-constrained environments.

KEY TAKEAWAYS

  • BY REGION
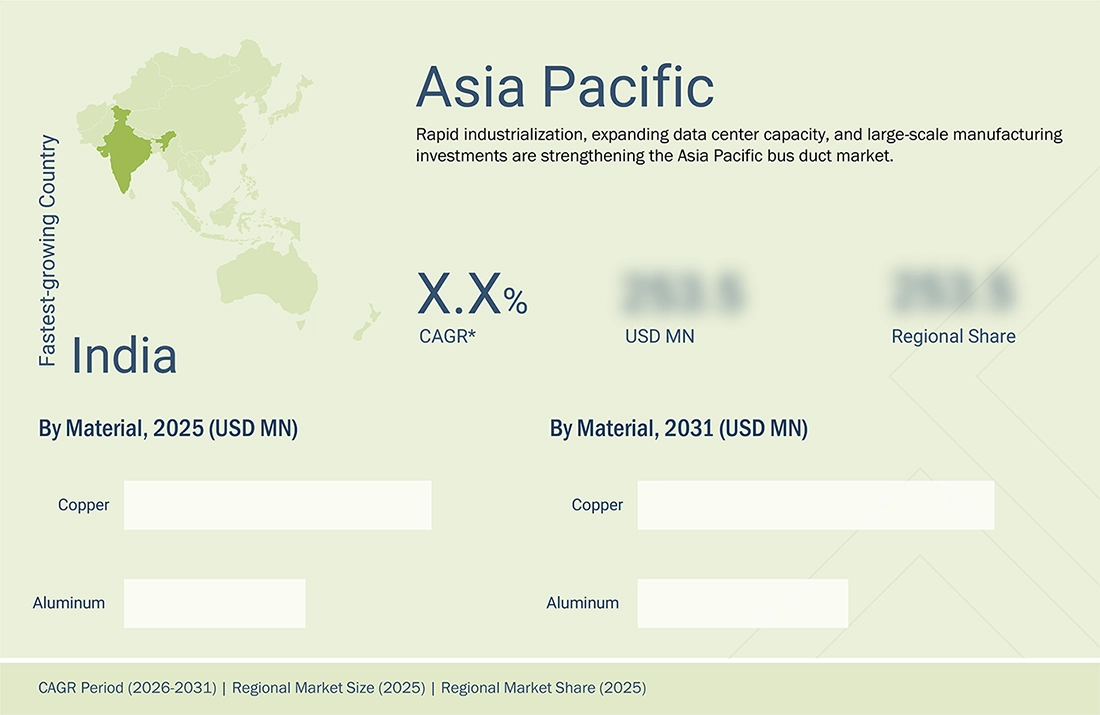
    Asia Pacific is expected to register the highest CAGR of 6.7% during the forecast period, driven by expanding manufacturing capacity, commercial infrastructure development, and rising deployment of data centers across key economies. Investments in semiconductor fabrication, industrial automation, and large-scale building projects are creating additional demand for adaptable power distribution systems, supporting bus duct adoption across new installations and electrical infrastructure upgrades.
  • BY MATERIAL
    By material, the aluminum segment is expected to register the fastest growth during the forecast period, supported by increasing preference for lightweight electrical distribution systems, lower conductor procurement costs, and reduced structural loading. These advantages are particularly relevant for large commercial facilities, industrial installations, and extensive busway networks where installation logistics and overall project economics influence material selection.
  • BY TYPE
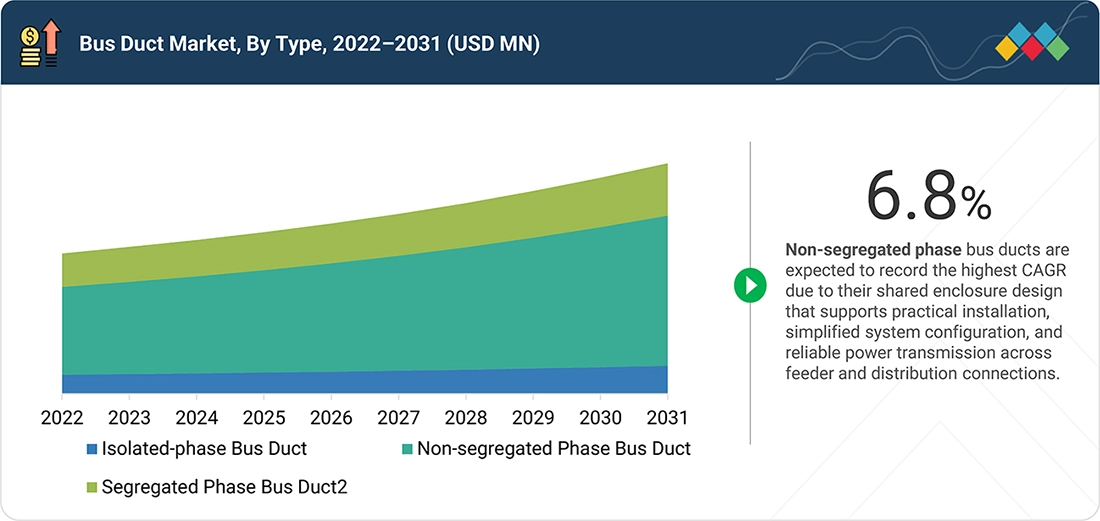
    By type, non-segregated phase bus duct is expected to account for the largest share of the global bus duct market during the forecast period, due to their widespread use in low-voltage power distribution across commercial buildings, industrial facilities, and data centers, supported by their cost-effectiveness and simpler installation.
  • BY VOLTAGE
    By voltage, the Medium (>1–35 kV) segment is expected to account for the largest share of the global bus duct market driven by its use in power generation, utilities, and heavy industrial applications that require reliable, high-capacity power distribution.
  • BY CURRENT RATING
    By current rating, 2,001-5,000 A is the largest segment of the global bus duct market, driven by demand for high-capacity power distribution in large industrial facilities, and high-rise commercial buildings.
  • BY END USER
    By end user, data centers are expected to register the highest CAGR during the forecast period, driven by rising AI workloads, increasing rack power density, and growing demand for high-capacity, reliable, and scalable power distribution systems.
  • COMPETITIVE LANDSCAPE (KEY PLAYERS)
    Legrand (France), ABB (Switzerland), Schneider Electric (France), Siemens (Germany) and Eaton (Ireland) companies are strengthening their market positions through broad portfolios, product innovation, manufacturing capabilities, strategic partnerships, and regional expansion.
  • COMPETITIVE LANDSCAPE - (SMEs/Startups)
    LS Corp. (South Korea), Daqo Group Co., Ltd. (China), Vertiv Group Corp. (US), and NOVOLECS (US) are emerging/specialized players in the global bus duct market. These companies are expanding their market presence through customized bus ducts.

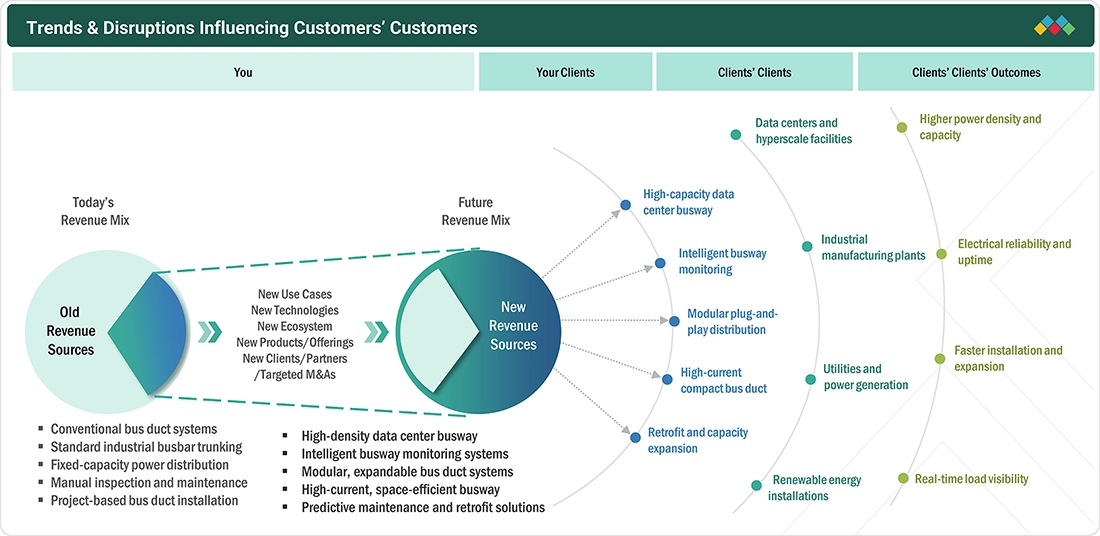
The global bus duct market is expected to be driven by rising investments in power distribution infrastructure, expansion of hyperscale data centers, and increasing electrification of industrial facilities. Growing deployment of high-density computing infrastructure is accelerating demand for compact, high-current busway systems that accommodate rack-level power distribution, modular expansion, and higher equipment loads. Industrial automation, commercial building electrification, and renewable power integration further strengthen demand for reliable, space-efficient alternatives to conventional cable-based distribution.

TRENDS & DISRUPTIONS IMPACTING CUSTOMERS' CUSTOMERS

The global bus duct market is estimated to register a CAGR of 6.2% during the forecast period, with ABB, Schneider Electric, Legrand, Eaton, and Siemens strengthening their positions across the market. Manufacturers are expanding their capabilities through high-capacity busway development, modular plug-in distribution systems, aluminum conductor solutions, and strategic investments in manufacturing and product innovation. The growing deployment of high-density data centers, increasing requirements for scalable electrical distribution, and modernization of industrial power infrastructure are creating opportunities for suppliers to expand their presence across global markets.

bus-duct-market Disruptions

Source: Secondary Research, Interviews with Experts, MarketsandMarkets Analysis

MARKET DYNAMICS

Drivers
Impact
Level
  • Expansion of high-power EV charging infrastructure
  • Industrial electrification and higher power requirements in manufacturing
RESTRAINTS
Impact
Level
  • Continued competitiveness of cable-based distribution in low-complexity installations
  • Physical integration and shutdown constraints in retrofit projects
OPPORTUNITIES
Impact
Level
  • Intelligent monitoring and predictive maintenance for service-based revenue generation
  • Retrofit-compatible products and bus duct lifecycle upgrades for brownfield installations
CHALLENGES
Impact
Level
  • Maintaining thermal performance and joint reliability at high current ratings

Source: Secondary Research, Interviews with Experts, MarketsandMarkets Analysis

Driver: Expansion of high-power EV charging infrastructure

The expansion of electric vehicle (EV) charging infrastructure is increasing the need for electrical distribution equipment at fast-charging hubs, electric bus depots, commercial fleet facilities and heavy-duty vehicle charging stations. These installations require power distribution from utility connections and transformers to switchgear and multiple charging units. Bus duct provides a potential solution for high-current distribution across charging facilities where several chargers are installed within a concentrated area. The International Energy Agency (IEA), in its Global EV Outlook 2026, reported that global public EV charging infrastructure expanded by more than 33% in 2025, with nearly 1.8 million public charging points added during the year, taking the worldwide total to more than 7 million by year-end. The average rated power of public charging points also increased, reflecting the growing deployment of fast and ultra-fast charging infrastructure. This expansion is driving potential demand for bus duct by increasing the electrical distribution requirements of large charging hubs, fleet depots and highway charging facilities. As operators install more high-power chargers and expand site capacity, the electrical network must distribute higher aggregate loads from transformers and switchgear to multiple charger groups. Bus duct can provide a compact, high-current distribution solution for these installations, particularly where centralized power delivery, organized routing and future capacity expansion are priorities. The strongest opportunity lies in large-scale charging facilities rather than individual chargers, where conventional cabling may remain more suitable depending on site design and economics.

Restraint: Continued competitiveness of cable-based distribution in low-complexity installations

Bus duct systems compete with conventional power cables for electrical distribution between transformers, switchgear, distribution boards, and downstream equipment. Cables offer greater routing flexibility around structural obstacles and can be installed through existing conduits, trays, and restricted spaces without requiring a continuous, prefabricated trunking route. In installations with short distribution distances, relatively few connection points or dispersed electrical loads, cable-based systems can meet power distribution requirements without the additional structural planning associated with bus duct. Consequently, the technical and operational advantages of bus duct are not equally valuable across all applications. This limits bus duct market penetration in smaller commercial buildings, low-capacity industrial facilities and projects where electrical loads are widely dispersed. When installation flexibility and straightforward routing outweigh the benefits of modular power distribution, project developers may favor conventional cables. This substitution restricts bus duct adoption in applications where its high-current capacity, compact configuration and connection flexibility do not provide sufficient advantages to justify changing the distribution architecture. As a result, bus duct demand remains concentrated in applications with substantial power requirements, dense equipment layouts or a strong need for structured distribution.

Opportunity: Intelligent monitoring and predictive maintenance for service-based revenue generation

Intelligent monitoring presents an opportunity for bus duct manufacturers to extend their offerings beyond conventional power distribution equipment into condition-monitoring and maintenance solutions. These systems can incorporate temperature sensors, current monitoring, communication modules and analytics to identify abnormal heating at joints, uneven load distribution and potential equipment deterioration. Manufacturers can integrate monitoring capabilities into new bus duct installations or offer retrofit solutions for existing systems, enabling facility operators to monitor electrical distribution conditions between scheduled inspections. Eaton, for example, offers continuous thermal monitoring solutions for busway joints, demonstrating the availability of monitoring technologies for this application. This opportunity can help manufacturers develop recurring aftermarket revenue through monitoring equipment, maintenance agreements, equipment-health reporting and predictive maintenance services. It also creates scope for differentiation in facilities where unexpected electrical failures can disrupt production or critical operations. By combining bus duct supply with ongoing monitoring and maintenance support, manufacturers can strengthen customer relationships beyond the initial equipment purchase, improve service-contract opportunities and reduce dependence on new installation projects. Adoption will depend on monitoring-system costs, integration requirements and customers' willingness to pay for additional operational visibility.

Challenge: Maintaining thermal performance and joint reliability at high current ratings

Bus duct systems must maintain acceptable temperature rise, electrical continuity and mechanical integrity under their specified operating conditions. At high current ratings, conductor heating, joint resistance, installation conditions and thermal expansion become important engineering considerations. Poorly assembled or inadequately maintained connections can develop localized hot spots, while sustained high loads can increase thermal stress on joints and insulation. Manufacturers must therefore ensure that conductor sizing, joint design, enclosure configuration and connection hardware work together across the specified operating range. The International Electrotechnical Commission's IEC 61439-6 standard specifies technical characteristics and verification requirements for low-voltage busbar trunking systems. Its current revision work includes additional attention to thermal ageing of joints and temperature-rise verification. For manufacturers, achieving consistent performance across different current ratings, enclosure designs and installation conditions requires rigorous design verification, production quality control and reliable joint-assembly procedures. Failure to maintain this consistency can increase warranty exposure, complicate commissioning and damage confidence in bus duct systems used in critical facilities.

BUS DUCT MARKET: COMMERCIAL USE CASES ACROSS INDUSTRIES

COMPANY USE CASE DESCRIPTION BENEFITS
company logo
ABB supplied busway connections to interconnect four indoor power skids at a hyperscale data center, integrating switchboards, UPS modules, automatic transfer switches, and battery cabinets to support modular power distribution. Enabled the integration of prefabricated power skids and their electrical equipment, supporting modular installation and scalable power distribution for data center operations
company logo
AP Sensing and STS Group retrofitted continuous fiber-optic temperature monitoring onto an existing 2,000 A Schneider Electric busway system at a major US-based cloud computing provider's data center in Frankfurt, Germany, to detect potential overheating across connections between switch rooms and the data hall. Enabled 24/7 temperature monitoring, hotspot localization to within approximately one meter, and automatic alarms to the facility monitoring system. This improved early fault detection and supported proactive maintenance without relying solely on periodic thermal inspections

Logos and trademarks shown above are the property of their respective owners. Their use here is for informational and illustrative purposes only.

MARKET ECOSYSTEM

The bus duct ecosystem comprises multiple participants spanning raw material supply, component manufacturing, bus duct manufacturing, system integration and installation, and end use. Raw material suppliers provide essential inputs such as copper, aluminum, steel, and insulation materials, while component suppliers manufacture conductors, insulating supports, joint connectors, tap-off units, protective enclosures, and monitoring components. Bus duct manufacturers integrate these materials and components into application-specific power distribution systems for different current ratings, voltage levels, and installation environments. System integrators, electrical contractors, and EPC companies undertake system design, engineering, installation, testing, and commissioning, often coordinating with switchgear manufacturers, electrical consultants, and building developers. Regulatory bodies and standards organizations establish safety, performance, and testing requirements for bus duct systems. At the downstream end, data centers, industrial facilities, commercial buildings, utilities, and infrastructure operators represent the primary demand base for bus duct solutions.

Logos and trademarks shown above are the property of their respective owners. Their use here is for informational and illustrative purposes only.

MARKET SEGMENTS

bus-duct-market Segments

Source: Secondary Research, Interviews with Experts, MarketsandMarkets Analysis

Global Bus Duct Market, By Voltage

Medium-voltage bus ducts are expected to account for the largest share of the bus duct market, supported by their use in high-capacity power distribution networks connecting substations, transformers, generators, and major industrial loads. Its application across manufacturing plants, utility infrastructure, and large industrial installations sustains demand for reliable bulk power transmission. Meanwhile, the low-voltage bus ducts are expected to register the fastest growth, driven by increasing requirements for power distribution within data centers, commercial buildings, and automated manufacturing facilities. The expansion of rack-level power infrastructure and flexible electrical layouts is creating additional demand for low-voltage busway systems with configurable tap-off arrangements and simplified installation.

Global Bus Duct Market, By Current Rating

The 2,001–5,000 A current rating segment is expected to account for the largest share of the bus duct market during the forecast period, supported by its suitability for high-load power distribution across industrial facilities, large commercial buildings, and data centers. These systems accommodate substantial electrical loads between transformers, switchgear, and downstream distribution panels, making them suitable for installations requiring reliable power transmission across multiple circuits.

Global Bus Duct Market, By Material

Copper is expected to account for the largest market share supported by its high electrical conductivity and established use in applications requiring efficient current transmission within compact conductor assemblies. Aluminum is expected to register the fastest growth, driven by its lower weight, reduced structural loading, and potential to lower conductor material costs in extensive distribution networks.

Global Bus Duct Market, By Type

The non-segregated phase bus duct segment is expected to account for the largest share and register the fastest growth in the bus duct market. Its common-enclosure configuration supports practical integration into standard electrical distribution layouts, including feeder connections and transformer-to-switchboard links. Compatibility with established installation practices and broad applicability across industrial and commercial facilities support its continued adoption.

Global Bus Duct Market, By End User

The data center segment is expected to register the highest CAGR in the bus duct market during the forecast period, supported by increasing deployment of AI infrastructure, high-density computing, and hyperscale facilities. Rising rack power requirements and phased data center expansion are increasing demand for overhead busway systems with flexible tap-off points, enabling power distribution to be adapted as server configurations and electrical loads evolve.

REGION

Asia Pacific is expected to record the highest CAGR during the forecast period

The Asia Pacific bus duct market is estimated to register the highest CAGR of 6.7% during the forecast period, supported by expanding manufacturing capacity, commercial construction, and increasing deployment of large-scale data center infrastructure. China remains a major regional demand center, driven by industrial electrification, infrastructure development, and investments in advanced computing facilities. India is emerging as an important growth market as new data centers, metro rail networks, semiconductor facilities, and industrial parks increase requirements for reliable, high-capacity electrical distribution. Meanwhile, Japan, South Korea, Singapore, and Australia are supporting demand through technology-intensive facilities, digital infrastructure, and upgrades to existing electrical systems. The growing preference for modular power distribution, faster installation, and flexible capacity expansion is strengthening the adoption of bus duct systems across new and retrofit projects. In addition, increasing requirements for compact electrical layouts and scalable power delivery in high-density data centers are creating opportunities for manufacturers offering high-current busways, configurable tap-off units, and application-specific distribution solutions.

bus-duct-market Region

BUS DUCT MARKET: COMPANY EVALUATION MATRIX

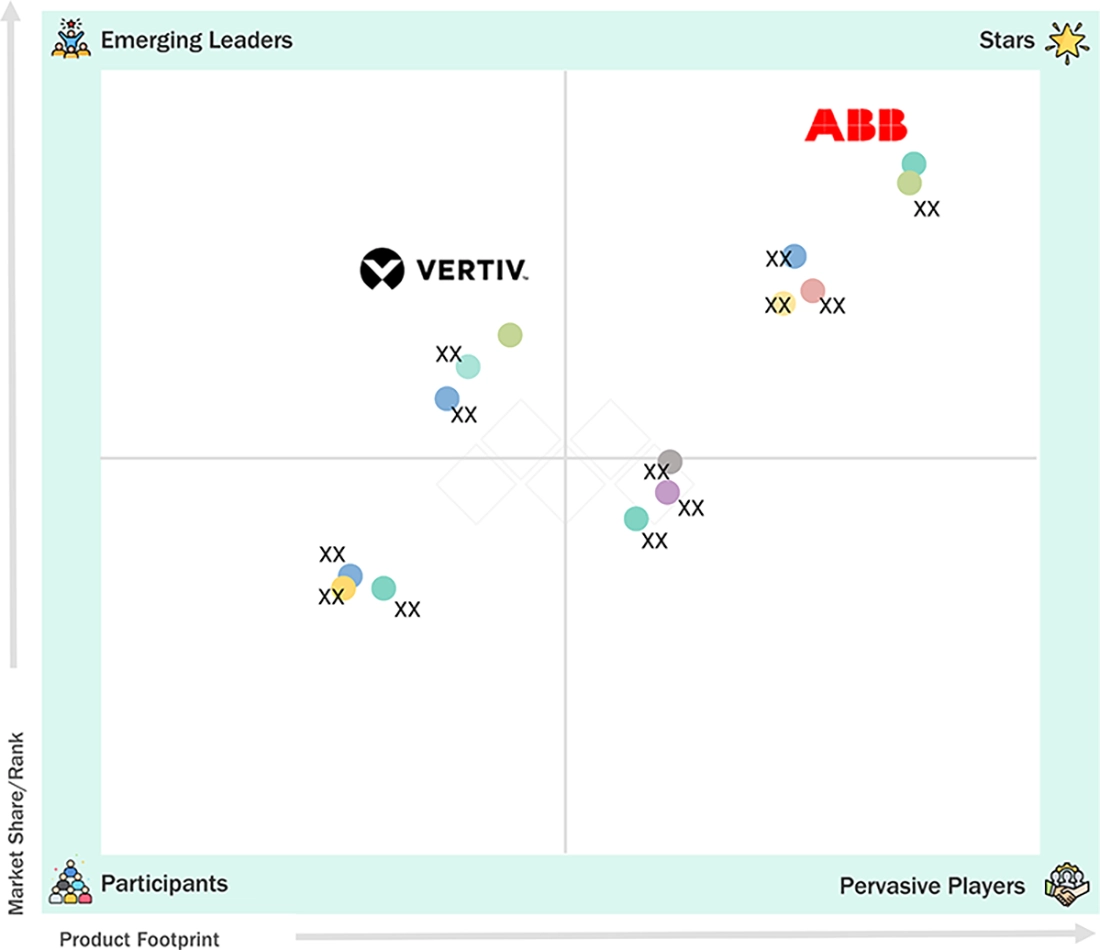
ABB, a leading electrical equipment manufacturer, is classified under the “Star” category in the bus duct market due to its extensive power distribution portfolio and established international presence. The company benefits from advanced manufacturing capabilities and a broad range of busway solutions for industrial facilities, commercial buildings, data centers, and infrastructure projects. Continuous investment in product innovation, high-capacity distribution technologies, and manufacturing expansion strengthens ABB’s competitive position and growth potential in the global bus duct market. Vertiv is classified under the "emerging player" category in the bus duct market, is expanding its presence through power distribution solutions tailored to data centers and other mission-critical facilities, positioning itself to benefit from growing demand for high-capacity, reliable, and scalable electrical infrastructure.

bus-duct-market Evaluation Metrics

Source: Secondary Research, Interviews with Experts, MarketsandMarkets Analysis

KEY MARKET PLAYERS

  • Legrand (France)
  • ABB (Switzerland)
  • Schneider Electric (France)
  • Siemens (Germany)
  • Eaton (Ireland)
  • Powell Industries (US)
  • nVent (Ireland)
  • Crown Electric Engineering and Manufacturing LLC (US)
  • Technibus, Inc. (US)
  • NOVOLECS (US)
  • BIMER Electric (Italy)
  • GKW (Gordon Kitto Welding Ltd) (UK)
  • Alfa Standard S.p.A. (Italy)
  • HOLDUCT Sp. z o.o. (Poland)
  • ELEKTROBUDOWA Sp. z o.o. (Poland)
  • Alstema (Poland)
  • EGE, spol. s r.o. (Czech Republic)
  • Alit (Italy)
  • Bharat Heavy Electricals Limited (India)
  • Powergear Limited (India)
  • Godrej Enterprises (India)
  • HYOSUNG HEAVY INDUSTRIES (South Korea)
  • LS Corp. (South Korea)
  • Daqo Group Co., Ltd. (China)
  • Beijing Power Equipment Group Co., Ltd. (China)
  • Fuxin Enclosed Busbar Co., Ltd. (China)
  • Shandong Alfa Dachie Electric Co., Ltd. (China)
  • ACTOM (South Africa)
  • Vertiv Group Corp. (US)

MARKET SCOPE

REPORT METRIC DETAILS
Market Size in 2025 (Value) USD 13.57 Billion
Market Size in 2026 (Value) USD 14.29 Billion
Market Forecast in 2031 (Value) USD 19.35 Billion
Growth Rate CAGR of 6.2% from 2026-2031
Years Considered 2022–2031
Base Year 2025
Forecast Period 2026–2031
Units Considered Value (USD Billion)/Volume (Thousand Units)
Report Coverage Market size and forecast, company profiling, competitive landscape, market dynamics (drivers, restraints, opportunities, and challenges), technology trends, ecosystem analysis, commercial use cases, and regional analysis
Segments Covered
  • By Material: Copper and Aluminum
  • By Type:
    • Isolated-phase Bus Duct
    • Segregated Phase Bus Duct
    • and Non-segregated Phase Bus Duct
  • By Voltage:
    • Low (≤1 kV)
    • Medium (>1–35 kV) and High (>35 kV)
  • By Current Rating:
    • Up to 800 A
    • 801–2
    • 000 A
    • 2
    • 001–5
    • 000 A and Above 5
    • 000 A
  • End User:
    • Utilities
    • Industries
    • Commercial
    • Datacenters
    • Renewables
    • EV Charging Infrastructure
    • and Other End Users
Regions Covered North America, Europe, Asia Pacific, Middle East & Africa, and South America

WHAT IS IN IT FOR YOU: BUS DUCT MARKET REPORT CONTENT GUIDE

bus-duct-market Content Guide

DELIVERED CUSTOMIZATIONS

We have successfully delivered the following deep-dive customizations:

CLIENT REQUEST CUSTOMIZATION DELIVERED VALUE ADDS
Global Bus Duct Market Across Data Center Applications Market sizing and forecasting of the global bus duct market for data centers, segmented by current rating, conductor material, data center type, and region. The study assessed demand across hyperscale, colocation, and enterprise data centers, considering power density, electrical infrastructure requirements, and the adoption of high-capacity busway systems. Provided data center-specific market insights to identify growth opportunities across current-rating segments and power distribution applications. The analysis evaluated demand for high-capacity bus ducts, modular power distribution systems, and scalable electrical infrastructure, while assessing regional data center expansion, evolving power requirements, competitive positioning, and key manufacturers serving the global data center bus duct market.

RECENT DEVELOPMENTS

  • April 2026 : ABB and Rittal established a global technology partnership to jointly develop electrical infrastructure solutions for European and international markets. The collaboration combines ABB’s low-voltage switchgear and UPS technologies with Rittal’s RiLineX busbar platform and Ri4Power modular distribution systems, aiming to improve compatibility, accelerate engineering and installation, and simplify power distribution.
  • March 2025 : ABB announced an additional investment of approximately USD 75 million in India during 2026 to expand manufacturing and research capabilities across five locations. The initiative covers electrification, motion and automation, including circuit breakers, power protection and switchgear. It supports domestic production, infrastructure growth, renewable energy, metro rail and data center demand.
  • June 2025 : Schneider Electric introduced a prefabricated modular data-center solution integrating power busway, liquid cooling, and high-density racks. Designed for AI and high-performance computing environments, the architecture supports pods of up to 1 MW and beyond. This development expands the company's integrated deployment offering and creates a relevant application opportunity for high-capacity busway systems.
  • May 2025 : Eaton announced that its Mobility Group will be producing power connection components at its Holzhausen, Germany facility, marking the first time the product line being manufactured in Europe. The initial product to be manufactured at this facility is a stamped eyelet terminal used in low-voltage power systems, with plans to expand the portfolio to include battery terminals, busbars and other connection systems.


Table of Contents

checkmarkExclusive indicates content/data unique to MarketsandMarkets and not available with any competitors.

TITLE
PAGE NO
1
INTRODUCTION


28
2
EXECUTIVE SUMMARY


34
3
PREMIUM INSIGHTS


40
4
MARKET OVERVIEW
High-power EV charging and data center growth drive market expansion amid cost and space challenges.


44
 
4.1
INTRODUCTION


4.2
MARKET DYNAMICS


4.2.1
DRIVERS


4.2.1.1
EXPANSION OF HIGH-POWER EV CHARGING INFRASTRUCTURE


4.2.1.2
RISING INDUSTRIAL ELECTRIFICATION AND HIGHER POWER LOADS


4.2.1.3
EXPANSION OF HYPERSCALE DATA CENTERS AND HIGH-DENSITY COMPUTING INFRASTRUCTURE


4.2.2
RESTRAINTS


4.2.2.1
FLEXIBILITY AND COST ADVANTAGES OF CONVENTIONAL CABLE-BASED DISTRIBUTION


4.2.2.2
SPACE CONSTRAINTS AND INSTALLATION COMPLEXITY IN RETROFIT PROJECTS


4.2.3
OPPORTUNITIES


4.2.3.1
EXPANSION OF VALUE-ADDED MONITORING AND AFTERMARKET SERVICES


4.2.3.2
MODERNIZATION OF AGING ELECTRICAL DISTRIBUTION INFRASTRUCTURE


4.2.3.3
INCREASING INVESTMENT IN GRID MODERNIZATION AND INTELLIGENT ELECTRIC DISTRIBUTION


4.2.4
CHALLENGES


4.2.4.1
MAINTAINING THERMAL PERFORMANCE AND JOINT RELIABILITY AT HIGH CURRENT RATINGS


4.2.4.2
COPPER AND ALUMINUM PRICE VOLATILITY AND ITS IMPACT ON COST MANAGEMENT


4.3
UNMET NEEDS AND WHITE SPACES


4.4
INTERCONNECTED MARKETS AND CROSS-SECTOR OPPORTUNITIES


4.5
EMERGING BUSINESS MODELS AND ECOSYSTEM SHIFTS


4.6
STRATEGIC MOVES BY TIER 1/2/3 PLAYERS


5
INDUSTRY TRENDS
AI-driven data centers propel demand for innovative, modular bus duct systems amidst market volatility.


60
 
5.1
PORTER’S FIVE FORCES ANALYSIS


5.1.1
INTENSITY OF COMPETITIVE RIVALRY


5.1.2
THREAT OF NEW ENTRANTS


5.1.3
BARGAINING POWER OF SUPPLIERS


5.1.4
BARGAINING POWER OF BUYERS


5.1.5
THREAT OF SUBSTITUTES


5.2
MACROECONOMIC OUTLOOK


5.2.1
INTRODUCTION


5.2.1.1
GLOBAL INFRASTRUCTURE INVESTMENT AND INDUSTRIAL CAPITAL EXPENDITURE


5.2.1.2
COPPER AND ALUMINUM PRICE VOLATILITY


5.2.1.3
INTEREST RATES, CREDIT AVAILABILITY, AND PROJECT FINANCING


5.2.2
GDP TRENDS AND FORECAST


5.2.3
TREND IN HIGH-DENSITY BUS DUCT SYSTEMS FOR AI-DRIVEN DATA CENTERS


5.2.4
TREND IN INTELLIGENT BUS DUCT MONITORING AND PREDICTIVE MAINTENANCE


5.2.5
TREND IN MODULAR AND RECONFIGURABLE POWER DISTRIBUTION ARCHITECTURES


5.3
VALUE CHAIN ANALYSIS


5.4
ECOSYSTEM ANALYSIS


5.5
PRICING ANALYSIS


5.5.1
PRICING RANGE OF BUS DUCT, BY MATERIAL, 2025


5.5.2
AVERAGE SELLING PRICE TREND OF BUS DUCT, BY REGION, 2022–2025


5.6
TRADE ANALYSIS


5.6.1
IMPORT SCENARIO (HS CODE 853690)


5.6.2
EXPORT SCENARIO (HS CODE 853690)


5.7
KEY CONFERENCES AND EVENTS, 2027


5.8
TRENDS/DISRUPTIONS IMPACTING CUSTOMER BUSINESS


5.9
CASE STUDY ANALYSIS


5.9.1
LEGRAND’S BUSBAR TRUNKING ENABLES SCALABLE POWER DISTRIBUTION AT HYPERSCALE DATA CENTER CAMPUS


5.9.2
SCHNEIDER ELECTRIC’S CANALIS BUSWAY SUPPORTS FLEXIBLE AND SAFE POWER DISTRIBUTION IN SHIPBUILDING


5.9.3
VERTIV POWERBAR BUSWAY STRENGTHENS POWER CONTINUITY FOR GLOBAL BANK


5.10
IMPACT OF 2025–2026 US TARIFFS – GLOBAL BUS DUCT MARKET


5.10.1
INTRODUCTION


5.10.2
KEY HISTORICAL TARIFF RATES


5.10.3
PRICE IMPACT ANALYSIS


5.10.4
IMPACT ON REGIONS


5.10.4.1
NORTH AMERICA


5.10.4.2
ASIA PACIFIC


5.10.4.3
EUROPE


5.10.4.4
MIDDLE EAST & AFRICA


5.10.4.5
SOUTH AMERICA


5.10.5
IMPACT ON END USERS


6
TECHNOLOGICAL ADVANCES, AI-DRIVEN IMPACT, PATENTS, INNOVATIONS, AND FUTURE APPLICATIONS
AI-driven bus duct innovations redefine power infrastructure with autonomous, predictive, and interconnected systems.


86
 
6.1
KEY EMERGING TECHNOLOGIES


6.1.1
SMART BUS DUCTS WITH IOT-ENABLED CONDITION MONITORING


6.1.2
AI-READY, HIGH-CURRENT-DENSITY BUS DUCT SYSTEMS


6.2
COMPLEMENTARY TECHNOLOGIES


6.2.1
INTELLIGENT POWER PROTECTION AND SELECTIVE COORDINATION SYSTEMS


6.2.2
DIGITAL TWINS AND BIM-BASED ELECTRICAL INFRASTRUCTURE DESIGN


6.3
ADJACENT TECHNOLOGIES


6.3.1
SOLID-STATE TRANSFORMERS AND ADVANCED POWER CONVERSION SYSTEMS


6.3.2
BATTERY ENERGY STORAGE SYSTEMS AND GRID-FORMING POWER ELECTRONICS


6.4
TECHNOLOGY/PRODUCT ROADMAP


6.4.1
SHORT-TERM (2026–2028) | DIGITALIZED, HIGH-CAPACITY, AND INSTALLATION-OPTIMIZED BUS DUCTS


6.4.2
MID-TERM (2029–2031) | PREDICTIVE, DC-COMPATIBLE, AND ADAPTIVE BUS DUCT NETWORKS


6.4.3
LONG-TERM (2032–2035+) | AUTONOMOUS, SELF-MONITORING, AND DIGITALLY INTEGRATED BUS DUCT PLATFORMS


6.5
PATENT ANALYSIS


6.6
FUTURE APPLICATIONS


6.7
IMPACT OF AI/GEN AI ON GLOBAL BUS DUCT MARKET


6.7.1
TOP USE CASES AND MARKET POTENTIAL


6.7.2
BEST PRACTICES FOLLOWED BY OEMS IN BUS DUCT PROCESSING


6.7.3
DIGITAL MONITORING AND ENGINEERING FOUNDATIONS FOR AI IN BUS DUCTS


6.7.4
INTERCONNECTED ECOSYSTEM AND IMPACT ON MARKET PLAYERS


6.8
SUCCESS STORIES AND REAL-WORLD APPLICATIONS


7
REGULATORY LANDSCAPE AND SUSTAINABILITY INITIATIVES
Navigate complex global regulations shaping sustainability in the bus duct market.


99
 
7.1
REGIONAL REGULATIONS AND COMPLIANCE


7.1.1
REGULATORY BODIES, GOVERNMENT AGENCIES, AND OTHER ORGANIZATIONS


7.1.2
INDUSTRY STANDARDS


7.2
SUSTAINABILITY INITIATIVES


7.3
IMPACT OF REGULATORY POLICIES ON SUSTAINABILITY INITIATIVES


7.4
CERTIFICATIONS, LABELING, AND ECO-STANDARDS


8
CUSTOMER LANDSCAPE AND BUYER BEHAVIOR
Navigate complex buyer dynamics to unlock unmet needs and maximize market profitability.


104
 
8.1
INTRODUCTION


8.2
DECISION-MAKING PROCESS


8.3
KEY STAKEHOLDERS INVOLVED IN BUYING PROCESS AND THEIR EVALUATION CRITERIA


8.3.1
KEY STAKEHOLDERS IN BUYING PROCESS


8.3.2
BUYING CRITERIA


8.4
ADOPTION BARRIERS AND INTERNAL CHALLENGES


8.5
UNMET NEEDS OF VARIOUS END USERS


8.6
MARKET PROFITABILITY


9
BUS DUCT MARKET, BY TYPE
Market Size & Growth Rate Forecast Analysis to 2031 in USD Million | 8 Data Tables


111
 
9.1
INTRODUCTION


9.2
ISOLATED PHASE BUS DUCT


9.2.1
ABILITY TO OFFER RELIABLE AND HIGH-CAPACITY POWER TRANSMISSION FOR LARGE POWER PLANTS TO DRIVE DEMAND


9.3
SEGREGATED PHASE BUS DUCT


9.3.1
POTENTIAL TO OFFER COST-EFFECTIVE PHASE PROTECTION FOR MEDIUM-VOLTAGE DISTRIBUTION TO SUPPORT MARKET GROWTH


9.4
NON-SEGREGATED PHASE BUS DUCT


9.4.1
ECONOMICAL DESIGN AND EASY CAPACITY UPGRADES TO DRIVE ADOPTION ACROSS INDUSTRIES


10
BUS DUCT MARKET, BY MATERIAL
Market Size & Growth Rate Forecast Analysis to 2031 in USD Million | 6 Data Tables


117
 
10.1
INTRODUCTION


10.2
COPPER


10.2.1
HIGH CONDUCTIVITY AND COMPACT DESIGN FOR HIGH-CURRENT INSTALLATIONS TO SUSTAIN MARKET LEADERSHIP


10.3
ALUMINUM


10.3.1
LOWER MATERIAL COST AND LIGHTER WEIGHT FOR LARGE-SCALE PROJECTS TO FOSTER MARKET GROWTH


11
BUS DUCT MARKET, BY VOLTAGE
Market Size & Growth Rate Forecast Analysis to 2031 in USD Million | 8 Data Tables


122
 
11.1
INTRODUCTION


11.2
LOW (≤1 KV)


11.2.1
SPACE-EFFICIENT DISTRIBUTION FOR DATA CENTERS AND COMMERCIAL BUILDINGS TO BOOST DEMAND


11.3
MEDIUM (>1–35 KV)


11.3.1
RELIABLE DISTRIBUTION FOR INDUSTRIAL PLANTS AND GENERATION ASSETS TO CONTRIBUTE TO MARKET GROWTH


11.4
HIGH (>35 KV)


11.4.1
ENGINEERED HIGH-CAPACITY TRANSMISSION FOR LARGE GENERATING UNITS TO SUPPORT STEADY DEMAND


12
BUS DUCT MARKET, BY CURRENT RATING
Market Size & Growth Rate Forecast Analysis to 2031 in USD Million | 2 Data Tables


128
 
12.1
INTRODUCTION


12.2
UP TO 800 A


12.2.1
COMPACT, MODULAR DISTRIBUTION FOR SMALLER COMMERCIAL AND INDUSTRIAL FACILITIES TO FACILITATE DEMAND


12.3
801–2,000 A


12.3.1
VERSATILE LOAD HANDLING CAPACITY FOR LARGE COMMERCIAL AND MID-SIZED INDUSTRIAL SITES TO REINFORCE DEMAND


12.4
2,001–5,000 A


12.4.1
NEED FOR HIGH CURRENT CAPACITY ACROSS LARGE INDUSTRIAL FACILITIES AND DATA CENTERS TO ACCELERATE DEMAND


12.5
ABOVE 5,000 A


12.5.1
POTENTIAL TO ADDRESS APPLICATIONS DEMANDING ULTRA-HIGH CURRENT-CARRYING CAPACITY TO BOOST SEGMENTAL GROWTH


13
BUS DUCT MARKET, BY END USER
Market Size & Growth Rate Forecast Analysis to 2031 in USD Million | 16 Data Tables


132
 
13.1
INTRODUCTION


13.2
UTILITIES


13.2.1
REQUIREMENT FOR HIGH-CAPACITY GENERATOR CONNECTIONS FOR NEW AND MODERNIZED POWER PLANTS TO SPIKE DEMAND


13.3
INDUSTRIAL


13.3.1
NEED FOR FLEXIBLE, HIGH-LOAD DISTRIBUTION FOR EXPANDING AND ELECTRIFYING FACTORIES TO SUPPORT MARKET GROWTH


13.4
COMMERCIAL


13.4.1
ADOPTION OF FLEXIBLE MULTI-FLOOR DISTRIBUTION SYSTEMS IN LARGE COMMERCIAL BUILDINGS TO FUEL MARKET GROWTH


13.5
DATA CENTERS


13.5.1
GROWING DEMAND FOR AI COMPUTING AND DEPENDABLE ELECTRICAL DISTRIBUTION TO CONTRIBUTE TO MARKET GROWTH


13.6
RENEWABLE ENERGY PLANTS


13.6.1
NECESSITY FOR RELIABLE CONNECTIONS IN SOLAR, WIND, AND STORAGE PROJECTS TO CREATE GROWTH OPPORTUNITIES TO SUPPORT MARKET EXPANSION


13.7
EV CHARGING INFRASTRUCTURE


13.7.1
EXPANDING EV CHARGING NETWORKS TO CREATE OPPORTUNITIES


13.8
OTHER END USERS


14
BUS DUCT MARKET, BY REGION
Comprehensive coverage of 9 Regions with country-level deep-dive of 18 Countries | 104 Data Tables.


142
 
14.1
INTRODUCTION


14.2
ASIA PACIFIC


14.2.1
CHINA


14.2.1.1
SIGNIFICANT INVESTMENTS IN COMPUTING INFRASTRUCTURE AND RENEWABLE ENERGY PROJECTS TO ACCELERATE BUS DUCT DEMAND


14.2.2
JAPAN


14.2.2.1
EXPANSION OF SEMICONDUCTOR MANUFACTURING CAPACITY TO CONTRIBUTE TO MARKET GROWTH


14.2.3
SOUTH KOREA


14.2.3.1
EXPANSION OF SEMICONDUCTOR FABRICATION FACILITIES TO FACILITATE BUS DUCT DEMAND


14.2.4
INDIA


14.2.4.1
HIGH INVESTMENTS IN GREENFIELD DATA CENTER PROJECTS TO INCREASE BUS DUCT DEPLOYMENT


14.2.5
REST OF ASIA PACIFIC


14.3
NORTH AMERICA


14.3.1
US


14.3.1.1
INDUSTRIAL ELECTRIFICATION AND DOMESTIC MANUFACTURING EXPANSION TO ACCELERATE BUS DUCT DEMAND


14.3.2
CANADA


14.3.2.1
MINING, DIGITAL INFRASTRUCTURE, AND FACILITY UPGRADES TO STRENGTHEN BUS DUCT ADOPTION


14.3.3
MEXICO


14.3.3.1
GROWING FOCU ON MANUFACTURING CAPACITY EXPANSION AND NEARSHORING TO CREATE MARKET GROWTH OPPORTUNITIES


14.4
EUROPE


14.4.1
GERMANY


14.4.1.1
GROWING INVESTMENT IN DATA CENTER EXPANSION TO REINFORCE MARKET GROWTH


14.4.2
FRANCE


14.4.2.1
RISING FOCUS ON STRENGTHENING DOMESTIC AI COMPUTING CAPACITY TO CONTRIBUTE TO MARKET GROWTH


14.4.3
ITALY


14.4.3.1
MODERNIZATION OF AGING INDUSTRIAL FACILITIES TO STIMULATE BUS DUCT DEMAND


14.4.4
UK


14.4.4.1
URGENT NEED TO UPGRADE EXISTING COMMERCIAL AND INDUSTRIAL BUILDINGS TO BOOST BUS DUCT IMPLEMENTATION


14.4.5
SPAIN


14.4.5.1
RENEWABLE ENERGY INVESTMENTS TO STRENGTHEN BUS DUCT DEMAND


14.4.6
REST OF EUROPE


14.5
MIDDLE EAST & AFRICA


14.5.1
GCC


14.5.1.1
SAUDI ARABIA


14.5.1.1.1
GROWING INVESTMENT IN VISION 2030 PROJECTS TO DRIVE MARKET


14.5.1.2
UAE


14.5.1.2.1
HYPERSCALE DATA CENTERS AND COMMERCIAL CONSTRUCTION PROJECTS TO STRENGTHEN DEMAND


14.5.1.3
REST OF GCC


14.5.2
SOUTH AFRICA


14.5.2.1
MINING MODERNIZATION AND ELECTRICITY INFRASTRUCTURE UPGRADES TO SUSTAIN DEMAND


14.5.3
EGYPT


14.5.3.1
INDUSTRIAL EXPANSION AND PETROLEUM INFRASTRUCTURE MODERNIZATION TO SUPPORT MARKET GROWTH


14.5.4
REST OF MIDDLE EAST & AFRICA


14.6
SOUTH AMERICA


14.6.1
BRAZIL


14.6.1.1
DATA CENTER EXPANSION AND INDUSTRIAL MODERNIZATION TO FUEL MARKET GROWTH


14.6.2
ARGENTINA


14.6.2.1
INVESTMENTS IN UPGRADING ENERGY AND MINING INFRASTRUCTURE TO CREATE GROWTH OPPORTUNITIES


14.6.3
REST OF SOUTH AMERICA


15
COMPETITIVE LANDSCAPE
Discover market leaders' strategies and growth potential through detailed competitive and revenue analyses.


198
 
15.1
OVERVIEW


15.2
KEY PLAYER COMPETITIVE STRATEGIES/RIGHT TO WIN, 2023–2026


15.3
REVENUE ANALYSIS, 2021–2025


15.4
MARKET SHARE ANALYSIS, 2025


15.5
COMPANY EVALUATION MATRIX: KEY PLAYERS, 2025


15.5.1
STARS


15.5.2
EMERGING LEADERS


15.5.3
PERVASIVE PLAYERS


15.5.4
PARTICIPANTS


15.5.5
COMPANY FOOTPRINT: KEY PLAYERS, 2025


15.5.5.1
REGION FOOTPRINT


15.5.5.2
MATERIAL FOOTPRINT


15.5.5.3
TYPE FOOTPRINT


15.5.5.4
CURRENT RATING FOOTPRINT


15.5.5.5
VOLTAGE FOOTPRINT


15.5.5.6
END USER FOOTPRINT


15.6
COMPANY EVALUATION MATRIX: STARTUPS/SMES, 2025


15.6.1
PROGRESSIVE COMPANIES


15.6.2
RESPONSIVE COMPANIES


15.6.3
DYNAMIC COMPANIES


15.6.4
STARTING BLOCKS


15.6.5
COMPETITIVE BENCHMARKING: STARTUPS/SMES, 2025


15.6.5.1
DETAILED LIST OF KEY STARTUPS/SMES


15.6.5.2
STARTUPS/SMES FOOTPRINT


15.6.5.2.1
REGION FOOTPRINT


15.6.5.2.2
MATERIAL FOOTPRINT


15.6.5.2.3
TYPE FOOTPRINT


15.6.5.2.4
CURRENT RATING FOOTPRINT


15.6.5.2.5
VOLTAGE FOOTPRINT


15.6.5.2.6
END USER FOOTPRINT
 
 
15.7
COMPANY VALUATION AND FINANCIAL METRICS


15.8
BRAND COMPARISON


15.8.1
ABB (SWITZERLAND)


15.8.2
SCHNEIDER ELECTRIC (FRANCE)


15.8.3
SIEMENS (GERMANY)


15.8.4
EATON (IRELAND)


15.8.5
LEGRAND (FRANCE)


15.9
COMPETITIVE SCENARIO


15.9.1
PRODUCT LAUNCHES


15.9.2
DEALS


15.9.3
EXPANSIONS


16
COMPANY PROFILES
In-depth Company Profiles of Leading Market Players with detailed Business Overview, Product and Service Portfolio, Recent Developments, and Unique Analyst Perspective (MnM View)


224
 
16.1
KEY PLAYERS


16.1.1
ABB


16.1.1.1
BUSINESS OVERVIEW


16.1.1.2
PRODUCTS/SOLUTIONS/SERVICES OFFERED


16.1.1.3
RECENT DEVELOPMENTS


16.1.1.3.1
DEALS


16.1.1.3.2
EXPANSIONS


16.1.1.3.3
OTHER DEVELOPMENTS


16.1.1.4
MNM VIEW


16.1.1.4.1
KEY STRENGTHS/RIGHT TO WIN


16.1.1.4.2
STRATEGIC CHOICES


16.1.1.4.3
WEAKNESSES/COMPETITIVE THREATS


16.1.2
SCHNEIDER ELECTRIC


16.1.3
SIEMENS


16.1.4
EATON


16.1.5
LEGRAND


16.1.6
LS CORP.


16.1.7
VERTIV GROUP CORP.


16.1.8
GODREJ ENTERPRISES


16.1.9
POWELL INDUSTRIES


16.1.10
NVENT


16.1.11
HYOSUNG HEAVY INDUSTRIES


16.1.12
NOVOLECS


16.1.13
BHARAT HEAVY ELECTRICALS LIMITED


16.1.14
CROWN ELECTRIC ENGINEERING AND MANUFACTURING LLC


16.1.15
TECHNIBUS, INC.


16.1.16
BIMER ELECTRIC


16.1.17
GKW (GORDON KITTO WELDING LTD)


16.1.18
ALFA STANDARD S.P.A.


16.1.19
HOLDUCT SP. Z O.O.


16.1.20
ELEKTROBUDOWA SP. Z O. O.


16.1.21
ALSTEMA


16.1.22
EGE


16.1.23
ALIT


16.1.24
POWERGEAR LIMITED


16.1.25
DAQO GROUP CO., LTD.


16.1.26
BEIJING POWER EQUIPMENT GROUP CO., LTD.


16.1.27
FUXIN ENCLOSED BUSBAR CO., LTD.


16.1.28
ACTOM


16.1.29
SHANDONG ALFA DACHI ELECTRIC CO., LTD.


17
RESEARCH METHODOLOGY


299
 
17.1
RESEARCH DATA


17.1.1
SECONDARY DATA


17.1.1.1
LIST OF KEY SECONDARY SOURCES


17.1.1.2
KEY DATA FROM SECONDARY SOURCES


17.1.2
PRIMARY DATA


17.1.2.1
KEY DATA FROM PRIMARY SOURCES


17.1.2.2
LIST OF PRIMARY INTERVIEW PARTICIPANTS


17.1.2.3
KEY INDUSTRY INSIGHTS


17.1.2.4
BREAKDOWN OF PRIMARY INTERVIEWS


17.2
MARKET SIZE ESTIMATION


17.2.1
BOTTOM-UP APPROACH


17.2.2
TOP-DOWN APPROACH


17.2.3
MARKET SIZE CALCULATION FOR BASE YEAR


17.2.3.1
DEMAND-SIDE ANALYSIS


17.2.3.1.1
DEMAND-SIDE ASSUMPTIONS


17.2.3.1.2
DEMAND-SIDE CALCULATIONS


17.2.3.2
SUPPLY-SIDE ANALYSIS


17.2.3.2.1
SUPPLY-SIDE ASSUMPTIONS


17.2.3.2.2
SUPPLY-SIDE CALCULATIONS
 
 
17.3
MARKET FORECAST APPROACH


17.3.1
DEMAND SIDE


17.3.2
SUPPLY SIDE


17.4
DATA TRIANGULATION


17.5
FACTOR ANALYSIS


17.6
RESEARCH ASSUMPTIONS AND LIMITATIONS


17.7
RISK ANALYSIS


18
APPENDIX


316
 
18.1
INSIGHTS FROM INDUSTRY EXPERTS


18.2
DISCUSSION GUIDE


18.3
KNOWLEDGESTORE: MARKETSANDMARKETS’ SUBSCRIPTION PORTAL


18.4
CUSTOMIZATION OPTIONS


18.5
RELATED REPORTS


18.6
AUTHOR DETAILS


LIST OF TABLES


TABLE 1
BUS DUCT MARKET: INCLUSIONS AND EXCLUSIONS


TABLE 2
BUS DUCT MARKET: SUMMARY OF CHANGES


TABLE 3
GRADE A COPPER CATHODE VS. ALUMINUM PRICE RATE (USD PER METRIC TON)


TABLE 4
INTERCONNECTED MARKETS


TABLE 5
KEY MOVES AND STRATEGIC FOCUS OF TIER 1/2/3 PLAYERS


TABLE 6
IMPACT OF PORTER’S FIVE FORCES


TABLE 7
GDP PERCENTAGE CHANGE, BY COUNTRY, 2021–2029


TABLE 8
ROLE OF COMPANIES IN BUS DUCT ECOSYSTEM


TABLE 9
PRICING RANGE OF BUS DUCTS, BY MATERIAL, 2025 (USD/METER)


TABLE 10
AVERAGE SELLING PRICE TREND OF BUS DUCT, BY REGION, 2022–2025 (USD/METER)


TABLE 11
IMPORT DATA FOR HS CODE 853690-COMPLIANT PRODUCTS, BY COUNTRY, 2021–2025 (USD THOUSAND)


TABLE 12
EXPORT DATA FOR HS CODE 853690-COMPLIANT PRODUCTS, BY COUNTRY, 2021–2025 (USD THOUSAND)


TABLE 13
BUS DUCT MARKET: LIST OF KEY CONFERENCES AND EVENTS, 2027


TABLE 14
LEGRAND: ZUCCHINI BUSBAR TRUNKING AND STARLINE TRACK BUSWAY DEPLOYMENT IN INDIA


TABLE 15
SCHNEIDER ELECTRIC: CANALIS BUSBAR TRUNKING CONTRACT FOR MEYER GROUP’S CRUISE SHIP CONSTRUCTION


TABLE 16
VERTIV: POWERBAR IMPB BUSWAY DEPLOYMENT FOR BANK’S COLOCATION-BASED IT INFRASTRUCTURE


TABLE 17
US-ADJUSTED RECIPROCAL TARIFF RATES


TABLE 18
EXPECTED CHANGE IN PRICES AND POTENTIAL IMPACT ON MARKET PLAYERS DUE TO TARIFFS


TABLE 19
LIST OF PATENTS, 2025–2026


TABLE 20
AI AND HYPERSCALE DATA CENTERS


TABLE 21
BATTERY ENERGY STORAGE AND RENEWABLE INTEGRATION


TABLE 22
FLEXIBLE INDUSTRIAL MANUFACTURING


TABLE 23
HIGH-POWER EV CHARGING INFRASTRUCTURE


TABLE 24
SMART COMMERCIAL BUILDINGS AND CAMPUSES


TABLE 25
TOP USE CASES AND MARKET POTENTIAL


TABLE 26
BEST PRACTICES: COMPANIES IMPLEMENTING USE CASES


TABLE 27
BUS DUCT MARKET: CASE STUDIES RELATED TO GEN AI IMPLEMENTATION


TABLE 28
INTERCONNECTED ECOSYSTEM AND IMPACT ON BUS DUCT MARKET PLAYERS


TABLE 29
NORTH AMERICA: REGULATORY BODIES, GOVERNMENT AGENCIES, AND OTHER ORGANIZATIONS


TABLE 30
ASIA PACIFIC: REGULATORY BODIES, GOVERNMENT AGENCIES, AND OTHER ORGANIZATIONS


TABLE 31
EUROPE: REGULATORY BODIES, GOVERNMENT AGENCIES, AND OTHER ORGANIZATIONS


TABLE 32
MIDDLE EAST & AFRICA: REGULATORY BODIES, GOVERNMENT AGENCIES, AND OTHER ORGANIZATIONS


TABLE 33
SOUTH AMERICA: REGULATORY BODIES, GOVERNMENT AGENCIES, AND OTHER ORGANIZATIONS


TABLE 34
GLOBAL INDUSTRY STANDARDS IN BUS DUCT MARKET


TABLE 35
CERTIFICATIONS, LABELING, AND ECO-STANDARDS IN BUS DUCT MARKET


TABLE 36
INFLUENCE OF STAKEHOLDERS ON BUYING PROCESS FOR KEY END USERS (%)


TABLE 37
KEY BUYING CRITERIA FOR KEY END USERS


TABLE 38
BUS DUCT MARKET: UNMET NEEDS OF KEY END USERS


TABLE 39
BUS DUCT MARKET, BY TYPE, 2022–2025 (USD MILLION)


TABLE 40
BUS DUCT MARKET, BY TYPE, 2026–2031 (USD MILLION)


TABLE 41
ISOLATED PHASE BUS DUCT MARKET, BY REGION, 2022–2025 (USD MILLION)


TABLE 42
ISOLATED PHASE BUS DUCT MARKET, BY REGION, 2026–2031 (USD MILLION)


TABLE 43
SEGREGATED PHASE BUS DUCT MARKET, BY REGION, 2022–2025 (USD MILLION)


TABLE 44
SEGREGATED PHASE BUS DUCT MARKET, BY REGION, 2026–2031 (USD MILLION)


TABLE 45
NON-SEGREGATED PHASE BUS DUCT MARKET, BY REGION, 2022–2025 (USD MILLION)


TABLE 46
NON-SEGREGATED PHASE BUS DUCT MARKET, BY REGION, 2026–2031 (USD MILLION)


TABLE 47
BUS DUCT MARKET, BY MATERIAL, 2022–2025 (USD MILLION)


TABLE 48
BUS DUCT MARKET, BY MATERIAL, 2026–2031 (USD MILLION)


TABLE 49
COPPER: BUS DUCT MARKET, BY REGION, 2022–2025 (USD MILLION)


TABLE 50
COPPER: BUS DUCT MARKET, BY REGION, 2026–2031 (USD MILLION)


TABLE 51
ALUMINUM: BUS DUCT MARKET, BY REGION, 2022–2025 (USD MILLION)


TABLE 52
ALUMINUM: BUS DUCT MARKET, BY REGION, 2026–2031 (USD MILLION)


TABLE 53
BUS DUCT MARKET, BY VOLTAGE, 2022–2025 (USD MILLION)


TABLE 54
BUS DUCT MARKET, BY VOLTAGE, 2026–2031 (USD MILLION)


TABLE 55
LOW (≤1 KV): BUS DUCT MARKET, BY REGION, 2022–2025 (USD MILLION)


TABLE 56
LOW (≤1 KV): BUS DUCT MARKET, BY REGION, 2026–2031 (USD MILLION)


TABLE 57
MEDIUM (>1–35 KV): BUS DUCT MARKET, BY REGION, 2022–2025 (USD MILLION)


TABLE 58
MEDIUM (>1–35 KV): BUS DUCT MARKET, BY REGION, 2026–2031 (USD MILLION)


TABLE 59
HIGH (>35 KV): BUS DUCT MARKET, BY REGION, 2022–2025 (USD MILLION)


TABLE 60
HIGH (>35 KV): BUS DUCT MARKET, BY REGION, 2026–2031 (USD MILLION)


TABLE 61
BUS DUCT MARKET, BY CURRENT RATING, 2022–2025 (USD MILLION)


TABLE 62
BUS DUCT MARKET, BY CURRENT RATING, 2026–2031 (USD MILLION)


TABLE 63
BUS DUCT MARKET, BY END USER, 2022–2025 (USD MILLION)


TABLE 64
BUS DUCT MARKET, BY END USER, 2026–2031 (USD MILLION)


TABLE 65
UTILITIES: BUS DUCT MARKET, BY REGION, 2022–2025 (USD MILLION)


TABLE 66
UTILITIES: BUS DUCT MARKET, BY REGION, 2026–2031 (USD MILLION)


TABLE 67
INDUSTRIAL: BUS DUCT MARKET, BY REGION, 2022–2025 (USD MILLION)


TABLE 68
INDUSTRIAL: BUS DUCT MARKET, BY REGION, 2026–2031 (USD MILLION)


TABLE 69
COMMERCIAL: BUS DUCT MARKET, BY REGION, 2022–2025 (USD MILLION)


TABLE 70
COMMERCIAL: BUS DUCT MARKET, BY REGION, 2026–2031 (USD MILLION)


TABLE 71
DATA CENTERS: BUS DUCT MARKET, BY REGION, 2022–2025 (USD MILLION)


TABLE 72
DATA CENTERS: BUS DUCT MARKET, BY REGION, 2026–2031 (USD MILLION)


TABLE 73
RENEWABLE ENERGY PLANTS: BUS DUCT MARKET, BY REGION, 2022–2025 (USD MILLION)


TABLE 74
RENEWABLE ENERGY PLANTS: BUS DUCT MARKET, BY REGION, 2026–2031 (USD MILLION)


TABLE 75
EV CHARGING INFRASTRUCTURE: BUS DUCT MARKET, BY REGION, 2022–2025 (USD MILLION)


TABLE 76
EV CHARGING INFRASTRUCTURE: BUS DUCT MARKET, BY REGION, 2026–2031 (USD MILLION)


TABLE 77
OTHER END USERS: BUS DUCT MARKET, BY REGION, 2022–2025 (USD MILLION)


TABLE 78
OTHER END USERS: BUS DUCT MARKET, BY REGION, 2026–2031 (USD MILLION)


TABLE 79
BUS DUCT MARKET, BY REGION, 2022–2025 (USD MILLION)


TABLE 80
BUS DUCT MARKET, BY REGION, 2026–2031 (USD MILLION)


TABLE 81
BUS DUCT MARKET, BY REGION, 2022–2025 (THOUSAND METERS)


TABLE 82
BUS DUCT MARKET, BY REGION, 2026–2031 (THOUSAND METERS)


TABLE 83
ASIA PACIFIC: BUS DUCT MARKET, BY COUNTRY, 2022–2025 (USD MILLION)


TABLE 84
ASIA PACIFIC: BUS DUCT MARKET, BY COUNTRY, 2026–2031 (USD MILLION)


TABLE 85
ASIA PACIFIC: BUS DUCT MARKET, BY MATERIAL, 2022–2025 (USD MILLION)


TABLE 86
ASIA PACIFIC: BUS DUCT MARKET, BY MATERIAL, 2026–2031 (USD MILLION)


TABLE 87
ASIA PACIFIC: BUS DUCT MARKET, BY TYPE, 2022–2025 (USD MILLION)


TABLE 88
ASIA PACIFIC: BUS DUCT MARKET, BY TYPE, 2026–2031 (USD MILLION)


TABLE 89
ASIA PACIFIC: BUS DUCT MARKET, BY VOLTAGE, 2022–2025 (USD MILLION)


TABLE 90
ASIA PACIFIC: BUS DUCT MARKET, BY VOLTAGE, 2026–2031 (USD MILLION)


TABLE 91
ASIA PACIFIC: BUS DUCT MARKET, BY END USER, 2022–2025 (USD MILLION)


TABLE 92
ASIA PACIFIC: BUS DUCT MARKET, BY END USER, 2026–2031 (USD MILLION)


TABLE 93
CHINA: BUS DUCT MARKET, BY END USER, 2022–2025 (USD MILLION)


TABLE 94
CHINA: BUS DUCT MARKET, BY END USER, 2026–2031 (USD MILLION)


TABLE 95
JAPAN: BUS DUCT MARKET, BY END USER, 2022–2025 (USD MILLION)


TABLE 96
JAPAN: BUS DUCT MARKET, BY END USER, 2026–2031 (USD MILLION)


TABLE 97
SOUTH KOREA: BUS DUCT MARKET, BY END USER, 2022–2025 (USD MILLION)


TABLE 98
SOUTH KOREA: BUS DUCT MARKET, BY END USER, 2026–2031 (USD MILLION)


TABLE 99
INDIA: BUS DUCT MARKET, BY END USER, 2022–2025 (USD MILLION)


TABLE 100
INDIA: BUS DUCT MARKET, BY END USER, 2026–2031 (USD MILLION)


TABLE 101
REST OF ASIA PACIFIC: BUS DUCT MARKET, BY END USER, 2022–2025 (USD MILLION)


TABLE 102
REST OF ASIA PACIFIC: BUS DUCT MARKET, BY END USER, 2026–2031 (USD MILLION)


TABLE 103
NORTH AMERICA: BUS DUCT MARKET, BY COUNTRY, 2022–2025 (USD MILLION)


TABLE 104
NORTH AMERICA: BUS DUCT MARKET, BY COUNTRY, 2026–2031 (USD MILLION)


TABLE 105
NORTH AMERICA: BUS DUCT MARKET, BY MATERIAL, 2022–2025 (USD MILLION)


TABLE 106
NORTH AMERICA: BUS DUCT MARKET, BY MATERIAL, 2026–2031 (USD MILLION)


TABLE 107
NORTH AMERICA: BUS DUCT MARKET, BY TYPE, 2022–2025 (USD MILLION)


TABLE 108
NORTH AMERICA: BUS DUCT MARKET, BY TYPE, 2026–2031 (USD MILLION)


TABLE 109
NORTH AMERICA: BUS DUCT MARKET, BY VOLTAGE, 2022–2025 (USD MILLION)


TABLE 110
NORTH AMERICA: BUS DUCT MARKET, BY VOLTAGE, 2026–2031 (USD MILLION)


TABLE 111
NORTH AMERICA: BUS DUCT MARKET, BY END USER, 2022–2025 (USD MILLION)


TABLE 112
NORTH AMERICA: BUS DUCT MARKET, BY END USER, 2026–2031 (USD MILLION)


TABLE 113
US: BUS DUCT MARKET, BY END USER, 2022–2025 (USD MILLION)


TABLE 114
US: BUS DUCT MARKET, BY END USER, 2026–2031 (USD MILLION)


TABLE 115
CANADA: BUS DUCT MARKET, BY END USER, 2022–2025 (USD MILLION)


TABLE 116
CANADA: BUS DUCT MARKET, BY END USER, 2026–2031 (USD MILLION)


TABLE 117
MEXICO: BUS DUCT MARKET, BY END USER, 2022–2025 (USD MILLION)


TABLE 118
MEXICO: BUS DUCT MARKET, BY END USER, 2026–2031 (USD MILLION)


TABLE 119
EUROPE: BUS DUCT MARKET, BY COUNTRY, 2022–2025 (USD MILLION)


TABLE 120
EUROPE: BUS DUCT MARKET, BY COUNTRY, 2026–2031 (USD MILLION)


TABLE 121
EUROPE: BUS DUCT MARKET, BY MATERIAL, 2022–2025 (USD MILLION)


TABLE 122
EUROPE: BUS DUCT MARKET, BY MATERIAL, 2026–2031 (USD MILLION)


TABLE 123
EUROPE: BUS DUCT MARKET, BY TYPE, 2022–2025 (USD MILLION)


TABLE 124
EUROPE: BUS DUCT MARKET, BY TYPE, 2026–2031 (USD MILLION)


TABLE 125
EUROPE: BUS DUCT MARKET, BY VOLTAGE, 2022–2025 (USD MILLION)


TABLE 126
EUROPE: BUS DUCT MARKET, BY VOLTAGE, 2026–2031 (USD MILLION)


TABLE 127
EUROPE: BUS DUCT MARKET, BY END USER, 2022–2025 (USD MILLION)


TABLE 128
EUROPE: BUS DUCT MARKET, BY END USER, 2026–2031 (USD MILLION)


TABLE 129
GERMANY: BUS DUCT MARKET, BY END USER, 2022–2025 (USD MILLION)


TABLE 130
GERMANY: BUS DUCT MARKET, BY END USER, 2026–2031 (USD MILLION)


TABLE 131
FRANCE: BUS DUCT MARKET, BY END USER, 2022–2025 (USD MILLION)


TABLE 132
FRANCE: BUS DUCT MARKET, BY END USER, 2026–2031 (USD MILLION)


TABLE 133
ITALY: BUS DUCT MARKET, BY END USER, 2022–2025 (USD MILLION)


TABLE 134
ITALY: BUS DUCT MARKET, BY END USER, 2026–2031 (USD MILLION)


TABLE 135
UK: BUS DUCT MARKET, BY END USER, 2022–2025 (USD MILLION)


TABLE 136
UK: BUS DUCT MARKET, BY END USER, 2026–2031 (USD MILLION)


TABLE 137
SPAIN: BUS DUCT MARKET, BY END USER, 2022–2025 (USD MILLION)


TABLE 138
SPAIN: BUS DUCT MARKET, BY END USER, 2026–2031 (USD MILLION)


TABLE 139
REST OF EUROPE: BUS DUCT MARKET, BY END USER, 2022–2025 (USD MILLION)


TABLE 140
REST OF EUROPE: BUS DUCT MARKET, BY END USER, 2026–2031 (USD MILLION)


TABLE 141
MIDDLE EAST & AFRICA: BUS DUCT MARKET, BY COUNTRY, 2022–2025 (USD MILLION)


TABLE 142
MIDDLE EAST & AFRICA: BUS DUCT MARKET, BY COUNTRY, 2026–2031 (USD MILLION)


TABLE 143
MIDDLE EAST AND AFRICA: BUS DUCT MARKET, BY MATERIAL, 2022–2025 (USD MILLION)


TABLE 144
MIDDLE EAST AND AFRICA: BUS DUCT MARKET, BY MATERIAL, 2026–2031 (USD MILLION)


TABLE 145
MIDDLE EAST & AFRICA: BUS DUCT MARKET, BY TYPE, 2022–2025 (USD MILLION)


TABLE 146
MIDDLE EAST & AFRICA: BUS DUCT MARKET, BY TYPE, 2026–2031 (USD MILLION)


TABLE 147
MIDDLE EAST & AFRICA: BUS DUCT MARKET, BY VOLTAGE, 2022–2025 (USD MILLION)


TABLE 148
MIDDLE EAST & AFRICA: BUS DUCT MARKET, BY VOLTAGE, 2026–2031 (USD MILLION)


TABLE 149
MIDDLE EAST & AFRICA: BUS DUCT MARKET, BY END USER, 2022–2025 (USD MILLION)


TABLE 150
MIDDLE EAST & AFRICA: BUS DUCT MARKET, BY END USER, 2026–2031 (USD MILLION)


TABLE 151
GCC: BUS DUCT MARKET, BY COUNTRY, 2022–2025 (USD MILLION)


TABLE 152
GCC: BUS DUCT MARKET, BY COUNTRY, 2026–2031 (USD MILLION)


TABLE 153
GCC: BUS DUCT MARKET, BY END USER, 2022–2025 (USD MILLION)


TABLE 154
GCC: BUS DUCT MARKET, BY END USER, 2026–2031 (USD MILLION)


TABLE 155
SAUDI ARABIA: BUS DUCT MARKET, BY END USER, 2022–2025 (USD MILLION)


TABLE 156
SAUDI ARABIA: BUS DUCT MARKET, BY END USER, 2026–2031 (USD MILLION)


TABLE 157
UAE: BUS DUCT MARKET, BY END USER, 2022–2025 (USD MILLION)


TABLE 158
UAE: BUS DUCT MARKET, BY END USER, 2026–2031 (USD MILLION)


TABLE 159
REST OF GCC: BUS DUCT MARKET, BY END USER, 2022–2025 (USD MILLION)


TABLE 160
REST OF GCC: BUS DUCT MARKET, BY END USER, 2026–2031 (USD MILLION)


TABLE 161
SOUTH AFRICA: BUS DUCT MARKET, BY END USER, 2022–2025 (USD MILLION)


TABLE 162
SOUTH AFRICA: BUS DUCT MARKET, BY END USER, 2026–2031 (USD MILLION)


TABLE 163
EGYPT: BUS DUCT MARKET, BY END USER, 2022–2025 (USD MILLION)


TABLE 164
EGYPT: BUS DUCT MARKET, BY END USER, 2026–2031 (USD MILLION)


TABLE 165
REST OF MIDDLE EAST & AFRICA: BUS DUCT MARKET, BY END USER, 2022–2025 (USD MILLION)


TABLE 166
REST OF MIDDLE EAST & AFRICA: BUS DUCT MARKET, BY END USER, 2026–2031 (USD MILLION)


TABLE 167
SOUTH AMERICA: BUS DUCT MARKET, BY COUNTRY, 2022–2025 (USD MILLION)


TABLE 168
SOUTH AMERICA: BUS DUCT MARKET, BY COUNTRY, 2026–2031 (USD MILLION)


TABLE 169
SOUTH AMERICA: BUS DUCT MARKET, BY MATERIAL, 2022–2025 (USD MILLION)


TABLE 170
SOUTH AMERICA: BUS DUCT MARKET, BY MATERIAL, 2026–2031 (USD MILLION)


TABLE 171
SOUTH AMERICA: BUS DUCT MARKET, BY TYPE, 2022–2025 (USD MILLION)


TABLE 172
SOUTH AMERICA: BUS DUCT MARKET, BY TYPE, 2026–2031 (USD MILLION)


TABLE 173
SOUTH AMERICA: BUS DUCT MARKET, BY VOLTAGE, 2022–2025 (USD MILLION)


TABLE 174
SOUTH AMERICA: BUS DUCT MARKET, BY VOLTAGE, 2026–2031 (USD MILLION)


TABLE 175
SOUTH AMERICA: BUS DUCT MARKET, BY END USER, 2022–2025 (USD MILLION)


TABLE 176
SOUTH AMERICA: BUS DUCT MARKET, BY END USER, 2026–2031 (USD MILLION)


TABLE 177
BRAZIL: BUS DUCT MARKET, BY END USER, 2022–2025 (USD MILLION)


TABLE 178
BRAZIL: BUS DUCT MARKET, BY END USER, 2026–2031 (USD MILLION)


TABLE 179
ARGENTINA: BUS DUCT MARKET, BY END USER, 2022–2025 (USD MILLION)


TABLE 180
ARGENTINA: BUS DUCT MARKET, BY END USER, 2026–2031 (USD MILLION)


TABLE 181
REST OF SOUTH AMERICA: BUS DUCT MARKET, BY END USER, 2022–2025 (USD MILLION)


TABLE 182
REST OF SOUTH AMERICA: BUS DUCT MARKET, BY END USER, 2026–2031 (USD MILLION)


TABLE 183
BUS DUCT MARKET: OVERVIEW OF STRATEGIES ADOPTED BY KEY PLAYERS, JANUARY 2023–JULY 2026


TABLE 184
BUS DUCT MARKET: DEGREE OF COMPETITION, 2025


TABLE 185
BUS DUCT MARKET: REGION FOOTPRINT (KEY PLAYERS)


TABLE 186
BUS DUCT MARKET: MATERIAL FOOTPRINT (KEY PLAYERS)


TABLE 187
BUS DUCT MARKET: TYPE FOOTPRINT (KEY PLAYERS)


TABLE 188
BUS DUCT MARKET: CURRENT RATING FOOTPRINT (KEY PLAYERS)


TABLE 189
BUS DUCT MARKET: VOLTAGE FOOTPRINT (KEY PLAYERS)


TABLE 190
BUS DUCT MARKET: END USER FOOTPRINT (KEY PLAYERS)


TABLE 191
BUS DUCT MARKET: DETAILED LIST OF KEY STARTUPS/SMES


TABLE 192
BUS DUCT MARKET: REGION FOOTPRINT (STARTUPS/ SMES)


TABLE 193
BUS DUCT MARKET: MATERIAL FOOTPRINT (STARTUPS/ SMES)


TABLE 194
BUS DUCT MARKET: TYPE FOOTPRINT (STARTUPS/ SMES)


TABLE 195
BUS DUCT MARKET: CURRENT RATING FOOTPRINT (STARTUPS/ SMES)


TABLE 196
BUS DUCT MARKET: VOLTAGE FOOTPRINT (STARTUPS/ SMES)


TABLE 197
BUS DUCT MARKET: END USER FOOTPRINT (STARTUPS/ SMES)


TABLE 198
BUS DUCT MARKET: PRODUCT LAUNCHES, JANUARY 2023–JULY 2026


TABLE 199
BUS DUCT MARKET: DEALS, JANUARY 2023–JULY 2026


TABLE 200
BUS DUCT MARKET: EXPANSIONS, JANUARY 2023–JULY 2026


TABLE 201
ABB: COMPANY OVERVIEW


TABLE 202
ABB: PRODUCTS/SOLUTIONS/SERVICES OFFERED


TABLE 203
ABB: DEALS


TABLE 204
ABB: EXPANSIONS


TABLE 205
ABB: OTHER DEVELOPMENTS


TABLE 206
SCHNEIDER ELECTRIC: COMPANY OVERVIEW


TABLE 207
SCHNEIDER ELECTRIC: PRODUCTS/SOLUTIONS/SERVICES OFFERED


TABLE 208
SCHNEIDER ELECTRIC: PRODUCT LAUNCHES


TABLE 209
SCHNEIDER ELECTRIC: OTHER DEVELOPMENTS


TABLE 210
SIEMENS: COMPANY OVERVIEW


TABLE 211
SIEMENS: PRODUCTS/SOLUTIONS/SERVICES OFFERED


TABLE 212
SIEMENS: EXPANSIONS


TABLE 213
SIEMENS: OTHER DEVELOPMENTS


TABLE 214
EATON: COMPANY OVERVIEW


TABLE 215
EATON: PRODUCTS/SOLUTIONS/SERVICES OFFERED


TABLE 216
EATON: EXPANSIONS


TABLE 217
LEGRAND: COMPANY OVERVIEW


TABLE 218
LEGRAND: PRODUCTS/SOLUTIONS/SERVICES OFFERED


TABLE 219
LEGRAND: PRODUCT LAUNCHES


TABLE 220
LEGRAND: DEALS


TABLE 221
LEGRAND: EXPANSIONS


TABLE 222
LS CORP.: COMPANY OVERVIEW


TABLE 223
LS CORP.: PRODUCTS/SOLUTIONS/SERVICES OFFERED


TABLE 224
LS CORP.: EXPANSIONS


TABLE 225
LS CORP.: OTHER DEVELOPMENTS


TABLE 226
VERTIV GROUP CORP.: COMPANY OVERVIEW


TABLE 227
VERTIV GROUP CORP.: PRODUCTS/SOLUTIONS/SERVICES OFFERED


TABLE 228
VERTIV GROUP CORP.: PRODUCT LAUNCHES


TABLE 229
VERTIV GROUP CORP.: EXPANSIONS


TABLE 230
GODREJ ENTERPRISES: COMPANY OVERVIEW


TABLE 231
GODREJ ENTERPRISES: PRODUCTS/SOLUTIONS/SERVICES OFFERED


TABLE 232
GODREJ ENTERPRISES: DEVELOPMENTS


TABLE 233
POWELL INDUSTRIES: COMPANY OVERVIEW


TABLE 234
POWELL INDUSTRIES: PRODUCTS/SOLUTIONS/SERVICES OFFERED


TABLE 235
NVENT: COMPANY OVERVIEW


TABLE 236
NVENT: PRODUCTS/SOLUTIONS/SERVICES OFFERED


TABLE 237
NVENT: PRODUCT LAUNCHES


TABLE 238
NVENT: DEALS


TABLE 239
HYOSUNG HEAVY INDUSTRIES: COMPANY OVERVIEW


TABLE 240
HYOSUNG HEAVY INDUSTRIES: PRODUCTS/SOLUTIONS/SERVICES OFFERED


TABLE 241
NOVOLECS: COMPANY OVERVIEW


TABLE 242
NOVOLECS: PRODUCTS/SOLUTIONS/SERVICES OFFERED


TABLE 243
NOVOLECS: DEALS


TABLE 244
NOVOLECS: EXPANSIONS


TABLE 245
BHARAT HEAVY ELECTRICALS LIMITED: COMPANY OVERVIEW


TABLE 246
BHARAT HEAVY ELECTRICALS LIMITED: PRODUCTS/SOLUTIONS/ SERVICES OFFERED


TABLE 247
BHARAT HEAVY ELECTRICALS LIMITED: DEVELOPMENTS


TABLE 248
CROWN ELECTRIC ENGINEERING AND MANUFACTURING LLC: COMPANY OVERVIEW


TABLE 249
CROWN ELECTRIC ENGINEERING AND MANUFACTURING LLC: PRODUCTS/SOLUTIONS/SERVICES OFFERED


TABLE 250
TECHNIBUS, INC.: COMPANY OVERVIEW


TABLE 251
TECHNIBUS, INC.: PRODUCTS/SOLUTIONS/SERVICES OFFERED


TABLE 252
BIMER ELECTRIC: COMPANY OVERVIEW


TABLE 253
BIMER ELECTRIC: PRODUCTS/SOLUTIONS/SERVICES OFFERED


TABLE 254
BIMER ELECTRIC: DEVELOPMENTS


TABLE 255
GKW (GORDON KITTO WELDING LTD): COMPANY OVERVIEW


TABLE 256
GKW (GORDON KITTO WELDING LTD): PRODUCTS/SOLUTIONS/ SERVICES OFFERED


TABLE 257
ALFA STANDARD S.P.A.: COMPANY OVERVIEW


TABLE 258
ALFA STANDARD S.P.A.: PRODUCTS/SOLUTIONS/SERVICES OFFERED


TABLE 259
HOLDUCT SP. Z O.O.: COMPANY OVERVIEW


TABLE 260
HOLDUCT SP. Z O.O.: PRODUCTS/SOLUTIONS/SERVICES OFFERED


TABLE 261
ELEKTROBUDOWA SP. Z O. O.: COMPANY OVERVIEW


TABLE 262
ELEKTROBUDOWA SP. Z O. O.: PRODUCTS/SOLUTIONS/SERVICES OFFERED


TABLE 263
ALSTEMA: COMPANY OVERVIEW


TABLE 264
ALSTEMA: PRODUCTS/SOLUTIONS/SERVICES OFFERED


TABLE 265
EGE: COMPANY OVERVIEW


TABLE 266
EGE: PRODUCTS/SOLUTIONS/SERVICES OFFERED


TABLE 267
ALIT: COMPANY OVERVIEW


TABLE 268
ALIT: PRODUCTS/SOLUTIONS/SERVICES OFFERED


TABLE 269
POWERGEAR LIMITED: COMPANY OVERVIEW


TABLE 270
POWERGEAR LIMITED: PRODUCTS/SOLUTIONS/SERVICES OFFERED


TABLE 271
DAQO GROUP CO., LTD.: COMPANY OVERVIEW


TABLE 272
DAQO GROUP CO., LTD.: PRODUCTS/SOLUTIONS/SERVICES OFFERED


TABLE 273
BEIJING POWER EQUIPMENT GROUP CO., LTD.: COMPANY OVERVIEW


TABLE 274
BEIJING POWER EQUIPMENT GROUP CO., LTD.: PRODUCTS/SOLUTIONS/SERVICES OFFERED


TABLE 275
FUXIN ENCLOSED BUSBAR CO., LTD.: COMPANY OVERVIEW


TABLE 276
FUXIN ENCLOSED BUSBAR CO., LTD.: PRODUCTS/SOLUTIONS/SERVICES OFFERED


TABLE 277
ACTOM: COMPANY OVERVIEW


TABLE 278
ACTOM: PRODUCTS/SOLUTIONS/SERVICES OFFERED


TABLE 279
SHANDONG ALFA DACHI ELECTRIC CO., LTD.: COMPANY OVERVIEW


TABLE 280
SHANDONG ALFA DACHI ELECTRIC CO., LTD.: PRODUCTS/SOLUTIONS/SERVICES OFFERED


TABLE 281
MAJOR SECONDARY SOURCES


TABLE 282
DATA CAPTURED FROM PRIMARY SOURCES


TABLE 283
PRIMARY INTERVIEW PARTICIPANTS, BY COMPANY


TABLE 284
BUS DUCT MARKET: RISK ANALYSIS


LIST OF FIGURES


FIGURE 1
MARKETS COVERED AND REGIONAL SCOPE


FIGURE 2
BUS DUCT MARKET: DURATION CONSIDERED


FIGURE 3
GLOBAL BUS DUCT MARKET SCENARIO


FIGURE 4
GLOBAL BUS DUCT MARKET SIZE, 2022–2031


FIGURE 5
MAJOR STRATEGIES ADOPTED BY KEY PLAYERS IN BUS DUCT MARKET, 2024–2026


FIGURE 6
DISRUPTIONS INFLUENCING GROWTH OF BUS DUCT MARKET


FIGURE 7
HIGH-GROWTH SEGMENTS IN BUS DUCT MARKET, 2026–2031


FIGURE 8
ASIA PACIFIC TO REGISTER HIGHEST CAGR DURING FORECAST PERIOD


FIGURE 9
EXPANSION OF DATA CENTERS, INDUSTRIAL ELECTRIFICATION, AND COMMERCIAL INFRASTRUCTURE TO DRIVE BUS DUCT MARKET


FIGURE 10
ASIA PACIFIC TO EXHIBIT HIGHEST CAGR BETWEEN 2026 AND 2031


FIGURE 11
CHINA AND COPPER SEGMENT DOMINATED BUS DUCT MARKET IN 2025


FIGURE 12
COPPER SEGMENT TO ACCOUNT FOR LARGER MARKET SHARE IN 2031


FIGURE 13
MEDIUM (>1–35 KV) SEGMENT TO CAPTURE MAJORITY OF MARKET SHARE IN 2031


FIGURE 14
NON-SEGREGATED PHASE BUS DUCT SEGMENT TO HOLD PROMINENT MARKET SHARE IN 2031


FIGURE 15
2,001–5,000 A SEGMENT TO ACCOUNT FOR LARGEST SHARE OF BUS DUCT MARKET IN 2031


FIGURE 16
COMMERCIAL SEGMENT TO HOLD LARGEST SHARE OF BUS DUCT MARKET IN 2031


FIGURE 17
ASIA PACIFIC TO ACCOUNT FOR LARGEST MARKET SHARE IN 2031


FIGURE 18
DRIVERS, RESTRAINTS, OPPORTUNITIES, AND CHALLENGES


FIGURE 19
GLOBAL STOCK OF PUBLIC CHARGING POINTS, BY GEOGRAPHY, 2020–2025


FIGURE 20
GLOBAL ELECTRICITY DEMAND GROWTH, BY REGION, 2020–2025 VS. 2025–2030


FIGURE 21
GLOBAL DATA CENTER INVESTMENT BY IT, NON-IT, AND ENERGY SEGMENTS, 2020, 2025, AND 2030


FIGURE 22
GLOBAL ELECTRICITY GRID INVESTMENTS, BY REGION, 2021–2026


FIGURE 23
GRADE A COPPER CATHODE TREND, SEPTEMBER 2021–MARCH


FIGURE 24
PORTER’S FIVE FORCES ANALYSIS


FIGURE 25
BUS DUCT VALUE CHAIN ANALYSIS


FIGURE 26
BUS DUCT ECOSYSTEM MAPPING


FIGURE 27
REGION-WISE AVERAGE SELLING PRICE TREND OF BUS DUCT, 2022–2025


FIGURE 28
IMPORT SCENARIO FOR HS CODE 853690-COMPLIANT PRODUCTS IN TOP 5 COUNTRIES, 2021–2025


FIGURE 29
EXPORT SCENARIO FOR HS CODE 853690-COMPLIANT PRODUCTS IN TOP 5 COUNTRIES, 2021–2025


FIGURE 30
TRENDS/DISRUPTIONS INFLUENCING CUSTOMER BUSINESS


FIGURE 31
PATENTS GRANTED AND APPLIED, 2016–2025


FIGURE 32
GLOBAL BUS DUCT MARKET


FIGURE 33
GLOBAL BUS DUCT MARKET: DECISION-MAKING FACTORS


FIGURE 34
INFLUENCE OF STAKEHOLDERS ON BUYING PROCESS FOR KEY END USERS


FIGURE 35
KEY BUYING CRITERIA FOR KEY END USERS


FIGURE 36
ADOPTION BARRIERS AND INTERNAL CHALLENGES IN GLOBAL BUS DUCT MARKET


FIGURE 37
SHARE OF BUS DUCT MARKET, BY TYPE, 2025


FIGURE 38
SHARE OF BUS DUCT MARKET, BY MATERIAL, 2025


FIGURE 39
SHARE OF BUS DUCT MARKET, BY VOLTAGE, 2025


FIGURE 40
SHARE OF BUS DUCT MARKET, BY CURRENT RATING, 2025


FIGURE 41
SHARE OF BUS DUCT MARKET, BY END USER, 2025


FIGURE 42
ASIA PACIFIC TO BE FASTEST-GROWING MARKET FROM 2026 TO 2031


FIGURE 43
BUS DUCT MARKET: SEGMENTAL REVENUE ANALYSIS OF TOP 5 PLAYERS, 2021–2025


FIGURE 44
MARKET SHARE ANALYSIS OF COMPANIES OFFERING BUS DUCTS, 2025


FIGURE 45
BUS DUCT MARKET: COMPANY EVALUATION MATRIX (KEY PLAYERS), 2025


FIGURE 46
BUS DUCT MARKET: COMPANY FOOTPRINT


FIGURE 47
BUS DUCT MARKET: COMPANY EVALUATION MATRIX (STARTUPS/SMES), 2025


FIGURE 48
COMPANY VALUATION


FIGURE 49
FINANCIAL METRICS (EV/EBITDA)


FIGURE 50
BRAND COMPARISON OF KEY VENDORS


FIGURE 51
ABB: COMPANY SNAPSHOT


FIGURE 52
SCHNEIDER ELECTRIC: COMPANY SNAPSHOT


FIGURE 53
SIEMENS: COMPANY SNAPSHOT


FIGURE 54
EATON: COMPANY SNAPSHOT


FIGURE 55
LEGRAND: COMPANY SNAPSHOT


FIGURE 56
LS CORP.: COMPANY SNAPSHOT


FIGURE 57
VERTIV GROUP CORP.: COMPANY SNAPSHOT


FIGURE 58
POWELL INDUSTRIES: COMPANY SNAPSHOT


FIGURE 59
NVENT: COMPANY SNAPSHOT


FIGURE 60
HYOSUNG HEAVY INDUSTRIES: COMPANY SNAPSHOT


FIGURE 61
BHARAT HEAVY ELECTRICALS LIMITED: COMPANY SNAPSHOT


FIGURE 62
BUS DUCT MARKET: RESEARCH DESIGN


FIGURE 63
DATA CAPTURED FROM SECONDARY SOURCES


FIGURE 64
CORE FINDINGS FROM INDUSTRY EXPERTS


FIGURE 65
BREAKDOWN OF PRIMARY INTERVIEWS: BY COMPANY TYPE, DESIGNATION, AND REGION


FIGURE 66
BUS DUCT MARKET: BOTTOM-UP APPROACH


FIGURE 67
BUS DUCT MARKET: TOP-DOWN APPROACH


FIGURE 68
BUS DUCT MARKET: DEMAND-SIDE ANALYSIS


FIGURE 69
KEY STEPS CONSIDERED TO ASSESS SUPPLY OF BUS DUCT MANUFACTURERS


FIGURE 70
BUS DUCT MARKET: SUPPLY-SIDE ANALYSIS


FIGURE 71
BUS DUCT MARKET: DATA TRIANGULATION


FIGURE 72
BUS DUCT MARKET: FACTOR ANALYSIS


FIGURE 73
BUS DUCT MARKET: RESEARCH ASSUMPTIONS AND LIMITATIONS


FIGURE 74
INDUSTRY EXPERT INSIGHTS


Methodology

The research process for this technical, market-oriented, and commercial study of the bus duct market involved systematic collection, validation, and analysis of information related to electrical power distribution infrastructure, including product types, current ratings, voltage levels, conductor materials, end users, and regional developments. Extensive secondary research was conducted using annual reports, investor presentations, technical papers, industry publications, company websites, product catalogs, and financial reports to identify key market participants, product innovations, technology trends, market developments, and competitive strategies. The findings were further validated through primary interviews with executives from bus duct manufacturers, electrical component suppliers, EPC companies, distributors, and industry experts to assess market estimates, product adoption, pricing trends, customer requirements, and competitive positioning. Key market players and their competitive positions were established through a combination of secondary research and primary research involving senior executives, business development managers, product specialists, procurement professionals, and technical experts across the electrical distribution ecosystem.

Secondary Research

In the secondary research process, various sources were reviewed to identify and collect information relevant to the bus duct market. Secondary sources included annual reports, investor presentations, press releases, company websites, technical documents, product catalogs, and industry publications. Information from organizations such as the International Energy Agency (IEA), government energy departments, and electrical safety and standards bodies was examined to understand electricity infrastructure investments, data center expansion, industrial electrification, and power distribution developments. Secondary research focused on market size, key participants, product portfolios, current ratings, voltage specifications, conductor materials, manufacturing capabilities, pricing trends, end-user demand, and regional market developments.

Primary Research

During the primary research phase, bus duct manufacturers, electrical component suppliers, distributors, EPC contractors, procurement specialists, and industry experts were considered for qualitative and quantitative insights into the global bus duct market. Interviews were used to validate market estimates, product adoption, pricing trends, regional demand, competitive positioning, customer requirements, and technological developments. Primary research also helped assess demand across different current ratings, voltage levels, conductor materials, product types, and end users, including data centers, commercial buildings, industrial facilities, utilities, and renewable energy plants. Findings were cross-validated against company disclosures, product specifications, industry statistics, and technical documentation to refine market estimates, segment shares, regional forecasts, and competitive assessments.

Bus Duct Market 
 Size, and Share

Note: Other designations include sales managers, engineers, and regional managers.
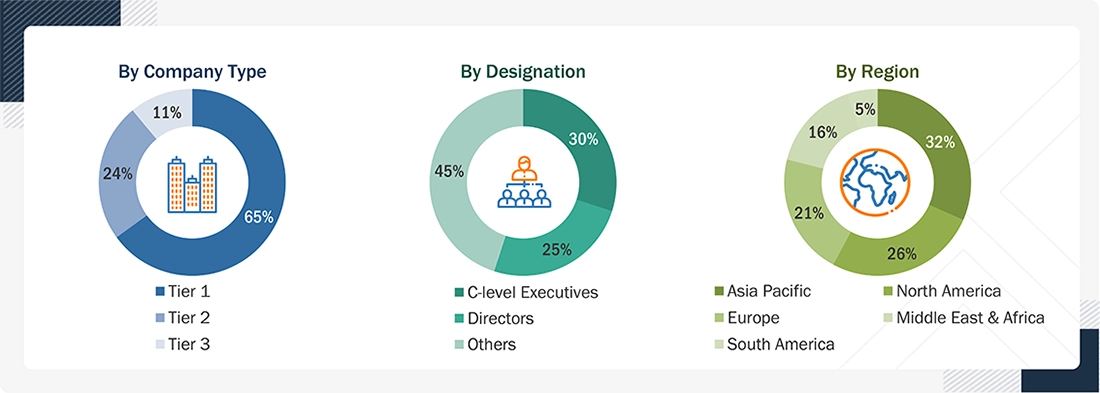
Tier 1 Company Revenue: >USD 5 billion, Tier 2 Company Revenue: between USD 1 and USD 5 billion, and Tier 3 Company Revenue: <USD 1 billion.

To know about the assumptions considered for the study, download the pdf brochure

Market Size Estimation

Both top-down and bottom-up approaches were used to estimate and validate the bus duct market and its dependent submarkets. Key market players were identified through secondary research, with their market shares assessed using primary and secondary sources. The research methodology includes reviewing annual reports, financial disclosures, product portfolios, and interviews with industry experts, including OEM executives, distributors, EPC contractors, and procurement managers, to obtain quantitative and qualitative insights into the global bus duct market.

Bottom-up Approach

  • Analyze investments and infrastructure developments across key end-user segments, including data centers, commercial buildings, utilities, industrial facilities, renewable energy plants, and EV charging infrastructure, across major countries and regions.
  • Estimate bus duct penetration within each end-user segment based on electrical infrastructure requirements, application suitability, project specifications, and industry adoption trends.
  • Calculate the addressable bus duct market for each end-user segment by applying estimated penetration rates to relevant infrastructure demand and expenditure.
  • Aggregate the estimated market sizes across all end-user segments and regions to derive the global bus duct market size.
  • Segment the market by type, current rating, voltage, conductor material, end user, and region, considering product specifications, installation requirements, and regional demand patterns.
  • Validate market estimates using OEM pricing, supplier data, project-level cost benchmarks, and primary research to ensure consistency and avoid double counting.

Top-down Approach

  • Estimate the overall global bus duct market size based on electrical infrastructure investments, construction activity, industrial electrification, data center expansion, and power distribution infrastructure development
  • Determine the percentage share of each market segment, including conductor material, voltage, current rating, product type, and end user, based on industry adoption patterns, product portfolios, supplier data, and primary research
  • Allocate the global market size across the five regions: North America, Europe, Asia Pacific, Middle East & Africa, and South America, based on regional infrastructure investments, manufacturing activity, construction trends, and electricity demand
  • Further distribute regional market estimates across key countries based on country-level infrastructure development, industrial capacity additions, data center expansion, and investments in electrical distribution systems
  • Validate the final market estimates through primary interviews with bus duct manufacturers, suppliers, distributors, EPC contractors, and end users, followed by data triangulation to ensure consistency and accuracy

Global Bus Duct Market: Bottom-up Approach and Top-down Approach

Bus Duct Market Top Down and Bottom Up Approach

Data Triangulation

The process of determining the global bus duct market size involved applying the previously established market-sizing methodologies, followed by segmenting the market across type, current rating, voltage, material, end user, and region. To establish comprehensive market estimates, data triangulation and market breakdown procedures were applied by cross-verifying demand and supply indicators, including electrical infrastructure investments, data center capacity expansion, industrial electrification, manufacturing facility upgrades, copper and aluminum consumption, busway product specifications, and regional installation requirements.

Market Definition

Bus ducts are engineered electrical distribution systems designed to safely transmit and distribute high-current electricity from power sources to downstream equipment. The systems typically comprise conductive busbars housed within protective enclosures, insulation, joints, and associated fittings. Depending on the application and installation requirements, bus ducts may be designed as isolated-phase, segregated-phase, or non-segregated systems for reliable power distribution across industrial, commercial, utility, and data center facilities. The bus duct market comprises the aggregate revenue generated by manufacturers and suppliers from the sale of bus ducts designed for electrical power distribution applications.

The study includes bus ducts across different materials, types, voltages, current ratings, and end users. The market covers North America, Europe, Asia Pacific, Middle East & Africa, and South America.  

Key Stakeholders

  • Bus duct and busbar system manufacturers
  • Electrical equipment manufacturers and switchgear suppliers
  • EPC contractors and electrical engineering companies
  • Power generation companies and utility operators
  • Data center developers and operators
  • Industrial and manufacturing facility owners
  • Commercial building developers and facility managers
  • Renewable energy project developers and operators
  • Electrical contractors and system integrators
  • Transformer, switchgear, and power distribution equipment suppliers
  • Electrical consultants and infrastructure designers
  • Electrical testing, commissioning, and maintenance service providers
  • Electrical standards organizations and regulatory authorities

Report Objectives

  • To describe, segment, and forecast the global bus duct market by material, type, voltage, current rating, end user, and region, in terms of value
  • To forecast the market size across five key regions: North America, Europe, Asia Pacific, South America, and the Middle East & Africa, along with country-level analysis, in terms of value and volume
  • To provide the average selling price of bus duct by region, from 2023 to 2025
  • To provide detailed information about the key drivers, restraints, opportunities, and industry-specific challenges influencing the growth of the bus duct market.
  • To strategically analyze the global bus duct market with respect to individual growth trends, prospects, and contributions of each segment to the market
  • To provide value chain analysis, trends/disruptions impacting customer business, market maps, ecosystem analysis, sustainability and regulatory landscape, pricing analysis, patent analysis, case study analysis, technology analysis, key conferences and events, Porter’s five forces analysis, macroeconomic outlook, customer landscape and buyer behavior, regulatory analysis, and AI/Gen AI impact on the market
  • To analyze opportunities for stakeholders in the global bus duct market and draw a competitive landscape for market players
  • To benchmark players within the market using the company evaluation matrix, which analyzes market players based on several parameters within the broad categories of business and product strategies
  • To compare the key market players with respect to the market share, product specifications, and applications
  • To strategically profile the key players and comprehensively analyze their market ranking and core competencies.
  • To analyze competitive developments in the global bus duct market, such as expansions, product launches, partnerships, acquisitions and collaborations.

Available customizations:

With the given market data, MarketsandMarkets offers customizations based on the company’s specific needs. The following customization options are available for the report:

PRODUCT ANALYSIS

  • Product Matrix, which provides a detailed comparison of the product portfolio of each company

COMPANY INFORMATION

  • Detailed analyses and profiling of additional market players (up to 5)


Personalize This Research

  • Triangulate with your Own Data
  • Get Data as per your Format and Definition
  • Gain a Deeper Dive on a Specific Application, Geography, Customer or Competitor
  • Any level of Personalization
Request A Free Customisation

Let Us Help You

  • What are the Known and Unknown Adjacencies Impacting the Bus Duct Market
  • What will your New Revenue Sources be?
  • Who will be your Top Customer; what will make them switch?
  • Defend your Market Share or Win Competitors
  • Get a Scorecard for Target Partners
Customized Workshop Request

Custom Market Research Services

We Will Customise The Research For You, In Case The Report Listed Above Does Not Meet With Your Requirements

Get 10% Free Customisation

TESTIMONIALS

Growth opportunities and latent adjacency in Bus Duct Market

THIS REPORT TELLS YOU

How big the Bus Duct market is, and who leads it.

GROWTHIQ TELLS YOU NEW

Where your company should play next, and who is taking your share.

Get your company's view of this market. Free snapshot.

DMCA.com Protection Status
popup img