The study involved four major activities in estimating the size for cable cable-blowing equipment market. Exhaustive secondary research was done to collect information on the market, peer market, and parent market. The next step was to validate these findings, assumptions, and sizing with industry experts across value chains through primary research. The bottom-up approach was employed to estimate the overall market size. After that, market breakdown and data triangulation were used to estimate the market size of segments and subsegments.
Secondary Research
In the secondary research process, sources such as annual reports, press releases, investor presentations of companies, white papers, and articles by recognized authors were referred to. Secondary research was done to obtain key information about the market’s supply chain, the market's value chain, the pool of key market players, and market segmentation according to industry trends, regions, and developments from both market and technology perspectives.
Primary Research
Extensive primary research was conducted after acquiring knowledge about the global cable blowing equipment market scenario through secondary research. Several primary interviews were conducted with market experts from both demand (telecommunication players and network service providers) and supply sides (cable blowing equipment manufacturers) across four major regions, namely, North America, Europe, Asia Pacific, and RoW. This primary data was collected through questionnaires, emails, and telephonic interviews.

To know about the assumptions considered for the study, download the pdf brochure
Market Size Estimation
Top-down and bottom-up approaches were used to estimate and validate the size of the global cable blowing equipment market and other dependent submarkets. The key players in the market were identified through secondary research, and their market ranking in respective regions was determined through primary and secondary investigations. This entire research methodology included the study of annual and financial reports of the top market players and interviews of industry experts (CEOs, VPs, directors, and marketing executives) for key insights (both quantitative and qualitative) on the cable blowing equipment markets.
All percentage shares and breakdowns were determined using secondary sources and verified through primary sources. All possible parameters that affect the markets covered in this research study were accounted for, viewed in extensive detail, verified through primary research, and analyzed to get the final quantitative and qualitative data. This data was consolidated and added with detailed inputs and analysis from MarketsandMarkets and presented in this report.
Cable Blowing Equipment Market: Bottom-Up Approach

The bottom-up approach has been employed to arrive at the overall size of the cable blowing equipment market from the revenues of key players and their share in the market.
Cable Blowing Equipment Market: Top-Down Approach

In the top-down approach, the overall market size was used to estimate the size of the individual markets (mentioned in the market segmentation) through percentage splits obtained from secondary and primary research.
For the calculation of the segment-specific markets, the most appropriate immediate parent market size was used to implement the top-down approach. The bottom-up approach was also applied to the data obtained from secondary research to validate the size of the market based on various segments.
The market size for each company was estimated to verify the revenue used earlier in the bottom-up approach. With the data triangulation procedure and data validation through primaries, the overall parent market size and individual market sizes were determined and confirmed.
Data Triangulation
After arriving at the overall market size from the estimation process explained above, the total market was split into several segments and subsegments. To complete the overall market engineering process and arrive at the exact statistics for all segments and subsegments, the market breakdown and data triangulation procedures were employed wherever applicable. The data was triangulated by studying various factors and trends from both the demand and supply sides. Along with this, the market was validated using both the top-down and bottom-up approaches.
Definition
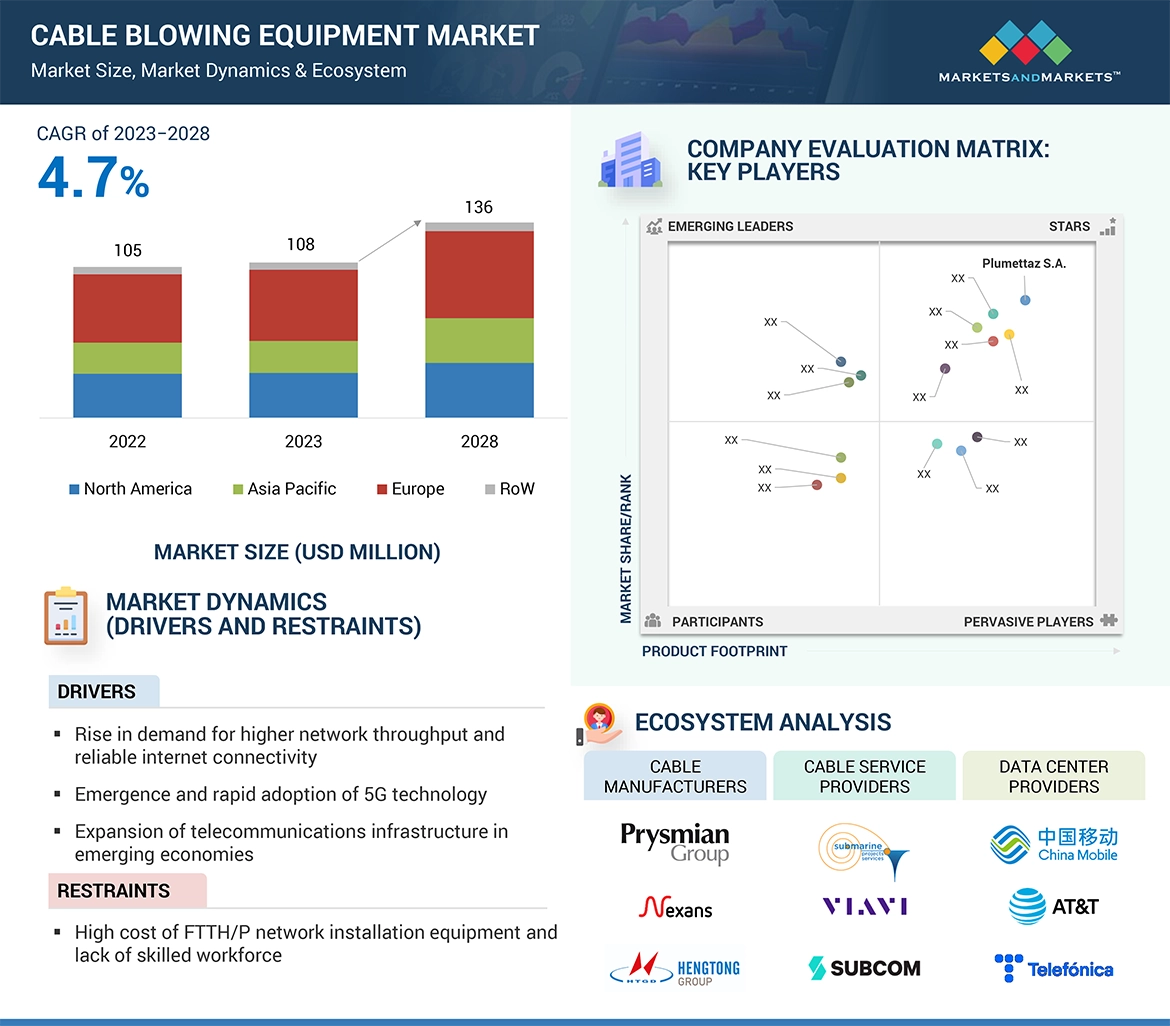
Cable blowing equipment is specialized machinery used to install fiber optic and other cables in telecommunication networks. It employs compressed air for efficient, friction-free deployment within pre-installed ducts, facilitating the rapid and reliable establishment of high-capacity communication infrastructure. It is usually of four power types: pneumatically powered, hydraulically powered, electric, and drill-driven. The cable blowing equipment is used to blow fiber optic cables into an existing or new duct/conduit/pipe.
Key Stakeholders
-
Fiber optic cable manufacturers
-
Original equipment manufacturers (OEMs)
-
Original design manufacturers (ODMs)
-
Network service providers
-
Research institutes
-
Fiber and broadband forums, alliances, and associations
-
Technology investors
Report Objectives
-
To describe, segment, and forecast the size of the cable blowing equipment market, by cable type and power type, in terms of value
-
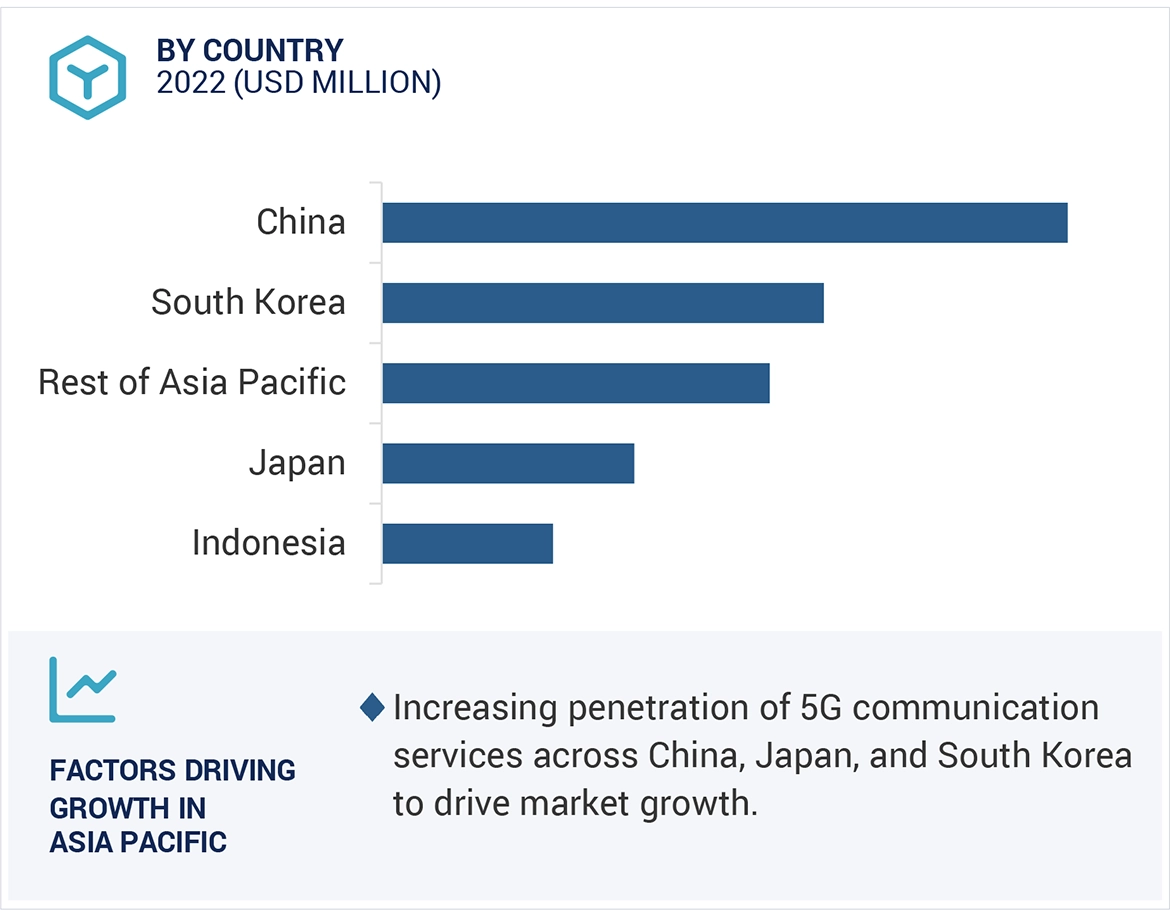
To forecast the market size for various segments, in terms of value, with respect to four main regions, namely, North America, Europe, Asia Pacific, and Rest of the World (RoW)
-
To forecast the size of the global cable blowing equipment market, in terms of volume
-
To provide detailed information regarding major drivers, restraints, opportunities, and challenges influencing the market growth
-
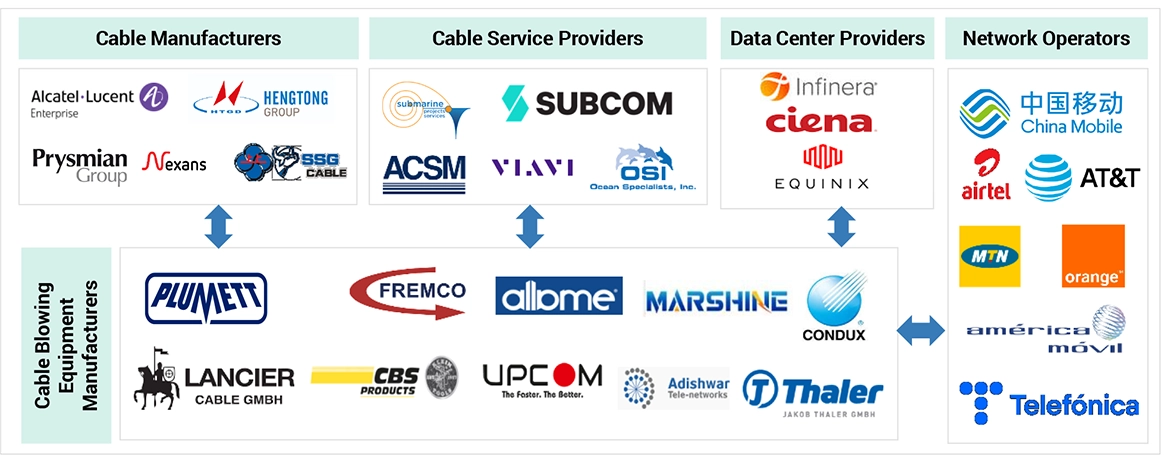
To strategically analyze the ecosystem, case studies, patent landscape, technological trends, pricing trends, Porter’s Five Forces, trade data/export and import scenarios, tariff and regulatory landscape pertaining to the market
-
To provide a detailed overview of the value chain of the cable blowing equipment market ecosystem
-
To strategically analyze micromarkets1 with respect to individual growth trends, prospects, and contributions to the overall market
-
To analyze opportunities in the market for various stakeholders by identifying high-growth segments
-
To strategically profile key players and comprehensively analyze their market ranking and core competencies2, along with detailing the competitive landscape for market leaders
-
To analyze strategies such as agreements, collaborations, partnerships, and acquisitions, and product launches adopted by players in the cable blowing equipment market
-
To understand the impact of the recession on the cable blowing equipment market
Available Customizations
With the given market data, MarketsandMarkets offers customizations according to the company’s specific needs. The following customization options are available for the report:
Company Information
-
Detailed analysis and profiling of additional market players (up to 7)


Growth opportunities and latent adjacency in Cable Blowing Equipment Market