Playout Automation & Channel-in-a-Box Market by End User (International Broadcasters, National Broadcasters), by Channel Application (News, Sports, Entertainment, Cartoons & Lifestyle), by Region - Analysis & forecast to 2020
[165 Pages Report] The playout automation & channel-in-a-box market projected to grow from USD 831.2 Million in 2015 to USD 17.46 Billion by 2020, at a CAGR of 16.0% from 2015 to 2020. Playout automation & channel-in-a-box technologies help to manage scheduling, ingesting, trimming, mixing, and SD to HD conversion, along with improving graphics and quality of content delivered to the viewers. In this report, the global market is segmented on the basis of end user, channel application, and region.
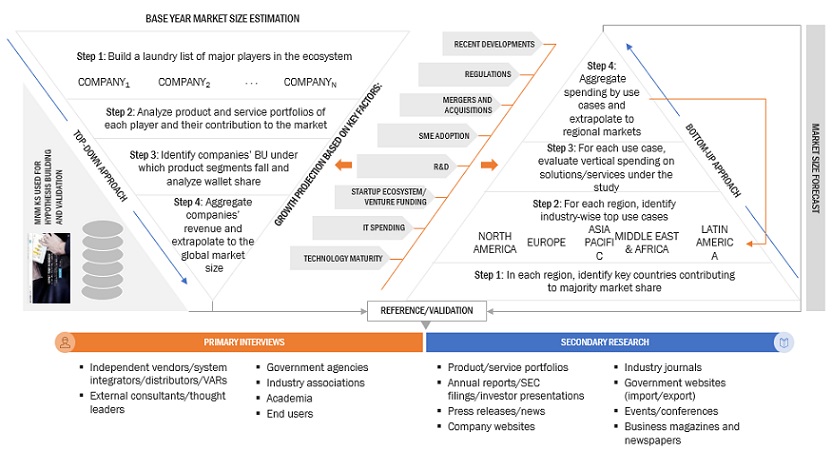
Both top-down approach and bottom-up approaches were used to estimate and validate the market size of the playout automation & channel-in-a-box market. The process of research started with the collection of secondary data related to key vendors and other markets. The product portfolio of different vendors was also considered to determine market segmentation. The geographical presence of top players in varied regions was traced to understand the geographical market segmentation. To derive the global market numbers, bottom-up approach was employed, whereas, the top-down approach was used to verify and validate these global numbers.
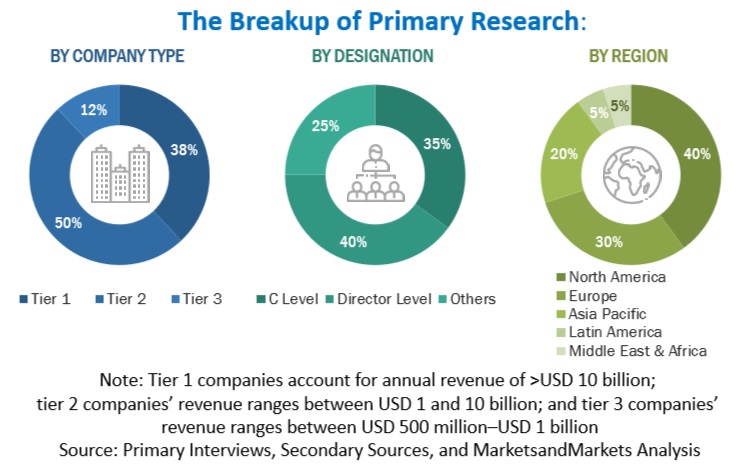
Primary interviews were conducted with market experts, including CEOs, VPs, directors, and executives of top companies. Primary research helped us to understand the market dynamics and strategies governing the decision-making process in top five companies. To complete the overall market engineering process and arrive at the exact statistics for all segments and subsegments, data triangulation and breakdown procedure were applied. The breakdown of profiles of primaries conducted for this research is depicted in the figure given below:
The global playout automation & channel-in-a-box ecosystem comprises media and broadcast equipment manufacturers, broadcasters, broadcast automation providers, broadcast programming application providers, playout service providers, post production providers, and channel viewers.
Harmonic, Inc., Grass Valley USA LLC, Snell Limited, Pebble Beach Systems, Evertz Microsystems Ltd., and Cinegy LLC are some of the vendors in the global playout automation & channel-in-a-box market.
Target Audience
- Playout Automation & Channel-in-a-Box Software and Solution Providers
- Broadcasters
- Application and Software Developers
- Business Organizations
Get online access to the report on the World's First Market Intelligence Cloud
Request Sample Scope of the Report
This research report categorizes the global market into the following segments and subsegments:
- Global Market Size and Forecast, By End User
- International Broadcasters
- National Broadcasters
- Global Market Size and Forecast, By Channel Application
- News
- Sports
- Entertainment
- Cartoons and Lifestyle
- Playout Automation & Channel-in-a-Box Market Size and Forecast, by Region
- Europe
- North America
- Asia-Pacific
- Middle East & Africa
- Latin America
Available Customizations
With the given market data, MarketsandMarkets offers customizations as per the companys specific needs. The following customization options are available for the report:
Product Analysis
- Product matrix, which gives a detailed comparison of product portfolio of each company
Geographic Analysis
- Further breakdown of the North America market
- Further breakdown of the Europe market
- Further breakdown of the Asia-Pacific market
- Further breakdown of the Middle East & Africa market
- Further breakdown of the Latin America market
Company Information
- Detailed analysis and profiling of additional market players
The playout automation & channel-in-a-box market is expected to grow from USD 831.2 Million in 2015 to USD 17.46 Billion by 2020, at a CAGR of 16.0% from 2015 to 2020. Broadcasters have been shifting their focus to highly advanced playout automation & channel-in-a-box solutions, considering the increase in the number of private channels. These solutions ease operational complexities, improve channel presentation, and reduce cost of ownership.
In 2015, the news segment registered the largest market share, followed by the sports segment in the playout automation & channel-in-a-box market. This large share is mainly attributed to the increasing adoption of playout automation software and solutions, which helps in the management of content delivered to end users. The broadcasters focus on channel broadcasting and playout automation solutions, as it reduces power consumption, saves costs, and integrates varied functionalities. These solutions also help eliminate the usage of large manual systems. However, it is crucial to use the right solutions for new technologies, along with complex integration of graphics.
Increasing number of channels and fierce competition to enhance channel presentation provide huge opportunities in the global playout automation & channel-in-a-box market. In the playout automation market, the international broadcasters segment accounted for the largest market share; however, the national broadcasters segment is expected to grow at the highest CAGR during the forecast period. Moreover, in the channel-in-a-box market, the international broadcasters segment accounted for the largest market share and is estimated to grow at a high CAGR from 2015 to 2020. This growth is mainly attributed to the fact that channel-in-a-box solutions are required to manage and handle large volumes of content of higher complexity. This has further given rise to the overall demand of channel-in-a-box solutions, especially in the international broadcasters segment.
Europe and North America are the leading regions in the playout automation & channel-in-a-box market, owing to the increased need for improved channel presentation, greater productivity, improved accuracy, and reduction in the overall cost. Europe commanded the largest market share of the global market in 2015, wherein the U.K., France, and Germany are considered as significant contributors in this region. The European countries were the early adopters of playout automation due to varied advantages, such as error handling, improving quality of results, simplifying processes, and eliminating redundancy. In Europe, playout centers are fully managed, purpose-built high-tech suites that utilize industry-proven technology to provide enhanced viewing experience to end users. Latin America offers potential growth opportunities in the market, owing to the increasing number of television viewers and rising demand for sports broadcasting.
On the other hand, major restraints hampering the growth of the playout automation & channel-in-a-box market include complexity in integration, subjective and distinctive requirements for playout solutions, and automation lock-in issues.
Key market players such as Harmonic, Inc., Pebble Beach Systems, Grass Valley USA LLC, and Cinegy LLC have adopted acquisition, as an eminent growth strategy to expand their client base and enter new markets with their improved solution capabilities.
Table of Contents
1 Introduction (Page No. - 17)
1.1 Objectives of the Study
1.2 Market Definition
1.3 Market Scope
1.3.1 Markets Covered
1.3.2 Years Considered for the Study
1.4 Currency
1.5 Stakeholders
2 Research Methodology (Page No. - 20)
2.1 Research Data
2.1.1 Secondary Data
2.1.1.1 Key Data From Secondary Sources
2.1.2 Primary Data
2.1.2.1 Key Data Taken From Primary Sources
2.1.2.2 Key Industry Insights
2.1.2.3 Breakdown of Primary Interviews
2.2 Market Size Estimation
2.2.1 Bottom-Up Approach
2.2.2 Top-Down Approach
2.3 Market Breakdown and Data Triangulation
2.4 Assumptions
3 Executive Summary (Page No. - 27)
4 Premium Insights (Page No. - 33)
4.1 Playout Automation
4.1.1 Attractive Market Opportunities in Playout Automation
4.1.2 Playout Automation Market, By End User
4.1.3 Global Playout Automation Market, By Region and Application
4.1.4 Playout Automation Market Potential
4.1.5 Playout Automation Lifecycle Analysis, By Region, 2015
4.2 Channel-In-A-Box Market
4.2.1 Attractive Market Opportunities in Channel-In-A-Box
4.2.2 Channel-In-A-Box Market, By End User
4.2.3 Global Channel-In-A-Box Market, By Region and Application
4.2.4 Channel-In-A-Box Market Potential
4.2.5 Channel-In-A-Box Lifecycle Analysis, By Region 2015
5 Playout Automation & Channel-In-A-Box Market Overview (Page No. - 39)
5.1 Introduction
5.2 Evolution
5.3 Market Segmentation
5.4 Market Dynamics
5.4.1 Drivers
5.4.1.1 Increased Need for Improved Channel Presentation
5.4.1.2 Ease of Operations
5.4.1.3 Reduced Cost of Ownership
5.4.1.4 Entry of Small & Mid-Sized Business (SMBS)
5.4.2 Restraints
5.4.2.1 Limited Adoption
5.4.2.2 Automation Lock-In Issues
5.4.3 Opportunities
5.4.3.1 Rise in Number of Channels
5.4.4 Challenges
5.4.4.1 Complexity in Integration
5.4.4.2 Subjective and Distinctive Requirements
6 Industry Trends (Page No. - 47)
6.1 Introduction
6.2 Value Chain Analysis
6.2.1 Playout Automation
6.2.2 Channel-In-A-Box
6.3 Porters Five Forces Analysis
6.3.1 Playout Automation
6.3.1.1 Threat of New Entrants
6.3.1.2 Threat of Substitutes
6.3.1.3 Bargaining Power of Suppliers
6.3.1.4 Bargaining Power of Buyers
6.3.1.5 Intensity of Competitive Rivalry
6.3.2 Channel-In-A-Box
6.3.2.1 Threat of New Entrants
6.3.2.2 Threat of Substitutes
6.3.2.3 Bargaining Power of Suppliers
6.3.2.4 Bargaining Power of Buyers
6.3.2.5 Intensity of Competitive Rivalry
7 Playout Automation & Channel-In-A-Box Market Analysis, By End User (Page No. - 56)
7.1 Playout Automation
7.1.1 International Broadcasters in Playout Automation
7.1.2 National Broadcasters in Playout Automation
7.2 Channel-In-A-Box
7.2.1 International Broadcasters in Channel-In-A-Box
7.2.2 National Broadcasters in Channel-In-A-Box
8 Playout Automation & Channel-In-A-Box Market Analysis, By Channel Application (Page No. - 64)
8.1 Introduction
8.2 Playout Automation
8.2.1 News in Playout Automation
8.2.2 Sports in Playout Automation
8.2.3 Entertainment in Playout Automation
8.2.4 Cartoons & Lifestyle in Playout Automation
8.3 Channel-In-A-Box
8.3.1 News in Channel-In-A-Box
8.3.2 Sports in Channel-In-A-Box
8.3.3 Entertainment in Channel-In-A-Box
8.3.4 Cartoons & Lifestyle in Channel-In-A-Box
9 Geographic Analysis (Page No. - 76)
9.1 Introduction
9.2 Europe
9.2.1 By Playout Automation
9.2.2 Channel-In-A-Box
9.3 North America
9.3.1 Playout Automation
9.3.2 Channel-In-A-Box
9.4 Asia-Pacific
9.4.1 Playout Automation
9.4.2 Channel-In-A-Box
9.5 Latin America
9.5.1 Playout Automation
9.5.2 By Channel-In-A-Box
9.6 Middle East & Africa
9.6.1 Playout Automation
9.6.2 Channel-In-A-Box
10 Competitive Landscape (Page No. - 114)
10.1 Overview
10.2 Competitive Situation and Trends
10.2.1 New Product Launches
10.2.2 Agreements, Partnerships, and Collaborations
10.2.3 Mergers & Acquisitions
10.2.4 Expansions
11 Company Profiles (Page No. - 120)
(Business Overview, Products & Services, Key Insights, Recent Developments, SWOT Analysis, MnM View)*
11.1 Introduction
11.2 Harmonic, Inc.
11.3 Pebble Beach Systems
11.4 Evertz Microsystems, Ltd
11.5 Cinegy LLC
11.6 Imagine Communications Corp.
11.7 Grass Valley Usa LLC
11.8 Snell Limited
11.9 Playbox Technology
11.10 Pixel Power Ltd.
11.11 Florical Systems
*Details on Business Overview, Products & Services, Key Insights, Recent Developments, SWOT Analysis, MnM View Might Not Be Captured in Case of Unlisted Companies.
12 Key Innovators (Page No. - 146)
12.1 Broadstream Solutions, Inc.
12.1.1 Business Overview
12.1.2 Strategies Towards Innovation
12.2 Masstech Group Inc.
12.2.1 Business Overview
12.2.2 Strategies Towards Innovation
12.3 Hardata Corp.
12.3.1 Business Overview
12.3.2 Strategies Towards Innovation
12.4 Miranda Technologies Inc.
12.4.1 Business Overview
12.4.2 Strategies Towards Innovation
12.5 Media-Alliance
12.5.1 Business Overview
12.5.2 Strategies Towards Innovation
12.6 XOR Media
12.6.1 Business Overview
12.6.2 Strategies Towards Innovation
12.7 Vector 3
12.7.1 Business Overview
12.7.2 Strategies Towards Innovation
12.8 Veset
12.8.1 Business Overview
12.8.2 Strategies Towards Innovation
12.9 ENCO
12.9.1 Business Overview
12.9.2 Strategies Towards Innovation
12.10 SGT
12.10.1 Business Overview
12.10.2 Strategies Towards Innovation
13 Appendix (Page No. - 151)
13.1 Insights of Industry Experts
13.2 Other Developments
13.2.1 New Product Launches
13.2.2 Mergers & Acquisitions (M&A)
13.2.3 Agreements, Partnerships, & Collaborations
13.2.4 Expansions
13.3 Discussion Guide
13.4 Introducing RT: Real Time Market Intelligence
13.5 Available Customizations
13.6 Related Reports
List of Tables (95 Tables)
Table 1 Global Playout Automation & Channel-In-A-Box Market Size and Growth Rate, 2013-2020 (USD Million, Y-O-Y %)
Table 2 Global Channel-In-A-Box Market Size and Growth Rate, 2013-2020 (USD Million, Y-O-Y %)
Table 3 Market: Summary of Drivers
Table 4 Market: Summary of Restraints
Table 5 Market: Summary of Opportunities
Table 6 Playout Automation & Channel-in-a-Box Market: Summary of Challenges
Table 7 Market Size, By End User, 2013-2020 (USD Million)
Table 8 Playout Automation Market Size, By End User, 2013-2020 (USD Million)
Table 9 International Broadcasters: Playout Automation Market Size, By Region, 2013-2020 (USD Million)
Table 10 National Broadcasters: Playout Automation Market Size, By Region, 2013-2020 (USD Million)
Table 11 Channel-In-A-Box Market Size, By End User, 2013-2020 (USD Million)
Table 12 International Broadcasters: Channel-In-A-Box Market Size, By Region, 2013-2020 (USD Million)
Table 13 National Broadcasters: Channel-In-A-Box Market Size, By Region, 2013-2020 (USD Million)
Table 14 Playout Automation & Channel-In-A-Box Market Size, By Channel Application, 2013-2020 (USD Million)
Table 15 Playout Automation Market Size, By Channel Application, 2013-2020 (USD Million)
Table 16 News: Playout Automation Market Size, By Region, 2013-2020 (USD Million)
Table 17 Sports: Playout Automation Market Size, By Region, 2013-2020 (USD Million)
Table 18 Entertainment: Playout Automation Market Size, By Region, 2013-2020 (USD Million)
Table 19 Cartoons & Lifestyle: Playout Automation Market Size, By Region, 2015-2020 (USD Million)
Table 20 Channel-In-A-Box Market Size, By Channel Application, 2013-2020 (USD Million)
Table 21 News: Channel-In-A-Box Market Size, By Region, 2013-2020 (USD Million)
Table 22 Sports: Channel-In-A-Box Market Size, By Region, 2013-2020 (USD Million)
Table 23 Entertainment: Channel-In-A-Box Market Size, By Region, 2013-2020 (USD Million)
Table 24 Cartoons & Lifestyle: Channel-In-A-Box Market Size, By Region, 2013-2020 (USD Million)
Table 25 Playout Automation & Channel-In-A-Box Market Size, By Region, 2013-2020 (USD Million)
Table 26 Playout Automation Market Size, By Region, 2013-2020 (USD Million)
Table 27 Channel-In-A-Box Market Size, By Region, 2013-2020 (USD Million)
Table 28 Europe: Playout Automation Market Size, By End User, 20132020 (USD Million)
Table 29 Europe: Playout Automation Market Size, By Channel Application, 20132020 (USD Million)
Table 30 Europe: News Playout Automation Market Size, By End User, 20132020 (USD Million)
Table 31 Europe: Sports Playout Automation Market Size, By End User, 20132020 (USD Million)
Table 32 Europe: Entertainment Playout Automation Market Size, By End User, 20132020 (USD Million)
Table 33 Europe: Cartoons & Lifestyle Playout Automation Market Size, By End User, 20132020 (USD Million)
Table 34 Europe: Channel-In-A-Box Market Size, By End User, 20132020 (USD Million)
Table 35 Europe: Channel-In-A-Box Market Size, By Channel Application, 20132020 (USD Million)
Table 36 Europe: News Channel-In-A-Box Market Size, By End User, 20132020 (USD Million)
Table 37 Europe: Sports Channel-In-A-Box Market Size, By End User, 20132020 (USD Million)
Table 38 Europe: Entertainment Channel-In-A-Box Market Size, By End User, 20132020 (USD Million)
Table 39 Europe: Cartoons & Lifestyle Channel-In-A-Box Market Size, By End User, 20132020 (USD Million)
Table 40 North America: Playout Automation Market Size, By End User, 20132020 (USD Million)
Table 41 North America: Playout Automation Market Size, By Channel Application, 20132020 (USD Million)
Table 42 North America: Sports Playout Automation Market Size, By End User, 20132020 (USD Million)
Table 43 North America: News Playout Automation Market Size, By End User, 20132020 (USD Million)
Table 44 North America: Entertainment Playout Automation Market Size, By End User, 20132020 (USD Million)
Table 45 North America: Cartoons & Lifestyle Playout Automation Market Size, By End User, 20132020 (USD Million)
Table 46 North America: Channel-In-A-Box Market Size, By End User, 20132020 (USD Million)
Table 47 North America: Channel-In-A-Box Market Size, By Channel Application, 20132020 (USD Million)
Table 48 North America: Sports Channel-In-A-Box Market Size, By End User, 20132020 (USD Million)
Table 49 North America: News Channel-In-A-Box Market Size, By End User, 20132020 (USD Million)
Table 50 North America: Entertainment Channel-In-A-Box Market Size, By End User, 20132020 (USD Million)
Table 51 North America: Cartoons & Lifestyle Channel-In-A-Box Market Size, By End User, 20132020 (USD Million)
Table 52 Asia-Pacific: Playout Automation Market Size, By End User, 20132020 (USD Million)
Table 53 Asia-Pacific: Playout Automation Market Size, By Channel Application, 20132020 (USD Million)
Table 54 Asia-Pacific: News Playout Automation Market Size, By End User, 20132020 (USD Million)
Table 55 Asia-Pacific: Sports Playout Automation Market Size, By End User, 20132020 (USD Million)
Table 56 Asia-Pacific: Entertainment Playout Automation Market Size, By End User, 20132020 (USD Million)
Table 57 Asia-Pacific: Cartoons & Lifestyle Playout Automation Market Size, By End User, 20132020 (USD Million)
Table 58 Asia-Pacific: Channel-In-A-Box Market Size, By End User, 20132020 (USD Million)
Table 59 Asia-Pacific: Channel-In-A-Box Market Size, By Channel Application, 20132020 (USD Million)
Table 60 Asia-Pacific: News Channel-In-A-Box Market Size, By End User, 20132020 (USD Million)
Table 61 Asia-Pacific: Sports Channel-In-A-Box Market Size, By End User, 20132020 (USD Million)
Table 62 Asia-Pacific: Entertainment Channel-In-A-Box Market Size, By End User, 20132020 (USD Million)
Table 63 Asia-Pacific: Cartoons & Lifestyle Channel-In-A-Box Market Size, By End User, 20132020 (USD Million)
Table 64 Latin America: Playout Automation Market Size, By End User, 20132020 (USD Million)
Table 65 Latin America: Playout Automation Market Size, By Channel Application, 20132020 (USD Million)
Table 66 Latin America: Sports Playout Automation Market Size, By End User, 20132020 (USD Million)
Table 67 Latin America: News Playout Automation Market Size, By End User, 20132020 (USD Million)
Table 68 Latin America: Entertainment Playout Automation Market Size, By End User, 20132020 (USD Million)
Table 69 Latin America: Cartoons & Lifestyle Playout Automation Market Size, By End User, 20132020 (USD Million)
Table 70 Latin America: Channel-In-A-Box Market Size, By End User, 20132020 (USD Million)
Table 71 Latin America: Channel-In-A-Box Market Size, By Channel Application, 20132020 (USD Million)
Table 72 Latin America: Sports Channel-In-A-Box Market Size, By End User, 20132020 (USD Million)
Table 73 Latin America: News Channel-In-A-Box Market Size, By End User, 20132020 (USD Million)
Table 74 Latin America: Entertainment Channel-In-A-Box Market Size, By End User, 20132020 (USD Million)
Table 75 Latin America: Cartoons & Lifestyle Channel-In-A-Box Market Size, By End User, 20132020 (USD Million)
Table 76 Middle East & Africa: Playout Automation Market Size, By End User, 20132020 (USD Million)
Table 77 Middle East & Africa: Playout Automation Market Size, By Channel Application, 20132020 (USD Million)
Table 78 Middle East & Africa: News Playout Automation Market Size, By End User, 20132020 (USD Million)
Table 79 Middle East & Africa: Sports Playout Automation Market Size, By End User, 20132020 (USD Million)
Table 80 Middle East & Africa: Entertainment Playout Automation Market Size, By End User, 20132020 (USD Million)
Table 81 Middle East & Africa: Cartoons & Lifestyle Playout Automation Market Size, By End User, 20132020 (USD Million)
Table 82 Middle East & Africa: Channel-In-A-Box Market Size, By End User, 20132020 (USD Million)
Table 83 Middle East & Africa: Channel-In-A-Box Market Size, By Channel Application, 20132020 (USD Million)
Table 84 Middle East & Africa: News Channel-In-A-Box Market Size, By End User, 20132020 (USD Million)
Table 85 Middle East & Africa: Sports Channel-In-A-Box Market Size, By End User, 20132020 (USD Million)
Table 86 Middle East & Africa: Entertainment Channel-In-A-Box Market Size, By End User, 20132020 (USD Million)
Table 87 Middle East & Africa: Cartoons & Lifestyle Channel-In-A-Box Market Size, By End User, 20142020 (USD Million)
Table 88 New Product Launches, 20142015
Table 89 Agreements, Partnerships, and Collaborations, 20142015
Table 90 Mergers & Acquisitions, 20142015
Table 91 Expansions, 2014-2015
Table 92 New Product Launches, 2013-2015
Table 93 Mergers & Acquisitions, 2015
Table 94 Agreements, Partnerships & Collaborations, 2012-2015
Table 95 Expansions, 2013-2015
List of Figures (73 Figures)
Figure 1 Global Playout Automation & Channel-In-A-Box Market
Figure 2 Playout Automation and Channel-In-A-Box Market: Research Design
Figure 3 Market Size Estimation Methodology: Bottom-Up Approach
Figure 4 Playout Automation & Channel-in-a-Box Market Size Estimation Methodology: Top-Down Approach
Figure 5 Data Triangulation
Figure 6 Playout Automation Market Size, Regional Snapshot (2015-2020): Market in Latin America is Expected to Grow at the Highest CAGR in Next Five Years
Figure 7 Playout Automation Market Size, End-User Snapshot (2015-2020): International Broadcasters are Expected to Dominate the Market By 2020
Figure 8 Playout Automation Market Size, Channel Application Snapshot (2015-2020): Entertainment Segment is Expected to Grow at the Highest CAGR in Next Five Years
Figure 9 Global Playout Automation Market Share, 2015 Europe is Expected to Exhibit the Highest Market Share in 2015
Figure 10 Channel-In-A-Box Market Size, Regional Snapshot (2015-2020): Market in Asia-Pacific is Expected to Grow at the Highest CAGR in Next Five Years
Figure 11 Channel-In-A-Box Market Size, End-User Snapshot (2015-2020): International Broadcasters are Expected to Dominate the Market By 2020
Figure 12 Channel-In-A-Box Market Size, Channel Application Snapshot (2015-2020): Entertainment Segment is Expected to Grow at the Highest CAGR in Next Five Years
Figure 13 Global Channel-In-A-Box Market Share, 2015 Europe is Expected to Exhibit the Highest Market Share in 2015
Figure 14 Advancements in Technology Will Impact the Future of Playout Automation
Figure 15 International Broadcasters are Gaining the Highest Traction in the Playout Automation Market
Figure 16 Europe Holds the Maximum Share in the Playout Automation Market (2015)
Figure 17 The Playout Automation Market in Latin America is Expected to Witness the Highest Growth Potential During the Forecast Period
Figure 18 Playout Automation Regional Lifecycle Market in Emerging Economies Such as Asia-Pacific, Latin America, and the Middle East & Africa is in the Growth Phase
Figure 19 Increase in the Number of Private Channels Will Impact the Channel-In-A-Box Market
Figure 20 International Broadcasters are Gaining the Highest Traction in the Channel-In-A-Box Market
Figure 21 Europe Holds the Maximum Share in the Channel-In-A-Box Market (2015)
Figure 22 The Channel-In-A-Box Market in the Asia-Pacific Region is Projected to Witness the Highest Growth Potential During the Forecast Period
Figure 23 Channel-In-A-Box Regional Lifecycle the Middle East & Africa Region has Started Gaining Momentum in the Channel-In-A-Box Market
Figure 24 Playout Automation and Channel-In-A-Box: Market Evolution
Figure 25 Playout Automation and Channel-In-A-Box Market Segmentation
Figure 26 Drivers, Restraints, Opportunities and Challenges for Playout Automation & Channel-In-A-Box Market
Figure 27 Playout Automation Value Chain
Figure 28 Channel-In-A-Box Value Chain
Figure 29 Porters Five Forces Analysis: Playout Automation Market
Figure 30 Porters Five Forces Analysis: Channel-In-A-Box Market
Figure 31 National Broadcasters Segment in Playout Automation Market is Projected to Grow at the Highest CAGR During the Forecast Period
Figure 32 International Broadcasters Segment in Playout Automation Market is Expected to Show Considerable Growth in the Latin American Region
Figure 33 National Broadcasters Segment in Playout Automation Market is Expected to Show Considerable Growth in the Latin American Region
Figure 34 International Broadcasters Segment in Channel-In-A-Box Market is Projected to Grow at the Highest CAGR During the Forecast Period
Figure 35 International Broadcasters Segment in Channel-In-A-Box Market is Expected to Show Considerable Growth in the Latin American Region
Figure 36 National Broadcasters Segment in Channel-In-A-Box Market is Expected to Show Considerable Growth in the Asia-Pacific Region
Figure 37 News Segment Holds the Largest Market Size in the Playout Automation Market
Figure 38 News Segment is Expected to Show Considerable Growth in the Latin American Region
Figure 39 Sports Segment is Expected to Show Considerable Growth in the Middle East & Africa
Figure 40 Entertainment Segment is Expected to Show Significant Growth in the Asia-Pacific Region
Figure 41 Cartoons & Lifestyle Segment is Expected to Show Considerable Growth in the Asia-Pacific Region
Figure 42 News Segment Holds the Largest Market Size in the Channel-In-A-Box Market
Figure 43 News Segment is Expected to Show Considerable Growth in the Latin American Region
Figure 44 Sports Segment is Expected to Show Considerable Growth in the Asia-Pacific Region
Figure 45 Entertainment Segment is Expected to Show Considerable Growth in the Asia-Pacific Region
Figure 46 Cartoons & Lifestyle Segment is Expected to Grow at the Highest CAGR in the Asia-Pacific Region
Figure 47 Latin America Will Exhibit the Highest Growth Rate in the Playout Automation Market
Figure 48 Asia-Pacific Will Exhibit the Highest Growth Rate in the Channel-In-A-Box Market
Figure 49 Geographic Snapshot Latin America is Emerging as the New Hotspot in Playout Automation Market
Figure 50 Geographic Snapshot (2015-2020): Latin America is an Attractive Destination for the Overall Playout Automation Market
Figure 51 Geographic Snapshot Asia-Pacific is Emerging as the New Hotspot in Channel-In-A-Box Market
Figure 52 Geographic Snapshot (2015-2020): Asia-Pacific is an Attractive Destination for the Overall Channel-In-A-Box Market
Figure 53 Europe Playout Automation Market Snapshot: News, Sports, and Entertainment are Expected to Contribute Maximum Share to the Market in 2015
Figure 54 Europe Channel-In-A-Box Market Snapshot: News, Sports, and Entertainment are Expected to Contribute Maximum Share to the Market in 2015
Figure 55 North America Playout Automation Market Snapshot: Sports, News, and Entertainment are Expected to Contribute Maximum Share to the Market in 2015
Figure 56 North America Channel-In-A-Box Market Snapshot: Sports, News, and Entertainment are Expected to Contribute Maximum Share to the Market in 2015
Figure 57 Asia-Pacific Playout Automation Market Snapshot: News, Sports, and Entertainment are Expected to Contribute Maximum Share to the Market in 2015
Figure 58 Asia-Pacific Channel-In-A-Box Market Snapshot: News, Sports, and Entertainment are Expected to Contribute Maximum Share to the Market in 2015
Figure 59 Latin America Playout Automation Market Snapshot: Sports, News, and Entertainment are Expected to Contribute Maximum Share to the Market in 2015
Figure 60 Latin America Channel-In-A-Box Market Snapshot: Sports, News, and Entertainment are Expected to Contribute Maximum Share to the Market in 2015
Figure 61 Middle East & Africa Playout Automation Market Snapshot: News, Sports, and Entertainment are Expected to Contribute Maximum Share to the Market in 2015
Figure 62 Middle East & Africa Channel-In-A-Box Market Snapshot: News, Sports, and Entertainment are Expected to Contribute Maximum Share to the Market in 2015
Figure 63 Companies Adopted Partnerships/Agreements/Collaborations as the Key Growth Strategies to Strengthen Their Position in the Market
Figure 64 Market Evaluation Framework
Figure 65 Battle for Market Share: Agreements, Partnerships, and Collaborations Were the Key Strategies Adopted By the Companies
Figure 66 Geographic Revenue Mix of Top Five Market Players
Figure 67 Harmonic, Inc: Company Snapshot
Figure 68 Harmonic, Inc: SWOT Analysis
Figure 69 Pebble Beach Systems: SWOT Analysis
Figure 70 Evertz Microsystems, Ltd: Company Snapshot
Figure 71 Evertz Microsystems, Ltd: SWOT Analysis
Figure 72 Cinegy LLC: SWOT Analysis
Figure 73 Imagine Communications Corp.: SWOT Analysis
Growth opportunities and latent adjacency in Playout Automation & Channel-in-a-Box Market
Need information on cloud playout Automation, the industry trends, where the industry is heading and industry wise pain points
Gather insight into Playout modernization for public and private broadcasters in Canada
Require data points on playout and broadcasting market
Detailed understanding of the global playout market specifically on sizing of key technology components that go into the playout market