
Chemical Concentration Monitor Market Size, Share & Trends

Chemical Concentration Monitor Market by Medium (Liquid, Gas), Fiber-optic Concentration Monitor, Amperometric lon Sensor, Optical Technology, Semiconductor and Electronics Manufacturing. Water & Wastewater Treatment - Global Forecast to 2030


OVERVIEW
Source: Secondary Research, Interviews with Experts, MarketsandMarkets Analysis
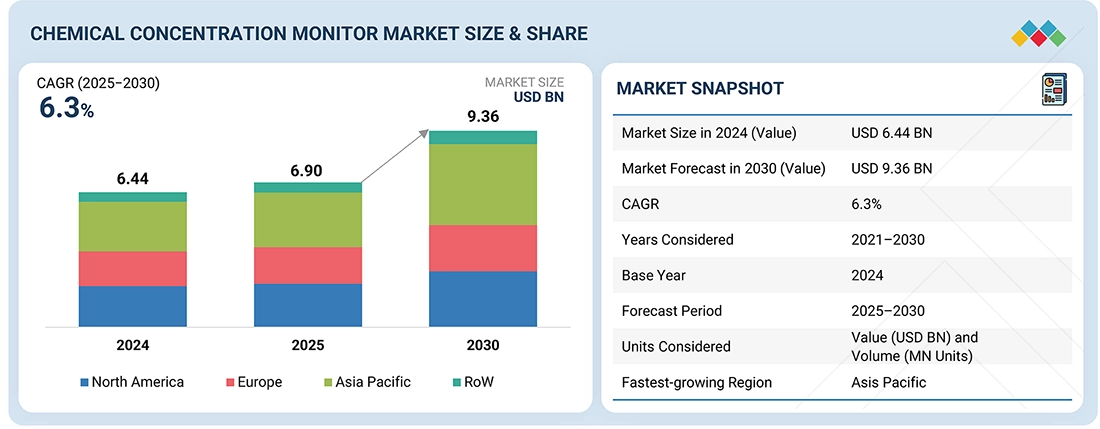
The global chemical concentration monitor market is projected to grow from USD 6.90 billion in 2025 to USD 9.36 billion by 2030, at a CAGR of 6.3% during the forecast period. Market growth is driven by the increasing demand for real-time and continuous concentration measurement across industries such as chemical processing, pharmaceuticals, water treatment, and semiconductors. The adoption of automated and non-contact monitoring technologies, including optical, ultrasonic, and refractometric sensors, is enhancing process control accuracy and operational efficiency. Additionally, advancements in IoT connectivity, inline monitoring systems, and data analytics are enabling predictive maintenance and quality assurance, further accelerating market penetration across liquid- and gas-based concentration measurement applications.
Market Size & Forecast
KEY TAKEAWAYS
- Stationary monitors lead the market due to their high accuracy, continuous measurement capability, and suitability for fixed industrial integration.
- The liquid medium segment dominates because industries widely require continuous monitoring of dissolved substances for quality control and compliance.
- Hardware holds the largest share since core sensing components like optical, ultrasonic, and refractometric sensors are essential for real-time monitoring.
- Optical technology leads due to its high accuracy, non-contact measurement, low maintenance, and suitability for harsh industrial environments.
- Amperometric ion sensors dominate because of their high sensitivity, fast response, and suitability for continuous real-time ionic species detection.
- Water & wastewater treatment leads the market due to high demand for real-time chemical dosing, pH control, and compliance with environmental regulations.
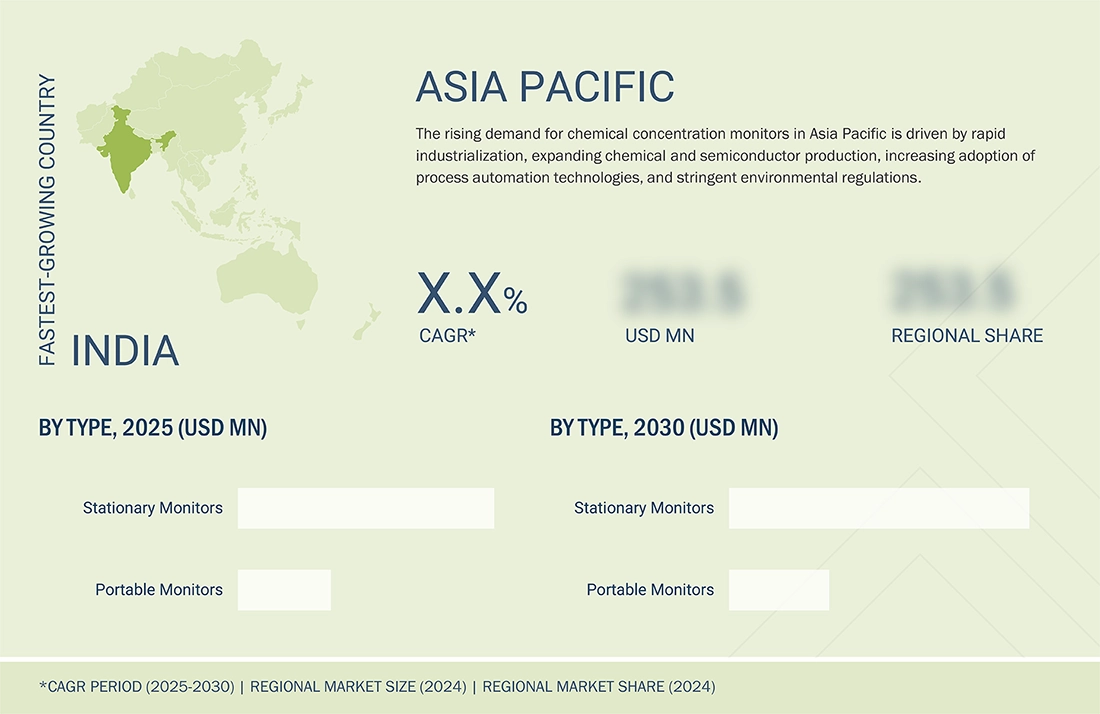
- Asia Pacific holds the largest market share of 36.7% due to rapid industrial growth, expanding chemical and semiconductor production, and rising adoption of automated monitoring solutions.
- Major players/Stars in the chemical concentration monitor market are Thermo Fisher Scientific, Emerson Electric Co., ABB Ltd., Endress+Hauser Group, and Veralto SME/Startups in the chemical concentration monitor market are FREDsense Technologies, Forever Analytical, Kompass, Grapheal
Chemical concentration monitors are precision instruments designed to continuously measure and control the concentration of chemicals or compounds in liquid or gas media during industrial and environmental processes. These systems utilize advanced optical, ultrasonic, refractometric, and electrochemical sensing technologies to ensure accurate, real-time monitoring of chemical mixtures. They are widely deployed across industries such as chemical processing, pharmaceuticals, semiconductors, water & wastewater treatment, and food & beverages to optimize quality, safety, and process efficiency. With rising emphasis on process automation, environmental compliance, and data-driven manufacturing, the chemical concentration monitor market is experiencing strong growth. Technological advancements in inline monitoring, IoT-enabled analytics, and digital integration are further enhancing system reliability and enabling smart, continuous process control across diverse industrial applications.
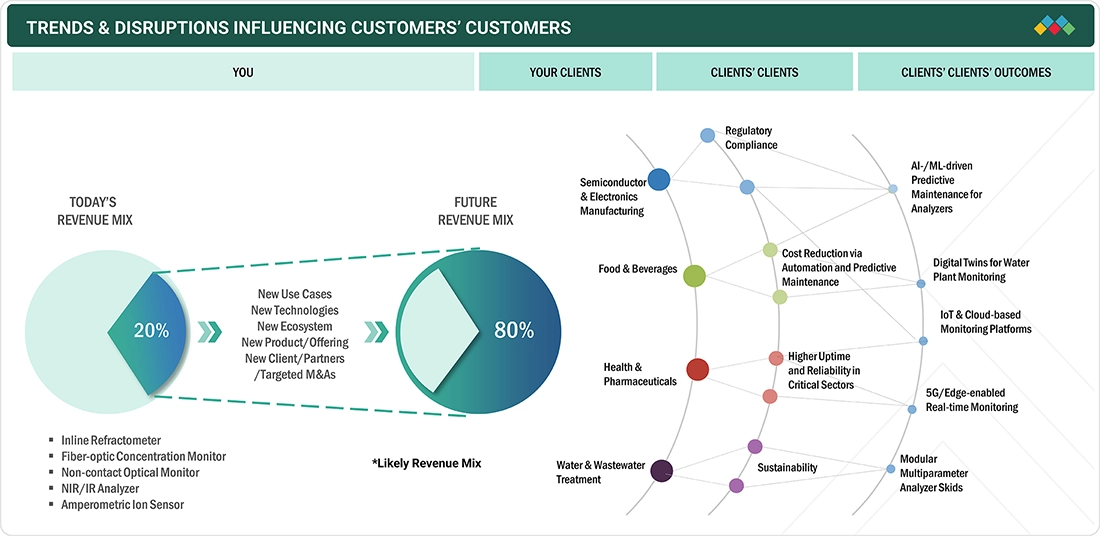
TRENDS & DISRUPTIONS IMPACTING CUSTOMERS' CUSTOMERS
The impact on the chemical concentration monitor market is shaped by evolving industrial automation needs and advancements in process analytics. Over the next 4–5 years, companies’ product portfolios are expected to shift from conventional offline concentration meters to smart, real-time, and inline chemical monitoring systems. Two key trends are driving this transformation: the integration of IoT- and AI-based analytics for predictive process control and quality assurance, and the development of multi-parameter, high-sensitivity sensing technologies that enable accurate and continuous monitoring in complex industrial environments. These innovations are enhancing operational efficiency, regulatory compliance, and sustainability across chemical manufacturing, pharmaceuticals, water treatment, and semiconductor processing applications.
Source: Secondary Research, Interviews with Experts, MarketsandMarkets Analysis
MARKET DYNAMICS
Level
-
Growing demand for real-time chemical analysis in industries such as healthcare & pharmaceuticals

-
Stringent food & beverage safety standards

Level
-
High upfront cost of chemical concentration monitors

Level
-
Expansion into emerging markets and decentralized treatment systems

-
Expansion into high-precision industries such as batteries, semiconductors, and electronics

Level
-
Integration challenges associated with legacy infrastructure

-
Standardization and interoperability issues

Source: Secondary Research, Interviews with Experts, MarketsandMarkets Analysis
Driver: Growing demand for real-time chemical analysis in industries such as healthcare & pharmaceuticals
The increasing requirement for real-time chemical analysis in pharmaceuticals and healthcare represents a critical market driver for chemical concentration monitors. Regulatory frameworks such as the US FDA’s Process Analytical Technology (PAT) guidance and the European Medicines Agency’s expectations for continuous process verification have compelled manufacturers to embed real-time monitoring into drug development and production. In pharmaceutical manufacturing, minute deviations in chemical concentration, whether in active pharmaceutical ingredient (API) synthesis, solvent residues, or contaminant levels can compromise both safety and efficacy, and potentially lead to costly batch failures or regulatory non-compliance.
Restraint: High upfront cost of chemical concentration monitors
One of the primary restraints on the growth of the chemical concentration monitor market is the high upfront cost associated with acquiring, installing, and commissioning advanced monitoring systems. These systems often incorporate precision sensors (optical, electrochemical, ultrasonic), real-time data acquisition hardware, and sophisticated software for calibration, data processing, and integration with process control systems. For small and medium-sized enterprises (SMEs), particularly in cost-sensitive regions, this investment can be prohibitive, leading many to continue relying on manual sampling or legacy instrumentation.
Opportunity: Expansion into emerging markets and decentralized treatment systems
The chemical concentration monitor market presents a significant growth opportunity through expansion into emerging markets and the adoption of decentralized treatment systems. Rapid urbanization and increasing water scarcity in regions such as Southeast Asia, Latin America, and Africa are driving demand for localized water treatment solutions that require precise chemical monitoring. Decentralized treatment systems, including modular membrane filtration units and bio-organic flocculant-based solutions, enable flexible deployment, reduced infrastructure costs, and faster implementation in areas with limited access to centralized facilities.
Challenge: Integration challenges associated with legacy infrastructure
Integration of chemical concentration monitors with legacy infrastructure presents a significant barrier to market adoption, particularly in facilities with aging control systems, proprietary communication protocols, and outdated sensors. Many industrial plants still rely on legacy SCADA, PLC, or analog instrumentation that were not designed for real-time digital data exchange; integrating modern concentration monitors, which often require Ethernet, OPC UA, IoT connectivity, or higher-resolution analog/digital inputs frequently demands extensive retrofitting, middleware or gateway devices.
Chemical Concentration Monitor Market: COMMERCIAL USE CASES ACROSS INDUSTRIES
| COMPANY | USE CASE DESCRIPTION | BENEFITS |
|---|---|---|
 |
Integrated a network of inline analyzers and sensors within its ultrapure water and wet chemical systems to continuously track chemical purity and contamination in semiconductor fabrication processes. These monitors provide real-time insight into the cleanliness of acids, solvents, and rinsing solutions used in critical steps such as etching and wafer cleaning. | Enhanced control over process stability | Improved overall yield reliability |Minimized contamination-related downtime across advanced manufacturing lines |
 |
Adopted advanced Raman and NIR analyzers as part of its process analytical technology framework to monitor active ingredients and solvent composition directly within continuous manufacturing lines. The sensors enable real-time visibility of formulation quality during crystallization and blending. | Improved product consistency | Enhanced compliance with regulatory standards | Enabled a shift from batch-based to data-driven continuous manufacturing practices |
 |
Deployed optical and electrochemical concentration monitors in beverage and dairy production facilities to ensure the correct balance of ingredients such as sugars, salts, and solids during formulation. These sensors are integrated directly into production lines for automated quality control. | Ensured product uniformity |Enhanced flavor and texture consistency across brands |Streamlined production by reducing reliance on manual testing |
 |
Implemented electrochemical and optical sensors within process loops to monitor the concentration of key chemicals and slurries used in semiconductor etching and polishing operations. These analyzers feed data into digital control systems for process optimization. | Achieved higher process uniformity | Improved chemical utilization efficiency | Strengthened process repeatability across production modules |
 |
Utilized inline refractometers and conductivity sensors to manage syrup blending, carbonation, and ingredient consistency across global bottling lines. These systems enable automated verification of product formulation at every stage of production. | Maintained consistent product quality across plants worldwide | Enhanced process reliability |
Logos and trademarks shown above are the property of their respective owners. Their use here is for informational and illustrative purposes only.
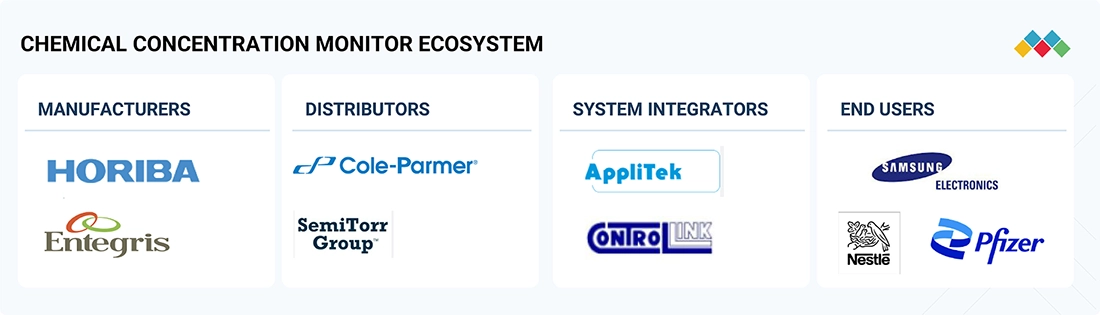
MARKET ECOSYSTEM
The chemical concentration monitor ecosystem involves identifying and analyzing the interconnected relationships among various stakeholders, including manufacturers, system integrators, distributors, and end users. These entities collaborate to develop and deploy advanced monitoring solutions that enable real-time, precise, and automated measurement of chemical concentrations across industrial and laboratory environments. Manufacturers such as HORIBA and Entegris design and produce complete monitoring systems integrating optical, ultrasonic, and electrochemical sensors with intelligent control and data acquisition software. System integrators, including AppliTek and ControLink, play a key role in combining hardware and process intelligence by integrating IoT-based analytics platforms, automated sampling systems, and remote monitoring solutions for optimized process control. Distributors such as Cole-Parmer and SemiTorr Group ensure the effective supply, calibration, and installation of concentration monitoring instruments across global markets. End users, including leading companies such as Samsung Electronics, Nestlé, and Pfizer, deploy these systems for process optimization, quality control, and compliance monitoring across manufacturing, pharmaceutical production, and semiconductor fabrication facilities.
Logos and trademarks shown above are the property of their respective owners. Their use here is for informational and illustrative purposes only.
MARKET SEGMENTS
Source: Secondary Research, Interviews with Experts, MarketsandMarkets Analysis
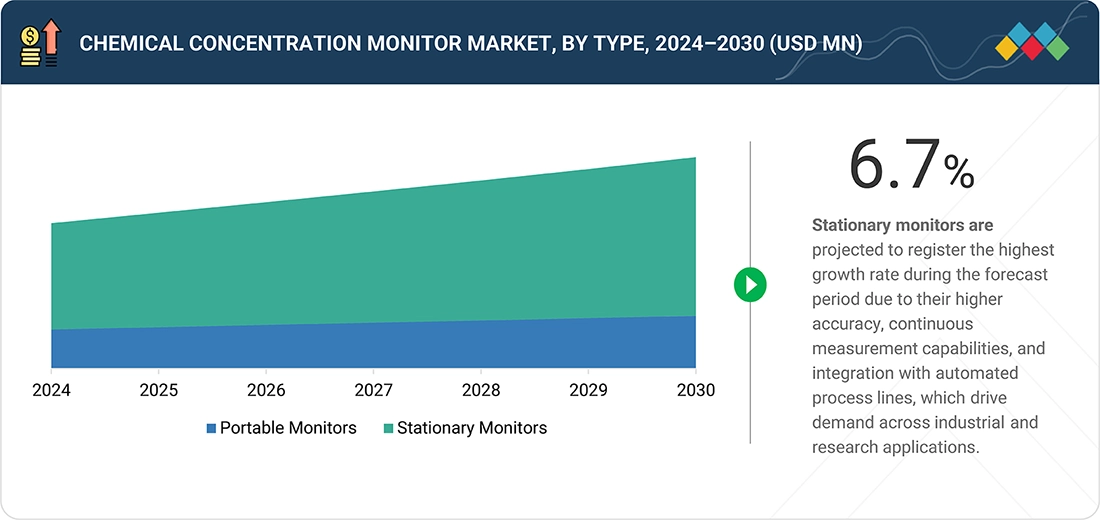
Chemical Concentration Monitor Market, By Type
Stationary monitors hold the largest market size due to their high accuracy, continuous monitoring capability, and suitability for industrial integration. They are widely used in chemical processing, pharmaceuticals, and water treatment plants where fixed installations ensure real-time measurement, process consistency, and long-term reliability essential for automated and large-scale operations.
Chemical Concentration Monitor Market, By Medium
The liquid medium holds the largest market size in the chemical concentration monitor market due to its extensive use in industries such as water treatment, chemical processing, food & beverages, and pharmaceuticals, where continuous monitoring of dissolved substances and reagents is essential for process optimization, quality control, and regulatory compliance.
Chemical Concentration Monitor Market, By Offering
The hardware segment holds the largest market size as it comprises the core sensing and measurement components such as optical, ultrasonic, and refractometric sensors—essential for real-time monitoring. Growing adoption of inline and fixed installation systems across industries drives higher demand for robust, precise, and durable hardware solutions over software or services.
Chemical Concentration Monitor Market, By Technology
Optical technology holds the largest market size in the chemical concentration monitor market due to its high measurement accuracy, non-contact operation, and real-time monitoring capability. It is widely adopted across pharmaceutical, semiconductors, and water treatment industries for precise concentration detection, minimal maintenance, and compatibility with automated and harsh industrial environments.
Chemical Concentration Monitor Market, By Product
The amperometric ion sensor holds the largest market size due to its high sensitivity, fast response, and wide applicability in detecting ionic species across water treatment, chemical processing, and pharmaceutical industries. Its cost-effectiveness, compatibility with automated monitoring systems, and ability to provide continuous real-time measurement further drive its dominant adoption globally.
Chemical Concentration Monitor Market, By End User
The water & wastewater treatment industry holds the largest market share due to the growing need for real-time monitoring of chemical dosing, pH, and contaminant levels to ensure compliance with stringent environmental regulations. Continuous concentration monitoring enhances treatment efficiency, safety, and sustainability, driving widespread adoption across municipal and industrial facilities.
REGION
Asia Pacific is expected to be fastest-growing segment in the chemical concentration monitor market during the forecast period
Asia Pacific is expected to witness the highest CAGR in the chemical concentration monitor market due to rapid industrial growth, rising investments in chemical, semiconductor, and pharmaceutical production, and the expanding adoption of automation. Strong government focus on environmental monitoring, water treatment infrastructure, and industrial modernization further drives regional demand for advanced concentration monitoring solutions.
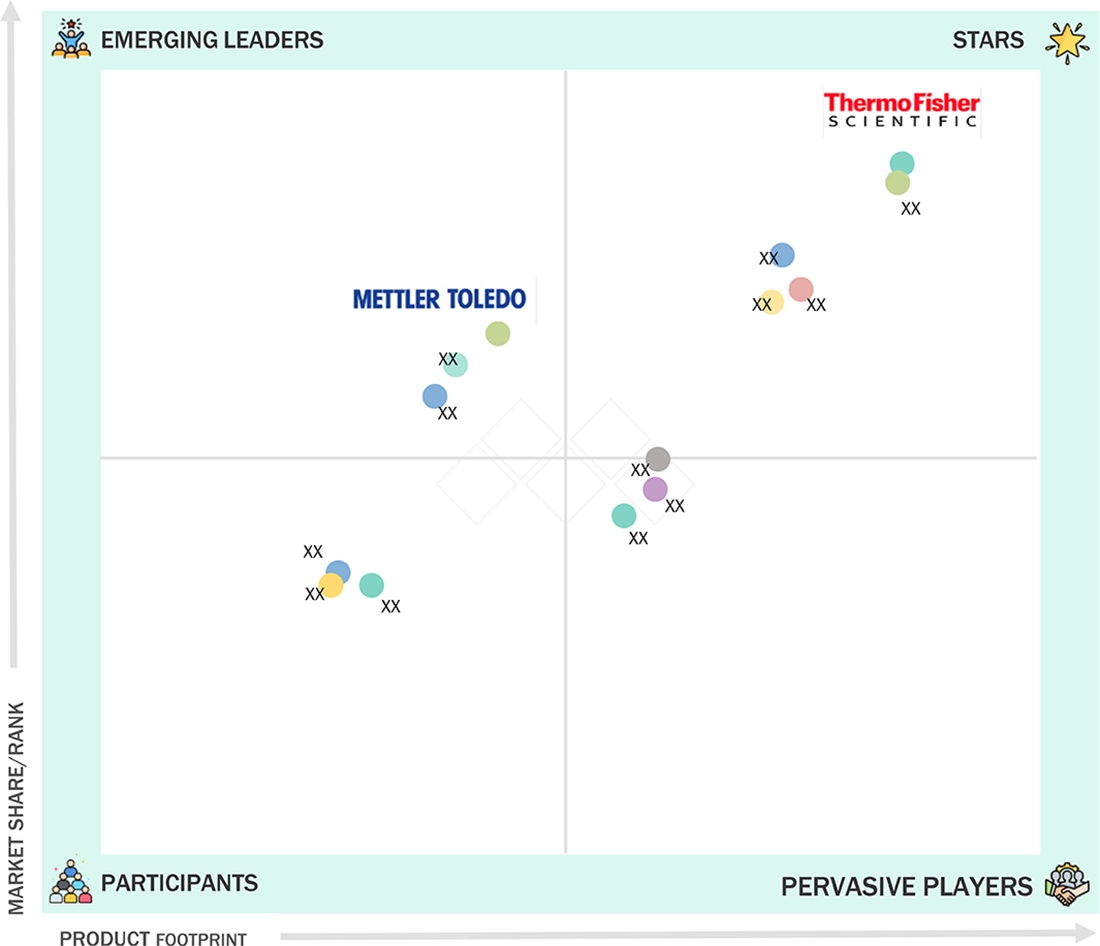
Chemical Concentration Monitor Market: COMPANY EVALUATION MATRIX
In the chemical concentration monitor market matrix, Thermo Fisher Scientific (Star) leads with a strong global presence and an extensive portfolio of advanced concentration monitoring systems, spectroscopic analyzers, and process control solutions. The company’s continuous innovation in inline sensing technologies and digital analytics enables high precision and reliability across chemical, pharmaceutical, and semiconductor applications. Mettler-Toledo International Inc. (Emerging Leader) is gaining momentum with its real-time concentration measurement instruments integrated with smart calibration, automation, and data connectivity features. Its expanding adoption in laboratory and industrial environments positions it as a key contender in next-generation process analytics and quality monitoring solutions.
Source: Secondary Research, Interviews with Experts, MarketsandMarkets Analysis
KEY MARKET PLAYERS
MARKET SCOPE
| REPORT METRIC | DETAILS |
|---|---|
| Market Size in 2024 (Value) | USD 6.44 Billion |
| Market Forecast in 2030 (Value) | USD 9.36 Billion |
| Growth Rate | CAGR of 6.3% from 2025-2030 |
| Years Considered | 2021-2030 |
| Base Year | 2024 |
| Forecast Period | 2025-2030 |
| Units Considered | Value (USD Billion) and Volume (Million Units) |
| Report Coverage | Revenue Forecast, Company Ranking, Competitive Landscape, Growth Factors, and Trends |
| Segments Covered |
|
| Regional Scope | North America, Europe, Asia Pacific, and RoW |
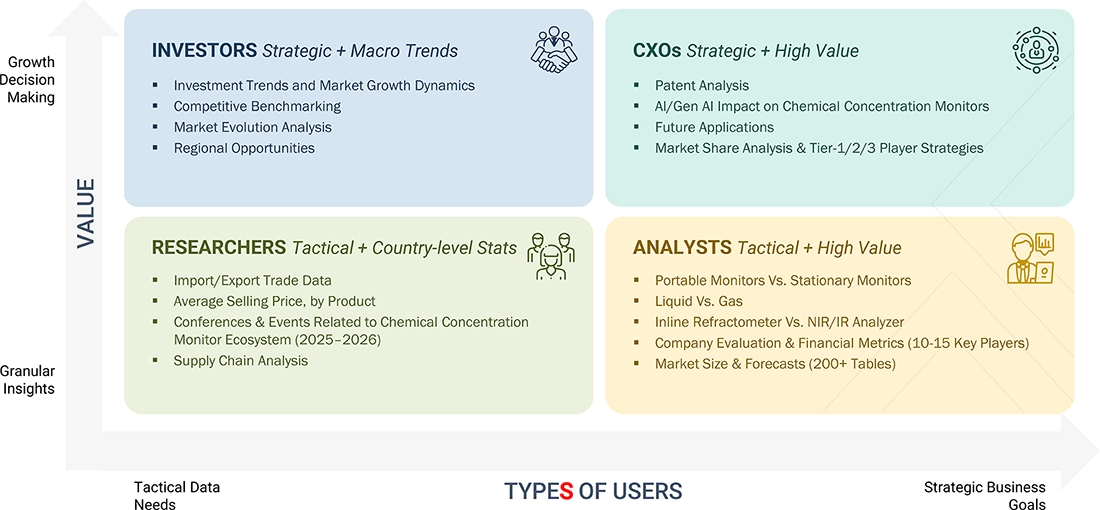
WHAT IS IN IT FOR YOU: Chemical Concentration Monitor Market REPORT CONTENT GUIDE
DELIVERED CUSTOMIZATIONS
We have successfully delivered the following deep-dive customizations:
| CLIENT REQUEST | CUSTOMIZATION DELIVERED | VALUE ADDS |
|---|---|---|
| Chemical Concentration Monitor Manufacturer/OEM |
|
|
| System Integrator/Process Automation Contractor |
|
|
| Regulatory/Environmental Agency |
|
|
| Industrial End User (Chemicals, Pharma, Semiconductors, Water Utilities) |
|
|
RECENT DEVELOPMENTS
- December 2024 : ABB launched the Sensi+ analyzer, a compact laser-based device for real-time monitoring of H2S, H2O, and CO2 contaminants in natural gas streams.
- Augut 2024 : ABB acquired the Födisch Group, a German company specializing in continuous emission monitoring systems (CEMS) and dust analyzers.
- June 2024 : Endress+Hauser introduced the Proline Teqwave MW 300/500, an inline measuring device for accurate monitoring of total solids in wastewater sludge.
- June 2024 : AMETEK introduced the WDG-V HP with methane detection capability, extending its application for hydrocarbons and alternative fuels.
Table of Contents
 Exclusive indicates content/data unique to MarketsandMarkets and not available with any competitors.
Methodology
The research study involved four major activities in estimating the chemical concentration monitor market size. Exhaustive secondary research was conducted to gather key information about the market and its peer markets. The subsequent step involved validating these findings, assumptions, and market estimates through primary research conducted with industry experts across the value chain. Both top-down and bottom-up approaches were used to estimate the market size. The market breakdown and data triangulation have been adopted to estimate the market sizes of segments and subsegments.
Secondary Research
During the secondary research process, various secondary sources were consulted to identify and collect the information required for this study. The secondary sources include annual reports, press releases, investor presentations of companies, white papers, and articles from recognized authors. Secondary research was primarily conducted to gather key information about the market’s value chain, the pool of key market players, market segmentation based on industry trends, regional outlook, and developments from both market and technology perspectives.
Primary Research
In primary research, various sources from both the supply and demand sides were interviewed to obtain the qualitative and quantitative insights required for this report. Primary sources from the supply side include experts such as CEOs, vice presidents, marketing directors, manufacturers, technology and innovation directors, end users, and related executives from multiple key companies and organizations operating in the chemical concentration monitor market ecosystem. After interacting with industry experts, brief sessions were conducted with highly experienced independent consultants to reinforce the findings from our primary research. This, along with the opinions of our in-house subject-matter experts, has led us to the findings described in the report. The breakdown of primary respondents is as follows:

Note: “Others” includes sales, marketing, and product managers.
To know about the assumptions considered for the study, download the pdf brochure
Market Size Estimation
In the market engineering process, both top-down and bottom-up approaches, as well as data triangulation methods, were employed to estimate and validate the size of the chemical concentration monitor market and its dependent submarkets. The research methodology used to estimate the market sizes includes the following:
A bottom-up procedure was employed to determine the overall size of the chemical concentration monitor market.
- Major companies that provide chemical concentration monitors were identified. This included analyzing company portfolios, product offerings, and presence across various regions.
- The segment-specific revenues of the companies, particularly those related to chemical concentration monitors, were determined.
- The product-specific revenues of the companies, particularly those related to chemical concentration monitors, were determined.
- These individual revenue figures were compiled to determine the total revenue generated across the identified companies within the sector.
- The global market size for chemical concentration monitors was obtained using this consolidated data.
The top-down approach was used to estimate and validate the total size of the chemical concentration monitor market.
- Identified top-line investments and spending in the ecosystem and major market developments to consider segment-level splits
- Estimated the overall chemical concentration monitor market size, then segmented the global market by allocating shares based on the segments considered
- Distributed the segment-level markets into regions and countries by aligning regional chemical concentration monitor activity with economic indicators, chemical concentration monitor manufacturing presence, and national development initiatives
Chemical Concentration Monitor Market : Top-Down and Bottom-Up Approach

Data Triangulation
After determining the overall market size using the market size estimation processes explained above, the market was divided into several segments and subsegments. Data triangulation and market breakdown procedures have been employed to complete the entire market engineering process and determine the exact statistics for each market segment and subsegment. The data has been triangulated by studying various factors and trends from the demand and supply sides of the chemical concentration monitor market.
Market Definition
The chemical concentration monitor market encompasses the design, development, and integration of advanced measurement systems used to detect and control the concentration of chemicals and compounds in liquid and gas media. These instruments provide real-time, precise, and automated monitoring essential for maintaining process efficiency, safety, and product quality across industrial and laboratory environments. Chemical concentration monitors integrate a range of sensing technologies, including optical, refractometric, ultrasonic, and electrochemical analyzers, along with intelligent control, data logging, and IoT connectivity platforms, to ensure accurate and continuous process tracking. These systems play a critical role in industries such as chemical processing, pharmaceuticals, semiconductors, water & wastewater treatment, and food & beverages, where maintaining optimal chemical balance is vital for process stability and regulatory compliance. Key components include sensors, transmitters, controllers, and calibration modules, which collectively enable efficient process automation and digital quality management. The market’s growth is driven by the rising demand for inline process monitoring, increasing emphasis on environmental compliance and resource optimization, and the global shift toward automated and data-driven industrial operations. Technological advancements such as AI-based analytics, IoT-enabled remote monitoring, and cloud-integrated process control systems are enhancing precision, scalability, and operational intelligence. As industries prioritize sustainability, waste reduction, and regulatory transparency, chemical concentration monitors are becoming increasingly indispensable for achieving high efficiency, ensuring safety, and optimizing continuous processes in modern industrial ecosystems.
Key Stakeholders
- Chemical concentration monitor manufacturers
- Sensor and analytical instrument suppliers
- System integrators and automation solution providers
- Process control and industrial IoT platform developers
- Distributors and calibration service providers
- Chemical, pharmaceutical, and semiconductor manufacturers
- Water and wastewater treatment operators
- Food and beverage processing companies
- Government and environmental regulatory agencies
- Research and development institutions
Report Objectives
- To define, describe, segment, and forecast the chemical concentration monitor market, by type, medium, offering, technology, product, end-use industry, and region, in terms of value
- To assess the chemical concentration monitor market size in four key regions: North America, Europe, Asia Pacific, and RoW, in terms of value
- To provide detailed information regarding drivers, restraints, opportunities, and challenges influencing the growth of the market
- To analyze the chemical concentration monitor value chain and ecosystem, along with the average selling price by product and region
- To strategically study the regulatory landscape, tariff, standards, patents, Porter’s five forces, import & export scenarios, trade values, and case studies pertaining to the market under study
- To understand micromarkets with regard to individual growth trends, prospects, and contributions to the overall market
- To assess opportunities in the market for stakeholders by identifying high-growth segments
- To provide details of the competitive landscape for market leaders
- To offer the impact of AI/Gen AI on the chemical concentration monitor market
- To outline the macroeconomic outlook for the regions under study
- To analyze strategies such as product launches, collaborations, acquisitions, and partnerships adopted by players in the chemical concentration monitor market
- To profile key market players and comprehensively analyze their ranking based on their revenue, market share, and core competencies
Available Customizations:
With the given market data, MarketsandMarkets offers customizations according to the specific requirements of companies. The following customization options are available for the report:
Country-wise Information:
- Country-wise breakdown for North America, Europe, Asia Pacific, and Rest of the World
Company Information:
- Detailed analysis and profiling of additional market players (up to five)
Key Questions Addressed by the Report
What is the projected market value of the chemical concentration monitor market?
The chemical concentration monitor market is projected to grow from approximately USD 6.90�billion in 2025 to USD 9.36�billion by 2030, at a CAGR of around 6.3�% during the forecast period.
Which region is expected to hold the largest share in the chemical concentration monitor market?
Asia Pacific is expected to dominate the chemical concentration monitor market due to rapid industrial growth, strong chemical, semiconductor, and pharmaceutical production, and rising adoption of automated monitoring solutions.
How is the chemical concentration monitor market segmented?
The chemical concentration monitor market is segmented by type (portable and stationary monitors), medium (liquid and gas), offering (hardware, software, services), product (e.g., amperometric ion sensors, optical monitors), technology (optical, ultrasonic, electrochemical, etc.), and end-use industries such as water & wastewater treatment, chemicals, pharmaceuticals, and semiconductors.
Which segment currently leads or is expected to grow significantly in the chemical concentration monitor market?
The stationary monitor segment leads the market due to its high accuracy and continuous monitoring capability, and the liquid medium segment dominates because of broad use in water treatment and process industries.
Who are the key players in the chemical concentration monitor market?
Key players in the chemical concentration monitor market include Thermo Fisher Scientific Inc. (US), Emerson Electric Co. (US), ABB Ltd. (Switzerland), Endress+Hauser Group Services AG (Switzerland), and Veralto (US).
Need a Tailored Report?
Customize this report to your needs
Get 10% FREE Customization
Customize This ReportPersonalize This Research
- Triangulate with your Own Data
- Get Data as per your Format and Definition
- Gain a Deeper Dive on a Specific Application, Geography, Customer or Competitor
- Any level of Personalization
Let Us Help You
- What are the Known and Unknown Adjacencies Impacting the Chemical Concentration Monitor Market
- What will your New Revenue Sources be?
- Who will be your Top Customer; what will make them switch?
- Defend your Market Share or Win Competitors
- Get a Scorecard for Target Partners

Custom Market Research Services
We Will Customise The Research For You, In Case The Report Listed Above Does Not Meet With Your Requirements
Get 10% Free CustomisationTESTIMONIALS

Tetsuya Ohhira
Business Development Manager-Technology Business
Nikon Corporation,
Leading Japanese MNC specializing in optics and imaging productswww.nikon.com
MarketsandMarkets™ response
is quick. Their attitude is flexible and positive. Analyst Insights are globally considered and
significant. Client Services quickly respond to our inquiry and demand. Their wide range of global
surveys help us make our strategic plan.
We hope Knowledge Store will be easier to search
for a report.
VP - Marketing & Business Development
Leading Provider of Process Control Solutions
We engaged with MarketsandMarkets on a study to perform an analysis and recommend a Go-To-Market strategy for metrology and process control in the semiconductor market. The study was tailored to our targets and needs with well-defined milestones. Our overall experience with the MarketsandMarkets team was very good throughout the project in all aspects including the analysis methodologies used, the quality and depth of primary and secondary data sets, the professionalism and flexibility of the team and the ability to meet the target schedule and milestones. We want to thank MarketsandMarkets team for a job well done.


Growth opportunities and latent adjacency in Chemical Concentration Monitor Market