
CIP Chemicals Market

CIP Chemicals Market by Chemistry, Process Type (Single-use Cleaning and Recirculated Cleaning), End-use Industry (Chemicals, Food & Beverage, Pharmaceutical & Biotechnology, Cosmetics, Textiles), and Region - Global Forecast to 2029


OVERVIEW
Source: Secondary Research, Interviews with Experts, MarketsandMarkets Analysis
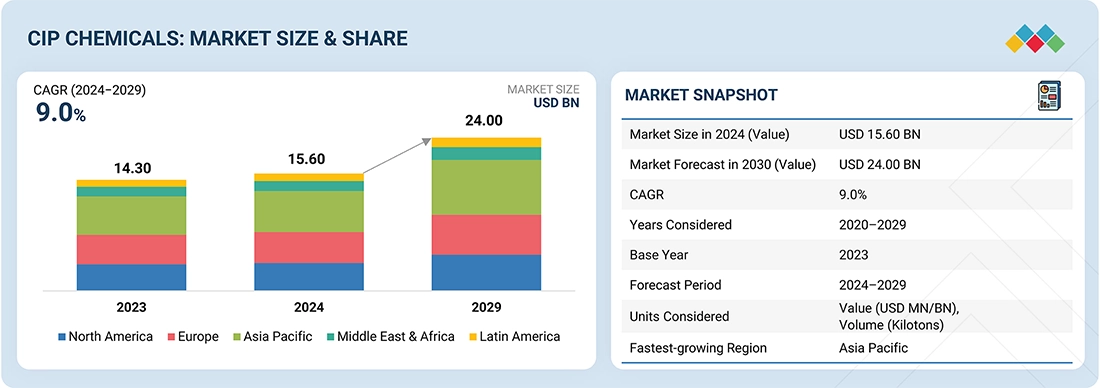
The global CIP chemicals market is projected to grow from USD 15.60 billion in 2024 to USD 24.00 billion by 2029, at a CAGR of 9.0%. The increasing usage of CIP chemicals like alkaline and acid cleaners in the food & beverage industry in emerging economies is expected to drive the market during the forecast period.
KEY TAKEAWAYS
-
BY CHEMISTRYThe CIP chemicals market, by chemistry, is divided into alkaline cleaners, acid cleaners, disinfectants/sanitizers, enzyme-based cleaners, water conditioners, and other chemicals. Globally, enzyme-based cleaners hold the fourth largest market share in the CIP chemicals industry due to various factors. Advances in technology and formulation have enhanced enzyme-based cleaners, making them more effective for a broader range of applications beyond dairy processing.
-
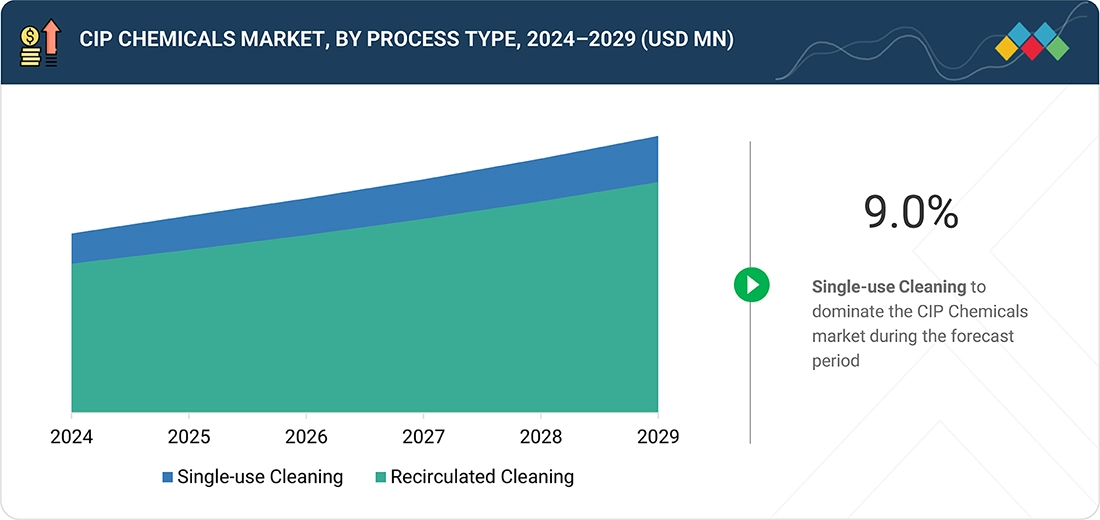
BY PROCESS TYPESingle-use cleaning holds the second-largest market share in terms of value. Single-use systems provide operational efficiency. They make cleaning easier by minimizing complex cleaning protocols associated with reusable systems. With single-use CIP systems, the preparation of cleaning solutions is only required once and then disposed of, which reduces the time and effort needed for cleaning operations.
-
BY END-USE INDUSTRYCosmetics hold a prominent market share. The selection of CIP chemicals for cosmetic manufacture often requires special attention to the challenges presented by cosmetic formulations, particularly given the presence of oils, pigments, and emollients, which tend to leave considerable residues on equipment surfaces.
-
BY REGIONThe Middle East & Africa form the fourth-largest market for CIP chemicals. Developing economies in Saudi Arabia, South Africa, and other countries are driving investments in advanced cleaning technologies that not only promise efficiency but also meet stringent environmental standards. As the chemical and petrochemical industries expand rapidly in these regions, utilizing effective CIP chemicals will be crucial for achieving operational efficiency, producing high-quality products, and complying with regulations and sustainability goals.
-
COMPETITIVE LANDSCAPEMajor market players are pursuing both organic and inorganic growth strategies, including partnerships, collaborations, and investments, to strengthen their market presence. For instance, ALFA LAVAL (Sweden), BASF (Germany), Ecolab (US), Novozymes (Denmark), and STERIS (US) have engaged in multiple agreements and strategic initiatives to address the rising demand for CIP chemicals across automotive, construction, and electronics applications.
Growing awareness of cleanliness, health, and sanitization has increased the adoption of CIP chemicals. Rising pressure to adopt sustainability and become more environmentally friendly also influences the development of innovative CIP solutions, which must meet both regulatory requirements and consumer expectations. Industries are expected to significantly expand the CIP chemicals market by prioritizing cleanliness and operational efficiency.
TRENDS & DISRUPTIONS IMPACTING CUSTOMERS' CUSTOMERS
The CIP chemicals market is witnessing significant trends and disruptions reshaping customer businesses across various industries. New chemical formulations and innovative manufacturing techniques are driving the development of chemicals with enhanced efficiency. The increasing focus on sustainability and environmental regulations is prompting companies to adopt eco-friendly solutions, enhancing their operational efficiency and reducing their carbon footprint.
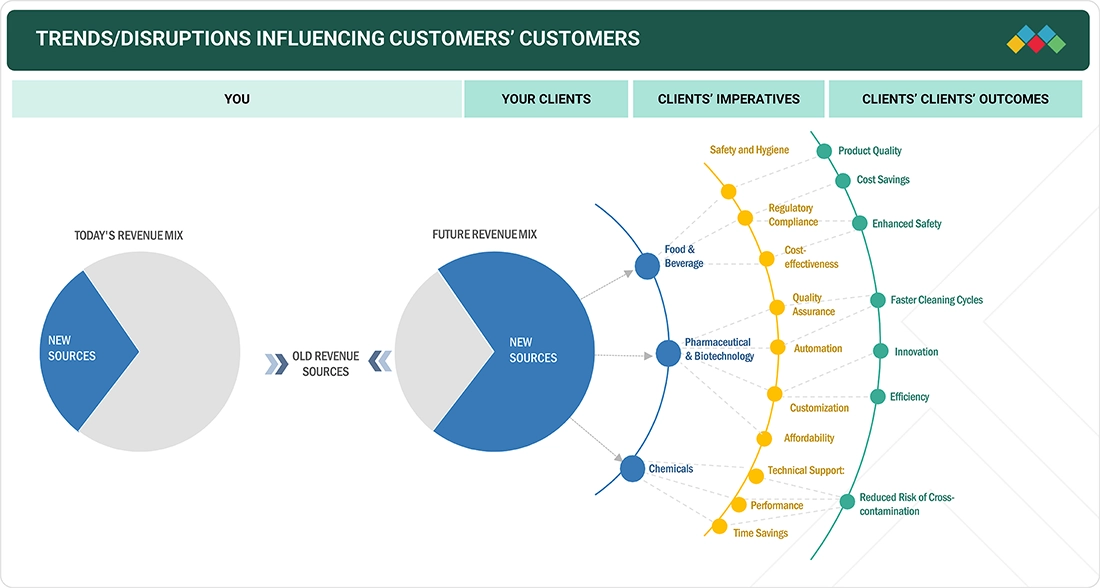
Source: Secondary Research, Interviews with Experts, MarketsandMarkets Analysis
MARKET DYNAMICS
Level
-
Expanding Biotechnology Applications Boost Demand for CIP Solutions

-
Enhancing CIP Performance with PAA Solutions

Level
-
Environmental Challenges of Acidic Cleaners in Cleaning Processes

-
Corrosion Concerns with Citric Acid in Cleaning Solutions

Level
-
Scaling CIP Solutions for Modern Food and Beverage Manufacturing

-
Sustainable Cleaning with Enzyme-based CIP Solutions

Level
-
Complexities of Recycling CIP Cleaning Solutions

Source: Secondary Research, Interviews with Experts, MarketsandMarkets Analysis
Driver: Expanding Biotechnology Applications Boost Demand for CIP Solutions
The rising demand for biotechnology is significantly influencing the CIP chemicals market, driven by the need for stringent hygiene and sanitation standards in biopharmaceutical manufacturing. As the biotechnology sector expands, particularly in areas such as biopharmaceuticals and vaccines, there is an increasing emphasis on maintaining sterile environments to ensure product safety and efficacy. CIP systems play a critical role in this context by enabling the automated cleaning of equipment and surfaces without disassembly, thereby minimizing contamination risks and ensuring compliance with regulatory requirements.
Restraint: Environmental Challenges of Acidic Cleaners in Cleaning Processes
The environmental impact of acidic cleaners used in CIP systems presents a considerable challenge, particularly within the food and beverage industry. Although cleaners such as hydrochloric acid, phosphoric acid, and citric acid are highly effective in removing mineral deposits and biofilms from equipment, their use introduces several ecological concerns. A primary concern is the risk of water contamination. Acidic cleaners can significantly lower the pH of wastewater, potentially endangering aquatic ecosystems if released untreated into natural water bodies.
Opportunity: Scaling CIP Solutions for Modern Food and Beverage Manufacturing
The growing demand for processed foods and beverages is significantly expanding the Clean-In-Place (CIP) chemicals market, as food manufacturers face increasing pressure to meet stringent hygiene standards in their food processing operations. With consumers increasingly favoring convenience and ready-to-eat products, manufacturers are adopting CIP systems to ensure thorough cleaning and sanitization of equipment without disassembly, reducing downtime and improving production efficiency. CIP systems utilize a range of cleaning agents specifically designed for various residues and surfaces.
Challenge: Complexities of Recycling CIP Cleaning Solutions
Reusing CIP chemicals poses a challenge, affecting both operational costs and product safety. Although recovering and reusing cleaning solutions can optimize costs, along with reducing environmental impact through decreased water and energy use, not all CIP protocols are suitable for this practice. For example, in sensitive environments such as cleanrooms or when handling allergenic products, there is a significant risk of cross-contamination from reusing solutions.
CIP Chemicals Market: COMMERCIAL USE CASES ACROSS INDUSTRIES
| COMPANY | USE CASE DESCRIPTION | BENEFITS |
|---|---|---|
 |
Implements automated and data-driven cleaning systems across multiple beverage and dairy production lines to optimize cleaning cycles, enhance hygiene, and improve process efficiency | Reduced cleaning time and resource consumption | Lower operational and maintenance costs | Improved energy and water efficiency |
 |
Designs and installs advanced cleaning systems for food and beverage processing equipment to ensure consistent hygiene, efficient changeovers, and minimal waste generation | Improved system reliability and cleaning uniformity | Reduced energy footprint during sanitation cycles |
 |
Develops advanced cleaning recovery and fluid filtration units for food, beverage, and pharmaceutical manufacturing to extend the usability of cleaning solutions and optimize resource efficiency | High recovery rates of cleaning fluids minimizing waste | Decrease in effluent treatment costs |
 |
Integrates validated, automated cleaning systems within pharmaceutical and consumer healthcare plants to maintain aseptic processing standards and product safety | Reliable validation and audit readiness across global facilities | Lower occupational exposure to hazardous substances |
Logos and trademarks shown above are the property of their respective owners. Their use here is for informational and illustrative purposes only.
MARKET ECOSYSTEM
The CIP chemicals ecosystem comprises raw material suppliers providing chemicals to manufacturers, manufacturers conducting research & development of the final products for use in various industries, and intermediaries & distributors providing a link between manufacturers and end users by supplying final products. They work together to supply the final products to end users in different industries. It involves a series of processes, from raw material procurement to manufacturing the end products and distributing them to end users for further use in various end-use industries.
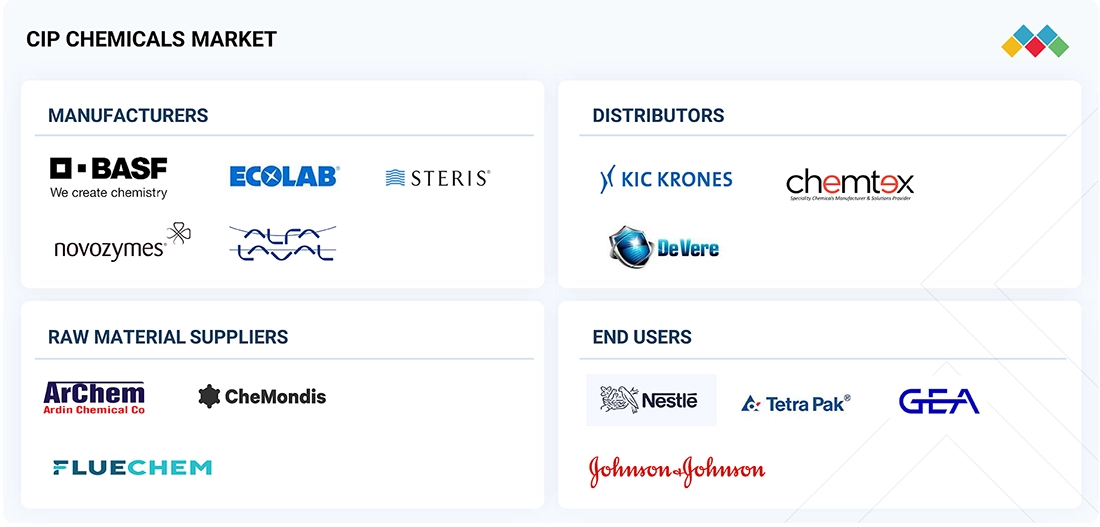
Logos and trademarks shown above are the property of their respective owners. Their use here is for informational and illustrative purposes only.
MARKET SEGMENTS
Source: Secondary Research, Interviews with Experts, MarketsandMarkets Analysis
CIP Chemicals Market, By Chemistry
The alkaline cleaners, by chemistry has the largest market during the forecast period. Alkaline cleaners are primarily growing in the CIP chemicals market due to their effectiveness in cleaning a wide range of organic and inorganic residues. Such chemicals are increasingly finding their applications in various industries, mainly food and beverage, pharmaceuticals, and biotechnology. Alkaline cleaners are largely made up of agents such as sodium hydroxide (caustic soda) and potassium hydroxide (caustic potash), which break down fats, oils, proteins, and other recalcitrant contaminants amassed on equipment surfaces due to the production processes.
CIP Chemicals Market, By Process Type
The recirculated cleaning by process type is the fastest growing during the forecast period in terms of value. CIP have developed into a strong leader in the growth of recirculated cleaning process type. It is an efficient and hygienic means for diverse industries, such as food and beverage, pharmaceuticals, and biotechnology. Chemicals and water usage are lower than that in single-use systems due to recirculated cleaning. This can help companies minimize waste as well as lower operational costs; in regions where water is scarce, this would be particularly helpful.
CIP Chemicals Market, By End Use Industry
Chemicals by end-use industry to be the fourth fastest growing segment for forecasted period in terms of value. This is further divided into specialty chemicals and petrochemicals. In the manufacture of specialty chemicals, trace contaminants can easily degrade a product, so it needs to make sure that its CIP chemicals like caustic soda, nitric acid, and phosphoric acid will effectively remove organic residues, mineral deposits, and all other contaminants in reactors, storage tanks, and pipelines. In the petrochemical industry, where processes often involve complex mixtures and high temperatures, CIP systems help clean in a much faster manner between different product batches with an eventual reduction in downtime, maximizing production efficiency.
REGION
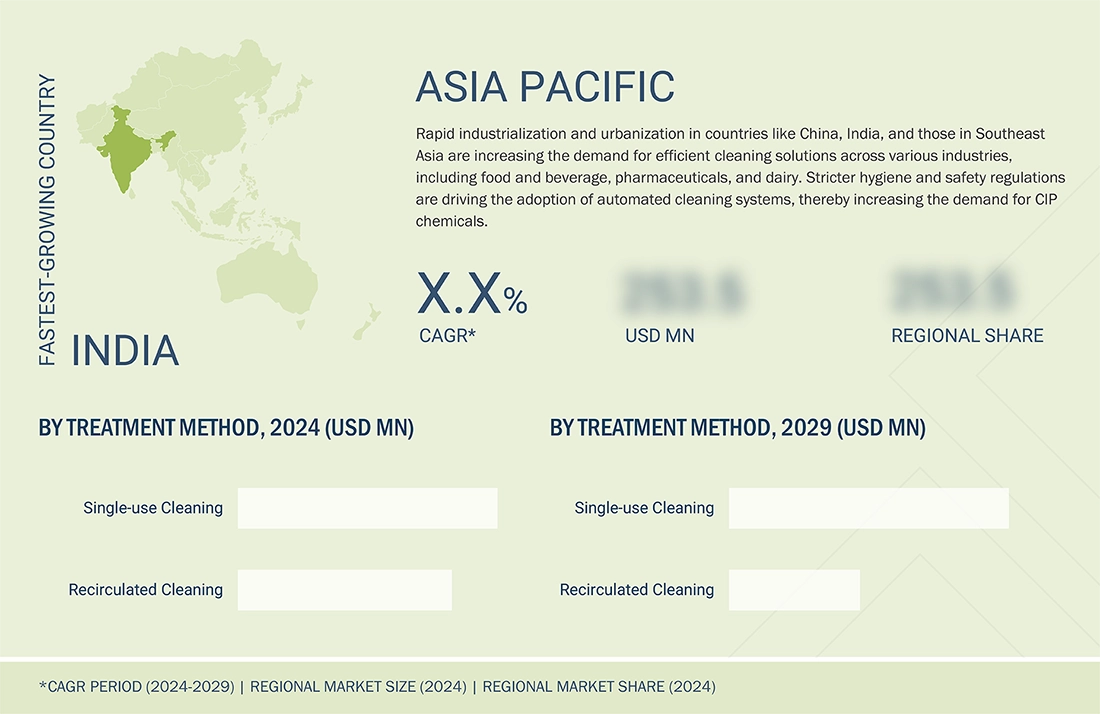
Asia Pacific to be fastest-growing region in global CIP chemicals market during forecast period
The Asia Pacific is expected to hold the highest CAGR during the forecast period. The region has significant potential for growth, driven by advancements in technology, increasing consumer demand, and shifting regulatory frameworks. In a maturing market, innovation in product lines and digital transformation will shape the future expansion of its growth. This is expected to further drive demand for environmentally friendly and sustainable solutions, particularly in sectors such as cosmetics, food & beverages, and pharmaceuticals.
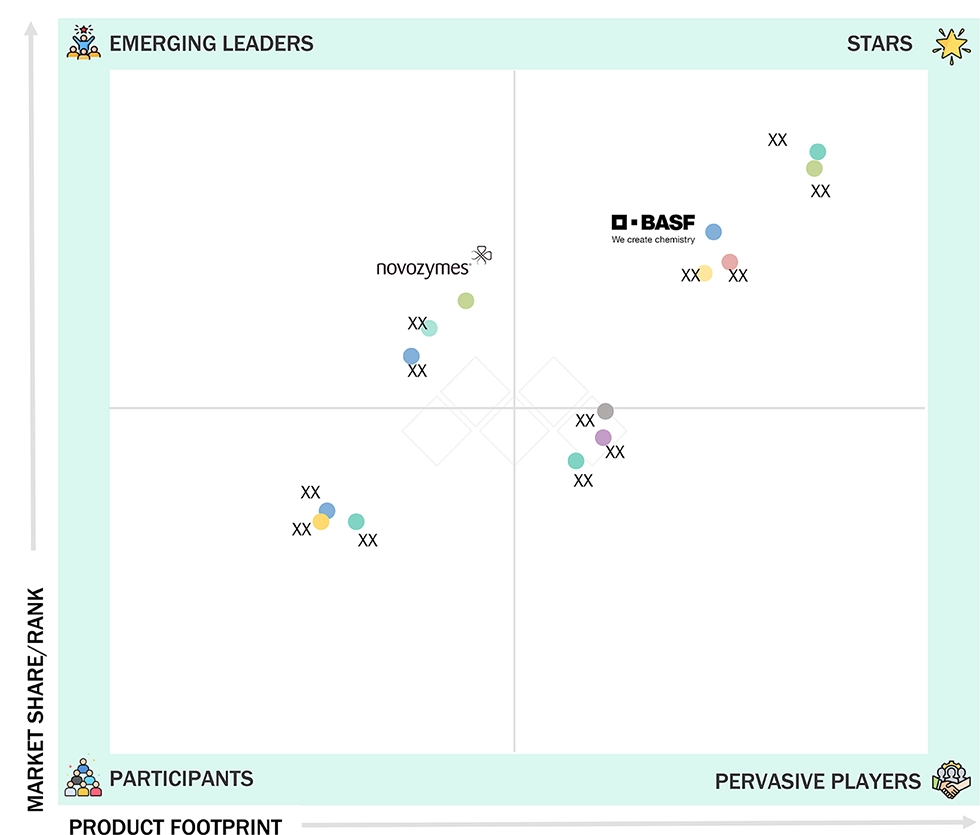
CIP Chemicals Market: COMPANY EVALUATION MATRIX
In the CIP chemicals market matrix, BASF (Star) leads with a strong market share and a comprehensive portfolio of cleaning and sanitation solutions, including acidic, alkaline, enzymatic, and specialty CIP chemicals, widely adopted across food & beverage, dairy, pharmaceutical, and beverage processing applications. Novozymes (Emerging Leader) is gaining visibility with its specialized CIP formulations and tailored cleaning solutions for high-performance and sensitive processes, strengthening its position through innovation and niche product offerings.
Source: Secondary Research, Interviews with Experts, MarketsandMarkets Analysis
KEY MARKET PLAYERS
MARKET SCOPE
| REPORT METRIC | DETAILS |
|---|---|
| Market Size in 2024 (Value) | USD 15.60 Billion |
| Market Forecast in 2029 (Value) | USD 24.00 Billion |
| Growth Rate | CAGR of 9.0% from 2024-2029 |
| Years Considered | 2020-2029 |
| Base Year | 2023 |
| Forecast Period | 2024–2029 |
| Units Considered | Value (USD Million/Billion), Volume (Kilotons) |
| Report Coverage | Revenue forecast, company ranking, competitive landscape, growth factors, and trends |
| Segments Covered |
|
| Regions Covered | North America, Asia Pacific, Europe, South America, Middle East & Africa |
WHAT IS IN IT FOR YOU: CIP Chemicals Market REPORT CONTENT GUIDE
DELIVERED CUSTOMIZATIONS
We have successfully delivered the following deep-dive customizations:
| CLIENT REQUEST | CUSTOMIZATION DELIVERED | VALUE ADDS |
|---|---|---|
| U.S.-based Food & Beverage Processor |
|
|
| Industrial CIP System Integrator |
|
|
| Pharmaceutical & Biotech Manufacturer |
|
|
| European CIP Chemical Supplier |
|
|
| Food & Beverage OEMs |
|
|
RECENT DEVELOPMENTS
- October 2020 : BASF expanded its Lavergy product line by introducing new, sustainable solutions designed to enhance laundry performance while meeting stringent environmental standards. This expansion includes the incorporation of bio-based ingredients and innovative formulations designed to improve cleaning efficacy and sustainability in laundry applications.
- December 2023 : Solvay completed the partial spin-off of its Specialty Businesses into a new standalone company called Syensqo. The completion of this spin-off was effective on December 9, 2023, and Solvay and Syensqo started trading as separate entities on Euronext Brussels and Paris.
Table of Contents
 Exclusive indicates content/data unique to MarketsandMarkets and not available with any competitors.
Methodology
The study involved four major activities in estimating the market size of the CIP chemicals market. Exhaustive secondary research was done to collect information on the market, the peer market, and the parent market. The next step was to validate these findings, assumptions, and sizing with industry experts across the value chain through primary research. Both top-down and bottom-up approaches were employed to estimate the complete market size. Thereafter, the market breakdown and data triangulation procedures were used to estimate the market size of the segments and subsegments.
Secondary Research
In the secondary research process, various secondary sources have been referred to for identifying and collecting information for this study. These secondary sources include annual reports, press releases, investor presentations of companies, corporate documents, white papers, certified publications, trade directories, certified publications, articles from recognized authors, associations, gold standard and silver standard websites, and databases.
Secondary research has been used to obtain key information about the value chain of the industry, monetary chain of the market, the total pool of key players, market classification and segmentation according to industry trends to the bottom-most level, and regional markets. It was also used to obtain information about the key developments from a market-oriented perspective.
Primary Research
The CIP chemicals market comprises several stakeholders in the value chain, which include raw material suppliers, manufacturers, distributors and end user. Various primary sources from the supply and demand sides of the CIP chemicals market have been interviewed to obtain qualitative and quantitative information. The primary interviewees from the demand side include key opinion leaders in end-use sectors. The primary sources from the supply side include manufacturers, associations, and institutions involved in the CIP chemicals industry.
Primary interviews were conducted to gather insights such as market statistics, data of revenue collected from the products and services, market breakdowns, market size estimations, market forecasting, and data triangulation. Primary research also helped in understanding the various trends related to chemistry, process type, end use industry and region. Stakeholders from the demand side, such as CIOs, CTOs, and CSOs were interviewed to understand the buyer’s perspective on the suppliers, products, component providers, and their current usage of CIP chemicals and future outlook of their business which will affect the overall market.
The breakdown of profiles of the primary interviewees is illustrated in the figure below:

Note: Tier 1, Tier 2, and Tier 3 companies are classified based on their market revenue in 2023 available in the public domain, product portfolios, and geographical presence.
Other designations include sales representatives, production heads, and technicians.
To know about the assumptions considered for the study, download the pdf brochure
Market Size Estimation
The top-down approach was used to estimate and validate the size of various submarkets for CIP chemicals for each region. The research methodology used to estimate the market size included the following steps:
- The key players in the industry have been identified through extensive secondary research.
- The supply chain of the industry has been determined through primary and secondary research.
- The global market was then segmented into five major regions and validated by industry experts.
- All percentage shares, splits, and breakdowns based on chemistry, process type, end use industry and region were determined using secondary sources and verified through primary sources.
- All possible parameters that affect the markets covered in this research study were accounted for, viewed in extensive detail, verified through primary research, and analyzed to get the final quantitative and qualitative data. This data was consolidated and added with detailed inputs and analysis and presented in this report.
The market size include the following:

Source: Secondary Research, Interviews with Experts, and MarketsandMarkets Analysis
Data Triangulation
CIP chemicals are cleaning agents developed specifically for use in automated systems, such as the CIP system, which cleans the inner surfaces of equipment like processing machinery, pipes, and tanks without having to be dismantled. CIP chemicals consist of a somewhat wide variety of chemicals with specific uses-there are alkaline cleaners, such as caustic soda to remove fats and proteins, acidic cleaners, including phosphoric acid for mineral deposits, detergents to enhance the removal of residues, and sanitizers, like quaternary ammonium compounds, for the destruction of microbes. Such chemicals are important in hygiene, preventing contamination-thus the need for them in such lines of practice as in food and beverages, pharmaceuticals, and cosmetics.
Market Definition
Transfection is the process of deliberately introducing naked or purified nucleic acids (including DNA, RNA, or proteins) into eukaryotic cells. Transfection is a powerful tool that helps in the study of gene functions and can be achieved using biochemical, physical, and viral vector methods. Transfection technologies have been used in life science research and have been exploited for therapeutic delivery like gene therapy. This gene transfer technology enables the study of gene function and protein expression in a cellular environment.
The scope of the report includes FDA-approved transfection technologies products that are used for the transfection of nucleic acids into eukaryotic cells with the help of innovative method where the transfection technologies are intended to deliver DNA, RNA, or proteins for biomedical research, therapeutic delivery, and protein production.
Stakeholders
- CIP Chemical Manufacturers
- Raw Material Suppliers
- Government and Private Research Organizations
- Associations and Industrial Bodies
- R&D Institutions
- Environmental Support Agencies
- Industry Associations
- Manufacturers in End-Use Industries
Report Objectives
- To define, describe, and forecast the size of the CIP chemicals market, in terms of value and volume.
- To provide detailed information regarding the major factors (drivers, opportunities, restraints, and challenges) influencing the growth of the market.
- To estimate and forecast the market size based on chemistry, process type, end use industry, and region.
- To forecast the size of the market with respect to major regions, namely, Europe, North America, Asia Pacific, Middle East & Africa, and South America, along with their key countries.
- To strategically analyze micromarkets with respect to individual growth trends, prospects, and their contribution to the overall market.
- To analyze opportunities in the market for stakeholders and provide a competitive landscape of market leaders.
- To track and analyze recent developments such as expansions, new product launches, partnerships & agreements, mergers and acquisitions in the market.
- To strategically profile key market players and comprehensively analyze their core competencies.
Key Questions Addressed by the Report
Need a Tailored Report?
Customize this report to your needs
Get 10% FREE Customization
Customize This ReportPersonalize This Research
- Triangulate with your Own Data
- Get Data as per your Format and Definition
- Gain a Deeper Dive on a Specific Application, Geography, Customer or Competitor
- Any level of Personalization
Let Us Help You
- What are the Known and Unknown Adjacencies Impacting the CIP Chemicals Market
- What will your New Revenue Sources be?
- Who will be your Top Customer; what will make them switch?
- Defend your Market Share or Win Competitors
- Get a Scorecard for Target Partners

Custom Market Research Services
We Will Customise The Research For You, In Case The Report Listed Above Does Not Meet With Your Requirements
Get 10% Free CustomisationTESTIMONIALS

We at Nissan Chemicals Corporation have been clients of MarketsandMarkets for more than a year now. We recently consulted MarketsandMarkets for a study, the team at MarketsandMarkets was extremely professional and organized. The business insights were very detailed and aligned well with our expectations that really helped us formulate the Business Plans and device new strategies for development themes. MarketsandMarkets offers a unique combination of expertise and dedicated engagement model. Their research findings have helped us in designing our Pricing Strategy which will make it easier for us to predict the future sales and profits for the next ten years. We look forward to working with MarketsandMarkets in the future.
VP of Strategy & New Business Development
Leading Specialty Chemical Company
The MarketsandMarkets Engagement Model, composed of both the Knowledge Store and advisory custom research, has greatly helped us in understanding our markets and making strategic decisions. The Knowledge Store is a fast way to allow everyone in our organization to understand more about most any market they are interested in. The ability to then get custom research done and get answers to specific strategic questions and market insight has been spectacular. The Markets and Markets team feel more like colleagues than vendors and their services have helped us change our culture where statements of things like growth opportunities and competitive position are always backed by industry research.

Rich Gibson,
Director, Corporate Strategy
Milliken & Company,
Leading Industrial Manufacturer of specialty chemical, floor covering, performance and protective textile materials, and healthcaremilliken.com
MarketsandMarkets is a trusted resource that helps us to better understand markets that are near-adjacencies-whether its technology, value chain or geography. Their Knowledge Store platform provides a dashboard of markets and their characteristics which is easy to use and saves us time.
Adam Shaw,
Market Development and Strategy Manager
AdvanSix Inc. USA,
An American Leader in Chemicalswww.advansix.com
The Knowledge Store from MarketsandMarkets is a valuable tool which has helped my team acquire greater insight in to the end markets that our business serves. This has enabled us to help our company build stronger strategies throughout our planning process.
TOSHIO KINOSHITA
Senior Chif Consultion Research & Consulting Division
Mitsubishi Chemical Research Corporation,
Leading Manufacturer of Chemical Productswww.mitsubishichem-res.co.jp/en/

We recently engaged with MarketsandMarkets for a study, the team not only clearly understood our business objectives but was also extremely professional in the way they handled the entire project. The study was efficiently conducted in a phase-wise manner, and the engagement model furnished us with high-quality business insights that far exceeded our expectations at each phase. We were especially happy that MarketsandMarkets could provide us with both, an English as well as a Japanese version of the study. A special thanks to the Analyst Team and Client Services Team, whose fluency in Japanese enhanced our comfort level, as we could converse with them in our preferred language.
Independent entrepreneurs
Arrow Precision
We approached MarketsandMarkets for study on Proppants Market, and their work exceeded our expectations. The study conducted was comprehensive and enabled us to view the market through the various dimensions. In addition, the team was extraordinarily responsive throughout the process and resolved our queries on time. I strongly recommend MarketsandMarkets and will certainly consider them for additional market assessments we will need in the future.
Global engineering company, Japan
Deputy Manager,
Strategic Planning OfficeThe high-quality insights shared by the MarketsandMarkets team helped us understand the pharmaceutical plant designers in a specific geography. It also captured the risks that we may likely face in communicating with our potential partners. The study would enable us identify partners, which would impact our future growth.


Growth opportunities and latent adjacency in CIP Chemicals Market