Cleanroom Lighting Market

Cleanroom Lighting Market by Light Source (LED, Fluorescent), Mounting Type (Recessed and Surface Mounted), End User (Healthcare & Life Science, Industrial Manufacturing, Food & Beverages), Offering and Region - Global Forecast to 2029

Report Code: SE 7115 Jan, 2024, by marketsandmarkets.com

The Cleanroom Lighting Market is projected to reach USD 1.1 billion by 2029 from USD 0.9 billion in 2024; it is expected to grow at a CAGR of 5.4% from 2024 to 2029.

The Cleanroom Lighting market is being propelled by several key factors, including increased demand for energy-efficient and sterile environments for pharmaceutical manufacturing, semiconductor manufacturing, food and beverage production and packaging as well as healthcare, which drives the growth for cleanroom lighting in these facilities.

Cleanroom Lighting Market

Cleanroom Lighting Market

Cleanroom Lighting Market Forecast to 2029

To know about the assumptions considered for the study, Request for Free Sample Report

Market Dynamics:

Driver: Advancements in cleanroom lighting technology

Technological advancements in the cleanroom lighting industry are driving innovation, efficiency, and performance improvements. These advancements contribute to creating lighting solutions that meet the strict requirements of cleanroom environments. Some key technological trends in the cleanroom lighting industry are discussed here.
Light Light-emitting diode (LED) technology has become a cornerstone in cleanroom lighting. LEDs offer several advantages, including energy efficiency, longer lifespan, and reduced heat emission. The ability to provide precise and uniform illumination without generating excess heat makes LED lighting a preferred choice for cleanroom applications. For instance, Wipro Lighting, a part of Wipro conglomerate, offers clean room lighting solutions that use high-efficacy LEDs that save energy up to 55% and reduce the operational costs significantly. These solutions are Vision LED Prime TOCR, Vision LED, and Vision +. Thus, understanding the importance of incorporating LEDs in cleanroom lighting, companies are efficiently using them for better illumination results.

Integration of smart lighting systems in cleanroom environments allows for advanced control and monitoring. Smart lighting solutions may include sensors for occupancy detection, daylight harvesting, and adaptive lighting that adjusts based on the specific needs of the space. These systems enhance energy efficiency and contribute to creating a more intelligent and responsive lighting environment. Cleanroom lighting systems are now equipped with occupancy sensors that detect movements within cleanrooms. These sensors guarantee that lights are activated solely when necessary, conserving energy during periods of room inactivity. Through the incorporation of daylight sensors into the lighting system, cleanrooms can harness natural light, automatically adapting the illumination levels to sustain optimal brightness and minimize energy consumption. Intelligent lighting systems offer up-to-the-minute data on energy consumption, empowering manufacturers to make informed decisions regarding sustainable energy management and identify potential areas for enhancement.

Another important technology is the use of tunable white light technology. Tunable white light technology enables the adjustment of color temperature to mimic natural daylight. This capability is valuable in cleanrooms where visual acuity and color accuracy are crucial. Tunable white light supports various tasks within cleanroom facilities and contributes to the well-being and productivity of personnel. For instance, Havells India Ltd offers Havells 42W clean room dimmable TOCR tunable white LED luminaire that provides improved productivity, better moods, and overall happier workplaces. Also, some cleanroom lighting fixtures are equipped with advanced filtration systems to ensure that the air within the cleanroom remains free from contaminants. These systems may include HEPA (High-Efficiency Particulate Air) filters to capture and filter out particles, contributing to the overall cleanliness of the space. For instance, Bukas Lighting Group offers A1 (AeroLux) which is a cleanroom luminaire and is a surface mount, cable, pendant, HEPA filter grid ceiling. Such products offer color accuracy and visual acuity in the cleanroom environment.

In response to the need for enhanced disinfection measures, some cleanroom lighting solutions incorporate UV-C (Ultraviolet-C) light technology. UV-C light is effective in killing or inactivating microorganisms, contributing to the maintenance of a sterile cleanroom environment. For instance, Isoone cleanroom lighting offers recessed top access luminaire - Li3, for UV-C radiation for surface and air disinfection. Thus, these technological advancements collectively contribute to the evolution of cleanroom lighting, enhancing performance, efficiency, and adaptability to meet the requirements of cleanroom applications across various industries.

Restraint: Sustainability concerns in the cleanroom lighting industry

While the cleanroom lighting industry aims to create clean and controlled environments, some practices and technologies raise concerns about their environmental impact. Traditional cleanroom lighting often relies on fluorescent fixtures, which, while efficient compared to incandescent bulbs, still consume significant energy. The need for maintaining specific temperature and humidity levels in cleanrooms adds to the overall energy demands of the facility. Also, High-intensity UV-C LED disinfection systems, while effective, can also be energy-intensive, especially if not optimized.

The manufacturing and disposal of lighting fixtures can have environmental implications. Sustainable practices in the cleanroom lighting industry involve using materials with low environmental impact, optimizing resource efficiency in production processes, and exploring options for recyclability or responsible disposal at the end of the fixture's life cycle. Carbon emissions associated with the production, transportation, and installation of cleanroom lighting systems contribute to environmental impact. Minimizing carbon emissions involves choosing materials and manufacturing processes with lower carbon footprints, as well as optimizing supply chain logistics to reduce transportation-related emissions. Also, the use of certain chemicals in the manufacturing and cleaning of cleanroom lighting fixtures can have environmental consequences. Sustainable practices involve minimizing the use of harmful substances, adhering to green chemistry principles, and exploring alternative materials and cleaning methods that are environmentally friendly. Light pollution, which includes excessive, misdirected, or obtrusive artificial light, is a growing concern. Sustainable cleanroom lighting practices involve designing fixtures and implementing lighting controls to minimize light pollution, preserving natural night environments, and promoting responsible outdoor lighting. Thus, owing to these couple of concerns, cleanroom lighting industry growth may get hampered.

Opportunity: Increasing adoption of sensors and automation in cleanroom lighting

The integration of sensors and automation in cleanroom lighting represents a growing trend that brings notable benefits to the operational dynamics of cleanroom environments. Sensors play a pivotal role in monitoring various environmental parameters within the cleanroom, such as temperature, humidity, particle levels, and light intensity. By continuously collecting real-time data, these sensors enable the automation system to adjust lighting conditions precisely in response to the specific needs of the environment. This dynamic control ensures that energy is utilized optimally, contributing to overall operational efficiency. Also, automation in cleanroom lighting allows for adaptive illumination based on the current conditions. For instance, sensors detect variations in natural light levels and adjust artificial lighting accordingly. This not only ensures consistent brightness within the cleanroom but also minimizes energy consumption by utilizing natural light whenever possible. The use of sensors enables real-time monitoring of cleanroom parameters. Automation systems can respond instantly to deviations from set standards, automatically adjusting to maintain the required environmental conditions. This proactive approach helps in preventing issues before they escalate, ensuring that the cleanroom operates within specified parameters. Another important aspect is that the sensors can detect potential sources of contamination, and automation systems can implement measures to mitigate risks. For example, automated control of personnel access, air filtration systems, and equipment usage can be implemented based on real-time data, minimizing the likelihood of particle generation, and ensuring a controlled environment. Thus, the incorporation of sensors and automation in cleanroom lighting not only ensures strict adherence to cleanliness standards but also enhances operational efficiency, reduces energy consumption, and enables a more adaptive and responsive cleanroom environment. This integration is becoming increasingly essential in industries where precision, cleanliness, and flexibility are paramount.

Challenge: Maintenance and cleaning challenges

Ensuring compliance with cleanliness standards in cleanroom environments necessitates regular maintenance of lighting fixtures. However, this process comes with several challenges, including cleaning procedures and the potential for disruptions to cleanroom operations.

Cleanroom lighting fixtures require meticulous cleaning procedures to eliminate any potential sources of contamination. The strict cleanliness standards demand thorough cleaning, often involving specialized cleaning agents and protocols to maintain the sterile environment. While cleaning fixtures, there is a risk of introducing contaminants into the cleanroom environment. Even with the utmost care, maintenance activities can potentially disrupt the controlled atmosphere, making it challenging to balance the need for cleanliness with the necessity of maintenance. Also, maintenance on cleanroom lighting fixtures may necessitate downtime for specific areas or the entire cleanroom. This operational disruption can impact productivity and workflow, especially in industries where continuous production is crucial.

Cleanroom environments often have restricted access controls to prevent contamination. This limitation poses challenges during maintenance activities, as personnel need to comply with stringent protocols and gowning procedures, potentially extending the duration of maintenance tasks. Proper maintenance of cleanroom lighting fixtures may require specialized equipment and training for personnel. The need for skilled technicians familiar with cleanroom protocols adds complexity to the maintenance process.

Cleanroom Lighting Market Ecosystem

The prominent market players in the Cleanroom Lighting market include Signify Holding (Netherlands), Wipro Lighting (India), Crompton Greaves Consumer Electricals Limited (India), Acuity Brands, Inc. (US), Kenall Manufacturing (US), Terra Universal Inc. (US), Bukas Lighting Group (US), Solite Europe (England), LUG Light Factory Sp. z o.o. (Poland), Eagle Lighting Australia Pty Ltd (Australia).

Cleanroom Lighting Market by Ecosystem

In the mounting type segment, the recessed mounted is expected to hold the largest market share during the forecast period.

Recessed mounted cleanroom lighting stands out as a preferred choice in the cleanroom lighting market due to its strategic advantages that align with the evolving needs of controlled environments. The recessed mounting design, wherein lighting fixtures are installed flush with the ceiling surface, offers a streamlined and unobtrusive appearance, minimizing exposed surfaces that could potentially harbor contaminants. This design not only adheres to stringent cleanliness standards but also optimizes space within cleanrooms, facilitating efficient floor and wall utilization.

In offering segment, hardware is expected to hold the largest market share during the forecast period.

The hardware segment’s market share is the highest which is driven by several strategic factors that resonate with the evolving demands of controlled environments. Hardware solutions play a pivotal role in cleanroom lighting, encompassing fixtures, mounts, enclosures, and other essential components designed to meet stringent cleanliness standards. The robust growth of industries such as pharmaceuticals, biotechnology, and semiconductor manufacturing, where precision and sterility are imperative, is propelling the demand for advanced hardware solutions. Innovations in contamination-resistant materials, advanced mounting systems, and smart controls have significantly contributed to the appeal of hardware offerings.

In light source segment, LED is expected to hold the largest market share during the forecast period.

The imperative for energy conservation and sustainability in industries such as pharmaceuticals, biotechnology, and semiconductor manufacturing is propelling the demand for LED cleanroom lighting solutions. Beyond efficiency, LED fixtures offer precise control over light distribution, ensuring consistent and uniform illumination critical for maintaining controlled environments. As technological advancements continue to enhance LED performance, including improved durability and design flexibility, the market witnesses a surge in demand. The global trend towards eco-friendly practices further supports the adoption of LED light sources, as they align with sustainability objectives. With their versatility, energy efficiency, and continuous technological innovation, LED light sources are positioned to drive sustained growth in the cleanroom lighting market across diverse industries.

In the end-user segment, healthcare & life sciences are expected to hold the largest market share during the forecast period.

The healthcare & life sciences segment has the largest market share, which is driven by several factors that align with the sector's stringent requirements. The critical nature of pharmaceutical and healthcare operations demands precision, sterility, and compliance with rigorous regulatory standards, making controlled environments a necessity. Cleanroom lighting solutions play a pivotal role in these environments by ensuring optimal illumination while adhering to cleanliness protocols. As the pharmaceutical and healthcare sectors expand globally, the need for state-of-the-art cleanroom facilities intensifies, contributing significantly to the growing demand for specialized lighting solutions. Furthermore, the increasing focus on research and development activities in biotechnology and pharmaceuticals underscores the importance of advanced cleanroom technologies. The integration of energy-efficient LED technology, smart lighting controls, and contamination-resistant materials within cleanroom lighting aligns with the industry's commitment to innovation, efficiency, and patient safety. Consequently, the pharmaceutical and healthcare sector's robust growth is expected to be a key driver propelling the cleanroom lighting market forward in the coming years.

Asia Pacific region is expected to witness the highest growth rate during the forecast period (2024-2029).

The Asia Pacific region harbors significant growth potential within the cleanroom lighting market. This anticipated expansion is fueled by a confluence of factors that underscore the region's dynamic industrial landscape. As countries within Asia-Pacific, including China, India, and Japan, undergo rapid economic development and industrialization, and there is a notable surge in the demand for controlled environments, particularly in sectors such as electronics, pharmaceuticals, and biotechnology. Governments in the region are increasingly emphasizing regulatory standards related to cleanliness, safety, and sustainability, providing a conducive environment for the adoption of cleanroom technologies, including specialized lighting solutions. Additionally, the Asia-Pacific region's pivotal role in global supply chains, coupled with its technological advancements, positions it as a hub for manufacturing and production activities that necessitate cleanroom facilities.

Cleanroom Lighting Market
 by Region

Cleanroom Lighting Market by Region

To know about the assumptions considered for the study, download the pdf brochure

Key Market Players

Signify Holding (Netherlands), Wipro Lighting (India), Crompton Greaves Consumer Electricals Limited (India), Acuity Brands, Inc. (US), Kenall Manufacturing (US), Terra Universal Inc. (US), Bukas Lighting Group (US), Solite Europe (England), LUG Light Factory Sp. z o.o. (Poland), Eagle Lighting Australia Pty Ltd (Australia) is one of the key players in the global cleanroom lighting companies. These players increasingly undertake product launches and development strategies, expansions, partnerships, contracts, and acquisitions to increase their market share.

Report Scope

The report covers the demand- and supply-side segmentation of the cleanroom lighting  market.

Get online access to the report on the World's First Market Intelligence Cloud

  • Easy to Download Historical Data & Forecast Numbers
  • Company Analysis Dashboard for high growth potential opportunities
  • Research Analyst Access for customization & queries
  • Competitor Analysis with Interactive dashboard
  • Latest News, Updates & Trend analysis
Request Sample

Scope of the Report

Report Metric

Details

Market Size Available for Years

2020–2029

Base Year Considered

2023

Forecast Period

2024–2029

Forecast Units

Value (USD Million)

Segments Covered

Light Source, Application, Offering, Mounting Type, End User

Geographies Covered

Asia Pacific, North America, Europe, Rest of the World (Middle East, Africa, and South America)

Key Companies Covered

Signify Holding (Netherlands), Wipro Lighting (India), Crompton Greaves Consumer Electricals Limited (India), Acuity Brands, Inc. (US), Kenall Manufacturing (US), Terra Universal Inc. (US), Bukas Lighting Group (US), Solite Europe (England), LUG Light Factory Sp. z o.o. (Poland), Eagle Lighting Australia Pty Ltd (Australia).

Cleanroom Lighting Market Highlights

In this report, the cleanroom lighting market has been segmented into the following categories:

Aspect

Details

By Light Source:

  • LED
  • Fluorescent

By Mounting Type:

  • Recessed Mounted
  • Surface Mounted

By Offering:

  • Hardware
  • Software
  • Services

By End User:

  • Healthcare & Life Sciences
  • Industrial Manufacturing
  • Food & Beverages
  • Other (Aerospace, Scientific Research Institutions)

By Region:

  • North America
  • Europe
  • Asia Pacific
  • Rest of the World

Recent Developments

  • In July 2023, Kenall Manufacturing launched its new Mighty Mac HXSS. Complementing the Mighty Mac SSAS, CCS, and WCBHS, the HXSS is a member of a distinctive family of luminaires without doors, meticulously crafted to thwart inmate attempts to access the lighting. This design serves as a deterrent against the weaponization of components, fostering a secure environment for both staff and inmates.
  • In April 2022, to overcome this obstacle, Kenall Manufacturing has launched SimpleSeal CleanSlot CRS4 Series — the inaugural recessed slot luminaire series in the industry to achieve ISO 3-9 and NSF2 ratings, in order to overcome the challenge for placing luminaires concealed within cleanroom ceilings with a complex network of ductwork, conduit, and equipment.
  • In January 2022, Terra Universal. Inc. partnered with Sidus Space; a Space-as-a-Service satellite company partnered with for satellite cleanrooms. The cleanroom is expected to include new LED light fixtures throughout the facility, Fiber optic internet, and an industrial-grade epoxy shop floor.
  • In October 2020, Acuity Brands, Inc. entered into strategic agreements with Violet Defense LLC (Violet Defense), an innovator of patented germicidal UV lighting technology, and PURO Lighting. These strategic agreements will give Acuity Brands access to Violet Defense’s patented UV technology to expand its portfolio of UV disinfection products. PURO and Acuity Brands will also work together to develop the next generation of UV lighting products.
  • In June 2020, Kenall Manufacturing launched SimpleSeal CSERO and CSERI, to its line of sealed, high-performance cleanroom luminaires. These fixtures safeguard the integrity of cleanrooms across various specifications and deliver bright and evenly diffused light, enhancing worker comfort and productivity. Additionally, the luminaires are specifically designed to significantly lower the total cost of ownership, offering energy efficiency and industry-leading efficacy, reaching levels as high as 172 lumens per watt.

Frequently Asked Questions (FAQs):

To speak to our analyst for a discussion on the above findings, click Speak to Analyst

TABLE OF CONTENTS
 
1 INTRODUCTION (Page No. - 28)
    1.1 STUDY OBJECTIVES 
    1.2 DEFINITION 
           1.2.1 INCLUSIONS AND EXCLUSIONS:
    1.3 STUDY SCOPE 
           1.3.1 MARKETS COVERED
                    FIGURE 1 CLEANROOM LIGHTING MARKET SEGMENTATION
           1.3.2 REGIONAL SCOPE
    1.4 YEARS CONSIDERED 
    1.5 CURRENCY CONSIDERED 
    1.6 UNITS CONSIDERED 
    1.7 LIMITATIONS 
    1.8 STAKEHOLDERS 
    1.9 SUMMARY OF CHANGES 
    1.1 IMPACT OF RECESSION 
 
2 RESEARCH METHODOLOGY (Page No. - 34)
    2.1 RESEARCH DATA 
           FIGURE 2 CLEANROOM LIGHTING MARKET: RESEARCH DESIGN
           2.1.1 SECONDARY DATA
                    2.1.1.1 Key data from secondary sources
                    2.1.1.2 Key secondary sources
           2.1.2 PRIMARY DATA
                    2.1.2.1 Key data from primary sources
                    2.1.2.2 List of key interview participants
                    2.1.2.3 Breakdown of primaries
                    2.1.2.4 Key data from primary sources
                    2.1.2.5 Key industry insights
           2.1.3 SECONDARY AND PRIMARY RESEARCH
    2.2 MARKET SIZE ESTIMATION 
           FIGURE 3 CLEANROOM LIGHTING MARKET: PROCESS FLOW OF MARKET SIZE ESTIMATION
           2.2.1 BOTTOM-UP APPROACH
                    2.2.1.1 Approach for capturing market size by bottom-up analysis
                               FIGURE 4 MARKET SIZE ESTIMATION METHODOLOGY: BOTTOM-UP APPROACH
           2.2.2 TOP-DOWN APPROACH
                    2.2.2.1 Approach for capturing market size by top-down analysis
                               FIGURE 5 MARKET SIZE ESTIMATION METHODOLOGY: TOP-DOWN APPROACH
                               FIGURE 6 MARKET SIZE ESTIMATION METHODOLOGY: APPROACH 1 (SUPPLY SIDE): REVENUE GENERATED BY KEY MARKET PLAYERS IN CLEANROOM LIGHTING MARKET
                               FIGURE 7 MARKET SIZE ESTIMATION METHODOLOGY: APPROACH 2 (SUPPLY SIDE): ILLUSTRATION OF REVENUE ESTIMATION OF KEY PLAYERS IN CLEANROOM LIGHTING MARKET
    2.3 MARKET SHARE ESTIMATION 
    2.4 MARKET BREAKDOWN AND DATA TRIANGULATION 
           FIGURE 8 DATA TRIANGULATION
    2.5 RESEARCH ASSUMPTIONS AND LIMITATIONS 
           2.5.1 RESEARCH ASSUMPTIONS
           2.5.2 RESEARCH LIMITATIONS
    2.6 RISK ASSESSMENT 
           TABLE 1 RISK FACTOR ANALYSIS
 
3 EXECUTIVE SUMMARY (Page No. - 48)
    FIGURE 9 HARDWARE SEGMENT IS EXPECTED TO HOLD A LARGER MARKET SHARE DURING THE FORECAST PERIOD
    FIGURE 10 LED SEGMENT TO GROW AT THE HIGHEST CAGR DURING 2024–2029
    FIGURE 11 RECESSED MOUNTED SEGMENT IS EXPECTED TO HOLD A LARGER MARKET SHARE DURING THE FORECAST PERIOD
    FIGURE 12 HEALTHCARE AND LIFE SCIENCES TO HOLD THE LARGEST MARKET SHARE DURING FORECAST PERIOD
    FIGURE 13 ASIA PACIFIC REGION HELD THE LARGEST MARKET SHARE IN 2023
 
4 PREMIUM INSIGHT (Page No. - 52)
    4.1 ATTRACTIVE GROWTH OPPORTUNITIES IN CLEANROOM LIGHTING MARKET 
           FIGURE 14 INCREASING DEMAND FOR ENERGY-EFFICIENT CLEANROOMS DRIVES MARKET GROWTH
    4.2 CLEANROOM LIGHTING MARKET, BY OFFERING 
           FIGURE 15 HARDWARE SEGMENT IS EXPECTED TO HOLD THE LARGEST SHARE IN THE MARKET DURING THE FORECAST PERIOD
    4.3 CLEANROOM LIGHTING MARKET, BY LIGHT SOURCE 
           FIGURE 16 LED TO HOLD LARGEST MARKET SHARE IN CLEANROOM LIGHTING MARKET DURING FORECAST PERIOD
    4.4 CLEANROOM LIGHTING MARKET, BY MOUNTING TYPE 
           FIGURE 17 RECESSED MOUNTED SEGMENT TO HOLD LARGEST MARKET SHARE DURING FORECAST PERIOD
    4.5 CLEANROOM LIGHTING MARKET, BY END USER 
           FIGURE 18 FOOD & BEVERAGES SEGMENT IS EXPECTED TO GROW AT THE HIGHEST CAGR DURING THE FORECAST PERIOD
    4.6 CLEANROOM LIGHTING MARKET IN ASIA PACIFIC, BY END USER AND BY COUNTRY 
           FIGURE 19 HEALTHCARE AND LIFE SCIENCES HELD THE LARGEST SHARE IN ASIA PACIFIC IN 2023
    4.7 CLEANROOM LIGHTING MARKET BY COUNTRY (2023) 
           FIGURE 20 CHINA TO GROW AT HIGHEST CAGR SHARE DURING FORECAST PERIOD
 
5 MARKET OVERVIEW (Page No. - 56)
    5.1 INTRODUCTION 
    5.2 MARKET DYNAMICS 
           FIGURE 21 CLEANROOM LIGHTING MARKET: DRIVERS, RESTRAINTS, OPPORTUNITIES, AND CHALLENGES
           5.2.1 DRIVERS
                    5.2.1.1 Need for a controlled environment with minimal levels of pollutants in manufacturing industries.
                    5.2.1.2 Stringent regulations to avoid contamination in healthcare and food production industries
                    5.2.1.3 Rising demand for sterile manufacturing areas in the pharmaceutical industry
                    5.2.1.4 Rising demand for contamination-free advanced medical devices
                    5.2.1.5 Worldwide government support towards building cleanrooms for industries such as semiconductors fabrication and pharmaceuticals
                    5.2.1.6 Advancements in cleanroom lighting technology
                               FIGURE 22 CLEANROOM LIGHTING MARKET DRIVERS: IMPACT ANALYSIS
           5.2.2 RESTRAINTS
                    5.2.2.1 High cost associated with cleanrooms.
                    5.2.2.2 Sustainability concerns in the cleanroom lighting industry
                               FIGURE 23 CLEANROOM LIGHTING MARKET RESTRAINTS: IMPACT ANALYSIS
           5.2.3 OPPORTUNITIES
                    5.2.3.1 Rapid growth in the healthcare sector in the Middle East
                    5.2.3.2 Increasing demand for energy-efficient cleanrooms
                    5.2.3.3 Increasing adoption of sensors and automation in cleanroom lighting
                               FIGURE 24 CLEANROOM LIGHTING MARKET OPPORTUNITIES: IMPACT ANALYSIS
           5.2.4 CHALLENGES
                    5.2.4.1 Customized designs of cleanrooms
                    5.2.4.2 Need for technical know-how.
                    5.2.4.3 Maintenance and cleaning challenges
                               FIGURE 25 CLEANROOM LIGHTING MARKET CHALLENGES: IMPACT ANALYSIS
    5.3 VALUE CHAIN ANALYSIS 
           FIGURE 26 CLEANROOM LIGHTING MARKET: VALUE CHAIN ANALYSIS
    5.4 REVENUE SHIFT AND NEW REVENUE POCKETS FOR CLEANROOM LIGHTING MARKET PLAYERS 
           FIGURE 27 REVENUE SHIFT IN THE CLEANROOM LIGHTING MARKET
    5.5 MARKET MAP/MARKET ECOSYSTEM 
           TABLE 2 CLEANROOM LIGHTING MARKET: ECOSYSTEM
           FIGURE 28 MARKET ECOSYSTEM: KEY PLAYERS IN THE CLEANROOM LIGHTING MARKET
    5.6 PRICING ANALYSIS 
           5.6.1 COST ANALYSIS
                    FIGURE 29 HISTORICAL ASP TRENDS FOR CLEANROOM LIGHTING, 2020–2023
           5.6.2 AVERAGE SELLING PRICE BY APPLICATION (KEY PLAYERS)
                    FIGURE 30 AVERAGE SELLING PRICES OF KEY PLAYERS FOR APPLICATIONS
           5.6.3 AVERAGE SELLING PRICE TREND, BY REGION
                    FIGURE 31 AVERAGE SELLING PRICE TREND, BY REGION
    5.7 CASE STUDY ANALYSIS 
           5.7.1 CLEANROOM LIGHTING IN MEDICAL RESEARCH
                    TABLE 3 USE OF CLEANROOM LIGHTING IN THE HEALTH LAB AT MARS DISCOVERY DISTRICT
           5.7.2 CLEANROOM LIGHTING IN HEALTHCARE
                    TABLE 4 USE OF CLEANROOM LIGHTING IN MIOVENI HOSPITAL
           5.7.3 CLEANROOM LIGHTING IN PHARMACEUTICAL FACILITY
                    TABLE 5 USE OF CLEANROOM LIGHTING IN RINGASKIDDY, CO. CORK-BASED PHARMA FACILITY
    5.8 PATENT ANALYSIS 
           5.8.1 TOP PATENT OWNERS
                    FIGURE 32 TOP 10 COMPANIES WITH THE HIGHEST NUMBER OF PATENT APPLICATIONS IN THE LAST 10 YEARS
           5.8.2 PATENT TREND
                    FIGURE 33 NO. OF PATENTS GRANTED PER YEAR FROM 2013 TO 2022
                    TABLE 6 NUMBER OF PATENTS REGISTERED BY OWNERS RELATED TO THE CLEANROOM LIGHTING MARKET IN THE LAST 10 YEARS
                    TABLE 7 LIST OF KEY PATENTS IN CLEANROOM LIGHTING MARKET, 2020–2023
    5.9 TRADE ANALYSIS 
           TABLE 8 IMPORT SCENARIO FOR HS CODE: 9405-COMPLIANT PRODUCTS, BY COUNTRY, 2018–2022 (USD MILLION)
           FIGURE 34 COUNTRY-WISE IMPORT DATA FOR PRODUCTS CLASSIFIED UNDER HS CODE: 9405, 2018–2022
           TABLE 9 EXPORT SCENARIO FOR HS CODE: 9405-COMPLIANT PRODUCTS, BY COUNTRY, 2018–2022 (USD MILLION)
           FIGURE 35 COUNTRY-WISE EXPORT DATA FOR PRODUCTS CLASSIFIED UNDER HS CODE: 9405, 2018–2022
    5.10 PORTER'S FIVE FORCES ANALYSIS 
           TABLE 10 PORTER'S FIVE FORCES ANALYSIS WITH THEIR IMPACT
           FIGURE 36 CLEANROOM LIGHTING MARKET: PORTER'S FIVE FORCES ANALYSIS
           5.10.1 THREAT OF NEW ENTRANTS
           5.10.2 THREAT OF SUBSTITUTES
           5.10.3 BARGAINING POWER OF SUPPLIERS
           5.10.4 BARGAINING POWER OF BUYERS
           5.10.5 INTENSITY OF COMPETITIVE RIVALRY
    5.11 TECHNOLOGY ANALYSIS 
           5.11.1 INTEGRATED LIGHTING SYSTEMS IN CLEANROOM LIGHTING
           5.11.2 HUMAN-CENTRIC LIGHTING
           5.11.3 FLEXIBLE OLED LIGHTING IN CLEANROOM LIGHTING
           5.11.4 IOT INTEGRATION OF CLEANROOM LIGHTING
    5.12 KEY CONFERENCES AND EVENTS (2024-2025) 
    5.13 REGULATORY LANDSCAPE 
           TABLE 11 CLEANROOM LIGHTING MARKET: REGULATORY LANDSCAPE
           5.13.1 REGION-WISE REGULATORY ANALYSIS
                    5.13.1.1 North America
                               5.13.1.1.1 US
                               5.13.1.1.2 Canada
                    5.13.1.2 Europe
                    5.13.1.3 Asia Pacific
                               5.13.1.3.1 China
                               5.13.1.3.2 India
                    5.13.1.4 Rest of the World (RoW)
    5.14 KEY STAKEHOLDERS & BUYING CRITERIA 
           5.14.1 KEY STAKEHOLDERS IN BUYING PROCESS
                    FIGURE 37 INFLUENCE OF STAKEHOLDERS IN BUYING PROCESS FOR THREE APPLICATIONS
                    TABLE 12 INFLUENCE OF STAKEHOLDERS IN BUYING PROCESS FOR THREE APPLICATIONS (%)
           5.14.2 BUYING CRITERIA
                    FIGURE 38 KEY BUYING CRITERIA FOR TOP 3 END USERS
                    TABLE 13 KEY BUYING CRITERIA FOR THREE APPLICATIONS
 
6 CLEANROOM LIGHTING MARKET, BY LIGHTING PURPOSE (Page No. - 92)
    6.1 INTRODUCTION 
           FIGURE 39 CLEANROOM LIGHTING MARKET, BY LIGHTING PURPOSE
    6.2 GENERAL PURPOSE & SPECIAL TASK LIGHTING 
           6.2.1 TECHNOLOGICAL ADVANCEMENTS AND INDUSTRY DEMAND PROPEL GROWTH IN GENERAL PURPOSE & SPECIAL TASK LIGHTING SOLUTIONS
    6.3 UV DISINFECTION LIGHTING 
           6.3.1 RISING EMPHASIS ON STERILIZATION AND INFECTION CONTROL IN HEALTHCARE DRIVES A SURGE IN DEMAND FOR UV DISINFECTION LIGHTING
 
7 CLEANROOM LIGHTING MARKET, BY OFFERING (Page No. - 95)
    7.1 INTRODUCTION 
           FIGURE 40 CLEANROOM LIGHTING MARKET, BY OFFERING
           TABLE 14 CLEANROOM LIGHTING MARKET, BY OFFERING, 2020–2023 (USD MILLION)
           FIGURE 41 HARDWARE SEGMENT IS EXPECTED TO HOLD THE LARGEST MARKET SHARE DURING THE FORECAST PERIOD
           TABLE 15 CLEANROOM LIGHTING MARKET, BY OFFERING, 2024–2029 (USD MILLION)
    7.2 HARDWARE 
           7.2.1 INCREASING ADOPTION OF CLEANROOM LIGHTING TO INCREASE DEMAND FOR HARDWARE SEGMENT
                    TABLE 16 HARDWARE: CLEANROOM LIGHTING MARKET, BY REGION, 2020–2023 (USD MILLION)
                    TABLE 17 HARDWARE: CLEANROOM LIGHTING MARKET, BY REGION, 2024–2029 (USD MILLION)
    7.3 SOFTWARE 
           7.3.1 INCREASING NEED FOR AUTOMATION AND PRECISION CONTROL IN LIGHTING SYSTEMS TO CREATE DEMAND AND GROWTH FOR SOFTWARE SEGMENT
                    TABLE 18 SOFTWARE: CLEANROOM LIGHTING MARKET, BY REGION, 2020–2023 (USD MILLION)
                    TABLE 19 SOFTWARE: CLEANROOM LIGHTING MARKET, BY REGION, 2024–2029 (USD MILLION)
    7.4 SERVICES 
           7.4.1 HIGHER COMPLEXITY ALONG WITH INCREASING CUSTOMIZED CLEANROOM LIGHTING SOLUTIONS TO BOOST THE DEMAND FOR SERVICES
                    TABLE 20 SERVICES: CLEANROOM LIGHTING MARKET, BY REGION, 2020–2023 (USD MILLION)
                    TABLE 21 SERVICES: CLEANROOM LIGHTING MARKET, BY REGION, 2024–2029 (USD MILLION)
 
8 CLEANROOM LIGHTING MARKET, BY LIGHT SOURCE (Page No. - 102)
    8.1 INTRODUCTION 
           FIGURE 42 CLEANROOM LIGHTING MARKET, BY LIGHT SOURCE
           TABLE 22 CLEANROOM LIGHTING MARKET, BY LIGHT SOURCE, 2020–2023 (USD MILLION)
           FIGURE 43 LED SEGMENT IS EXPECTED TO HOLD THE LARGEST MARKET SHARE DURING THE FORECAST PERIOD
           TABLE 23 CLEANROOM LIGHTING MARKET, BY LIGHT SOURCE, 2024–2029 (USD MILLION)
           TABLE 24 CLEANROOM LIGHTING MARKET, BY LIGHT SOURCE, 2020–2023 (MILLION UNITS)
           TABLE 25 CLEANROOM LIGHTING MARKET, BY LIGHT SOURCE, 2024–2029 (MILLION UNITS)
    8.2 LED 
           8.2.1 BETTER ILLUMINATION, LONGER LIFE SPAN, AND ENVIRONMENT-FRIENDLY PROPERTIES OF LED TO BOOST GROWTH OF THIS SEGMENT
                    TABLE 26 LED: CLEANROOM LIGHTING MARKET, BY REGION, 2020–2023 (USD MILLION)
                    TABLE 27 LED: CLEANROOM LIGHTING MARKET, BY REGION, 2024–2029 (USD MILLION)
    8.3 FLUORESCENT 
           8.3.1 AFFORDABILITY ALONG WITH BALANCED ILLUMINATION IN CRITICAL TASKS TO BOOST THE GROWTH OF THIS SEGMENT
                    TABLE 28 FLUORESCENT: CLEANROOM LIGHTING MARKET, BY REGION, 2020–2023 (USD MILLION)
                    TABLE 29 FLUORESCENT: CLEANROOM LIGHTING MARKET, BY REGION, 2024–2029 (USD MILLION)
 
9 CLEANROOM LIGHTING MARKET, BY MOUNTING TYPE (Page No. - 108)
    9.1 INTRODUCTION 
           FIGURE 44 CLEANROOM LIGHTING MARKET, BY MOUNTING TYPE
           TABLE 30 CLEANROOM LIGHTING MARKET, BY MOUNTING TYPE, 2020–2023 (USD MILLION)
           FIGURE 45 RECESSED MOUNTED SEGMENT IS EXPECTED TO HOLD THE LARGEST MARKET SHARE DURING THE FORECAST PERIOD
           TABLE 31 CLEANROOM LIGHTING MARKET, BY MOUNTING TYPE, 2024–2029 (USD MILLION)
    9.2 RECESSED MOUNTED 
           9.2.1 INCREASED DEMAND FOR REDUCE CONTAMINATION TO RESULT IN LARGER MARKET SHARE OF THIS SEGMENT
                    TABLE 32 RECESSED MOUNTED: CLEANROOM LIGHTING MARKET, BY REGION, 2020–2023 (USD MILLION)
                    TABLE 33 RECESSED MOUNTED: CLEANROOM LIGHTING MARKET, BY REGION, 2024–2029 (USD MILLION)
    9.3 SURFACE MOUNTED 
           9.3.1 EASE IN INSTALLATION AND MAINTENANCE TO DRIVE THE GROWTH OF THIS SEGMENT
                    TABLE 34 SURFACE MOUNTED: CLEANROOM LIGHTING MARKET, BY REGION, 2020–2023 (USD MILLION)
                    TABLE 35 SURFACE MOUNTED: CLEANROOM LIGHTING MARKET, BY REGION, 2024–2029 (USD MILLION)
 
10 CLEANROOM LIGHTING MARKET, BY END USER (Page No. - 113)
     10.1 INTRODUCTION 
           FIGURE 46 CLEANROOM LIGHTING, BY END USER
           TABLE 36 CLEANROOM LIGHTING MARKET, BY END USER, 2020–2023 (USD MILLION)
           FIGURE 47 HEALTHCARE & LIFE SCIENCES SEGMENT IS EXPECTED TO HOLD THE LARGEST MARKET SHARE DURING FORECAST PERIOD
           TABLE 37 CLEANROOM LIGHTING MARKET, BY END USER, 2024–2029 (USD MILLION)
     10.2 HEALTHCARE & LIFE SCIENCES 
             10.2.1 INCREASED REQUIREMENT FOR OPTIMUM ILLUMINATION CONDITIONS FOR CRITICAL RESEARCH AND HEALTHCARE PROCEDURES TO BOOST GROWTH OF THIS SEGMENT
                        TABLE 38 HEALTHCARE AND LIFE SCIENCES: CLEANROOM LIGHTING MARKET, BY REGION, 2020–2023 (USD MILLION)
                        TABLE 39 HEALTHCARE AND LIFE SCIENCES: CLEANROOM LIGHTING MARKET, BY REGION, 2024–2029 (USD MILLION)
     10.3 INDUSTRIAL MANUFACTURING 
             10.3.1 DEMAND FOR HIGH-PRECISION MANUFACTURING PROCESSES IN CONTROLLED LIGHTING TO ENSURE PRODUCT QUALITY AND MINIMAL DEFECTS TO DRIVE GROWTH IN THIS SEGMENT
                        TABLE 40 INDUSTRIAL MANUFACTURING: CLEANROOM LIGHTING MARKET, BY REGION, 2020–2023 (USD MILLION)
                        TABLE 41 INDUSTRIAL MANUFACTURING: CLEANROOM LIGHTING MARKET, BY REGION, 2024–2029 (USD MILLION)
     10.4 FOOD & BEVERAGES 
             10.4.1 INCREASED DEMAND FOR PACKAGING WITH HYGIENE TO DRIVE GROWTH IN THIS SEGMENT
                        TABLE 42 FOOD & BEVERAGES: CLEANROOM LIGHTING MARKET, BY REGION, 2020–2023 (USD MILLION)
                        TABLE 43 FOOD & BEVERAGES: CLEANROOM LIGHTING MARKET, BY REGION, 2024–2029 (USD MILLION)
     10.5 OTHERS 
             10.5.1 INCREASED REQUIREMENTS FOR PRECISION RESULTS IN RESEARCH INSTITUTIONS AND AEROSPACE TO DRIVE THE GROWTH OF THIS SEGMENT
                        TABLE 44 OTHERS: CLEANROOM LIGHTING MARKET, BY REGION, 2020–2023 (USD MILLION)
                        TABLE 45 OTHERS: CLEANROOM LIGHTING MARKET, BY REGION, 2024–2029 (USD MILLION)
 
11 CLEANROOM LIGHTING MARKET, BY REGION (Page No. - 122)
     11.1 INTRODUCTION 
             FIGURE 48 CLEANROOM LIGHTING MARKET: GEOGRAPHIC SNAPSHOT
             TABLE 46 CLEANROOM LIGHTING MARKET, BY REGION, 2020–2023 (USD MILLION)
             FIGURE 49 ASIA PACIFIC TO GROW AT THE HIGHEST CAGR DURING THE FORECAST PERIOD
             TABLE 47 CLEANROOM LIGHTING MARKET, BY REGION, 2024–2029 (USD MILLION)
     11.2 NORTH AMERICA 
             FIGURE 50 NORTH AMERICA: CLEANROOM LIGHTING MARKET SNAPSHOT
             TABLE 48 NORTH AMERICA: CLEANROOM LIGHTING MARKET, BY COUNTRY, 2020–2023 (USD MILLION)
             TABLE 49 NORTH AMERICA: CLEANROOM LIGHTING MARKET, BY COUNTRY, 2024–2029 (USD MILLION)
             TABLE 50 NORTH AMERICA: CLEANROOM LIGHTING MARKET, BY LIGHT SOURCE, 2020–2023 (USD MILLION)
             TABLE 51 NORTH AMERICA: CLEANROOM LIGHTING MARKET, BY LIGHT SOURCE, 2024–2029 (USD MILLION)
             TABLE 52 NORTH AMERICA: CLEANROOM LIGHTING MARKET, BY END USER, 2020–2023 (USD MILLION)
             TABLE 53 NORTH AMERICA: CLEANROOM LIGHTING MARKET, BY END USER, 2024–2029 (USD MILLION)
             TABLE 54 NORTH AMERICA: CLEANROOM LIGHTING MARKET, BY MOUNTING TYPE, 2020–2023 (USD MILLION)
             TABLE 55 NORTH AMERICA: CLEANROOM LIGHTING MARKET, BY MOUNTING TYPE, 2024–2029 (USD MILLION)
             TABLE 56 NORTH AMERICA: CLEANROOM LIGHTING MARKET, BY OFFERING, 2020–2023 (USD MILLION)
             TABLE 57 NORTH AMERICA: CLEANROOM LIGHTING MARKET, BY OFFERING, 2024–2029 (USD MILLION)
             11.2.1 US
                        11.2.1.1 Presence of a large number of hospitals creates growth for cleanroom lighting in the country
                                     TABLE 58 US: CLEANROOM LIGHTING MARKET, BY MOUNTING TYPE, 2020–2023 (USD MILLION)
                                     TABLE 59 US: CLEANROOM LIGHTING MARKET, BY MOUNTING TYPE, 2024–2029 (USD MILLION)
             11.2.2 CANADA
                        11.2.2.1 Increased number of local and regional players to surge the growth of the market in Canada
                                     TABLE 60 CANADA: CLEANROOM LIGHTING MARKET, BY MOUNTING TYPE, 2020–2023 (USD MILLION)
                                     TABLE 61 CANADA: CLEANROOM LIGHTING MARKET, BY MOUNTING TYPE, 2024–2029 (USD MILLION)
             11.2.3 MEXICO
                        11.2.3.1 Surge in manufacturing and automotive sectors to drive the growth of the market in Mexico
                                     TABLE 62 MEXICO: CLEANROOM LIGHTING MARKET, BY MOUNTING TYPE, 2020–2023 (USD MILLION)
                                     TABLE 63 MEXICO: CLEANROOM LIGHTING MARKET, BY MOUNTING TYPE, 2024–2029 (USD MILLION)
     11.3 EUROPE 
             FIGURE 51 EUROPE: CLEANROOM LIGHTING MARKET SNAPSHOT
             TABLE 64 EUROPE: CLEANROOM LIGHTING MARKET, BY COUNTRY, 2020–2023 (USD MILLION)
             TABLE 65 EUROPE: CLEANROOM LIGHTING MARKET, BY COUNTRY, 2024–2029 (USD MILLION)
             TABLE 66 EUROPE: CLEANROOM LIGHTING MARKET, BY LIGHT SOURCE, 2020–2023 (USD MILLION)
             TABLE 67 EUROPE: CLEANROOM LIGHTING MARKET, BY LIGHT SOURCE, 2024–2029 (USD MILLION)
             TABLE 68 EUROPE: CLEANROOM LIGHTING MARKET, BY END USER, 2020–2023 (USD MILLION)
             TABLE 69 EUROPE: CLEANROOM LIGHTING MARKET, BY END USER, 2024–2029 (USD MILLION)
             TABLE 70 EUROPE: CLEANROOM LIGHTING MARKET, BY MOUNTING TYPE, 2020–2023 (USD MILLION)
             TABLE 71 EUROPE: CLEANROOM LIGHTING MARKET, BY MOUNTING TYPE, 2024–2029 (USD MILLION)
             TABLE 72 EUROPE: CLEANROOM LIGHTING MARKET, BY OFFERING, 2020–2023 (USD MILLION)
             TABLE 73 EUROPE: CLEANROOM LIGHTING MARKET, BY OFFERING, 2024–2029 (USD MILLION)
             11.3.1 GERMANY
                        11.3.1.1 Stringent regulations for cleanrooms in the country to boost the demand for this market
                                     TABLE 74 GERMANY: CLEANROOM LIGHTING MARKET, BY MOUNTING TYPE, 2020–2023 (USD MILLION)
                                     TABLE 75 GERMANY: CLEANROOM LIGHTING MARKET, BY MOUNTING TYPE, 2024–2029 (USD MILLION)
             11.3.2 UK
                        11.3.2.1 Growing need for pristine manufacturing atmospheres to fuel the growth of the market in UK
                                     TABLE 76 UK: CLEANROOM LIGHTING MARKET, BY MOUNTING TYPE, 2020–2023 (USD MILLION)
                                     TABLE 77 UK: CLEANROOM LIGHTING MARKET, BY MOUNTING TYPE, 2024–2029 (USD MILLION)
             11.3.3 FRANCE
                        11.3.3.1 Increasing government regulations for food & beverage production and healthcare to drive the growth of the market in this country
                                     TABLE 78 FRANCE: CLEANROOM LIGHTING MARKET, BY MOUNTING TYPE, 2020–2023 (USD MILLION)
                                     TABLE 79 FRANCE: CLEANROOM LIGHTING MARKET, BY MOUNTING TYPE, 2024–2029 (USD MILLION)
             11.3.4 REST OF EUROPE
                        TABLE 80 REST OF EUROPE: CLEANROOM LIGHTING MARKET, BY MOUNTING TYPE, 2020–2023 (USD MILLION)
                        TABLE 81 REST OF EUROPE: CLEANROOM LIGHTING MARKET, BY MOUNTING TYPE, 2024–2029 (USD MILLION)
     11.4 ASIA PACIFIC 
             FIGURE 52 ASIA PACIFIC: CLEANROOM LIGHTING MARKET SNAPSHOT
             TABLE 82 ASIA PACIFIC: CLEANROOM LIGHTING MARKET, BY COUNTRY, 2020–2023 (USD MILLION)
             TABLE 83 ASIA PACIFIC: CLEANROOM LIGHTING MARKET, BY COUNTRY, 2024–2029 (USD MILLION)
             TABLE 84 ASIA PACIFIC: CLEANROOM LIGHTING MARKET, BY LIGHT SOURCE, 2020–2023 (USD MILLION)
             TABLE 85 ASIA PACIFIC: CLEANROOM LIGHTING MARKET, BY LIGHT SOURCE, 2024–2029 (USD MILLION)
             TABLE 86 ASIA PACIFIC: CLEANROOM LIGHTING MARKET, BY END USER, 2020–2023 (USD MILLION)
             TABLE 87 ASIA PACIFIC: CLEANROOM LIGHTING MARKET, BY END USER, 2024–2029 (USD MILLION)
             TABLE 88 ASIA PACIFIC: CLEANROOM LIGHTING MARKET, BY MOUNTING TYPE, 2020–2023 (USD MILLION)
             TABLE 89 ASIA PACIFIC: CLEANROOM LIGHTING MARKET, BY MOUNTING TYPE, 2024–2029 (USD MILLION)
             TABLE 90 ASIA PACIFIC: CLEANROOM LIGHTING MARKET, BY OFFERING, 2020–2023 (USD MILLION)
             TABLE 91 ASIA PACIFIC: CLEANROOM LIGHTING MARKET, BY OFFERING, 2024–2029 (USD MILLION)
             11.4.1 CHINA
                        11.4.1.1 Surge in demand for cleanroom lighting for industrial manufacturing in the country to create growth opportunities in the market
                                     TABLE 92 CHINA: CLEANROOM LIGHTING MARKET, BY MOUNTING TYPE, 2020–2023 (USD MILLION)
                                     TABLE 93 CHINA: CLEANROOM LIGHTING MARKET, BY MOUNTING TYPE, 2024–2029 (USD MILLION)
             11.4.2 JAPAN
                        11.4.2.1 Increased number of healthcare facilities in the country to propel the growth of the market in Japan
                                     TABLE 94 JAPAN: CLEANROOM LIGHTING MARKET, BY MOUNTING TYPE, 2020–2023 (USD MILLION)
                                     TABLE 95 JAPAN: CLEANROOM LIGHTING MARKET, BY MOUNTING TYPE, 2024–2029 (USD MILLION)
             11.4.3 SOUTH KOREA
                        11.4.3.1 Large-scale semiconductor manufacturing to create growth opportunities for South Korea in the market
                                     TABLE 96 SOUTH KOREA: CLEANROOM LIGHTING MARKET, BY MOUNTING TYPE, 2020–2023 (USD MILLION)
                                     TABLE 97 SOUTH KOREA: CLEANROOM LIGHTING MARKET, BY MOUNTING TYPE, 2024–2029 (USD MILLION)
             11.4.4 REST OF APAC
                        TABLE 98 REST OF APAC: CLEANROOM LIGHTING MARKET, BY MOUNTING TYPE, 2020–2023 (USD MILLION)
                        TABLE 99 REST OF APAC: CLEANROOM LIGHTING MARKET, BY MOUNTING TYPE, 2024–2029 (USD MILLION)
     11.5 REST OF THE WORLD 
             TABLE 100 ROW: CLEANROOM LIGHTING MARKET, BY REGION, 2020–2023 (USD MILLION)
             FIGURE 53 SOUTH AMERICA IS EXPECTED TO WITNESS HIGHEST GROWTH RATE DURING THE FORECAST PERIOD
             TABLE 101 ROW: CLEANROOM LIGHTING MARKET, BY REGION, 2024–2029 (USD MILLION)
             TABLE 102 ROW: CLEANROOM LIGHTING MARKET, BY LIGHT SOURCE, 2020–2023 (USD MILLION)
             TABLE 103 ROW: CLEANROOM LIGHTING MARKET, BY LIGHT SOURCE, 2024–2029 (USD MILLION)
             TABLE 104 ROW: CLEANROOM LIGHTING MARKET, BY END USER, 2020–2023 (USD MILLION)
             TABLE 105 ROW: CLEANROOM LIGHTING MARKET, BY END USER, 2024–2029 (USD MILLION)
             TABLE 106 ROW: CLEANROOM LIGHTING MARKET, BY MOUNTING TYPE, 2020–2023 (USD MILLION)
             TABLE 107 ROW: CLEANROOM LIGHTING MARKET, BY MOUNTING TYPE, 2024–2029 (USD MILLION)
             TABLE 108 ROW: CLEANROOM LIGHTING MARKET, BY OFFERING, 2020–2023 (USD MILLION)
             TABLE 109 ROW: CLEANROOM LIGHTING MARKET, BY OFFERING, 2024–2029 (USD MILLION)
             11.5.1 SOUTH AMERICA
                        11.5.1.1 Advanced healthcare sector to fuel the demand for South America's cleanroom lighting market
                                     TABLE 110 SOUTH AMERICA: CLEANROOM LIGHTING MARKET, BY MOUNTING TYPE, 2020–2023 (USD MILLION)
                                     TABLE 111 SOUTH AMERICA: CLEANROOM LIGHTING MARKET, BY MOUNTING TYPE, 2024–2029 (USD MILLION)
             11.5.2 MIDDLE EAST
                        11.5.2.1 Increasing demand for hygiene and environmentally friendly enclosures for hospitals and pharmaceuticals to drive growth of the market in this region
                                     TABLE 112 MIDDLE EAST: CLEANROOM LIGHTING MARKET, BY REGION, 2020–2023 (USD MILLION)
                                     TABLE 113 MIDDLE EAST: CLEANROOM LIGHTING MARKET, BY REGION, 2024–2029 (USD MILLION)
                                     TABLE 114 MIDDLE EAST: CLEANROOM LIGHTING MARKET, BY MOUNTING TYPE, 2020–2023 (USD MILLION)
                                     TABLE 115 MIDDLE EAST: CLEANROOM LIGHTING MARKET, BY MOUNTING TYPE, 2024–2029 (USD MILLION)
                        11.5.2.2 GCC Countries
                        11.5.2.3 Rest of Middle East
             11.5.3 AFRICA
                        11.5.3.1 Growing industries and advancements in healthcare facilities to propel the growth of the market in Africa
                                     TABLE 116 AFRICA: CLEANROOM LIGHTING MARKET, BY MOUNTING TYPE, 2020–2023 (USD MILLION)
                                     TABLE 117 AFRICA: CLEANROOM LIGHTING MARKET, BY MOUNTING TYPE, 2024–2029 (USD MILLION)
 
12 COMPETITIVE LANDSCAPE (Page No. - 153)
     12.1 OVERVIEW 
     12.2 KEY PLAYER STRATEGIES/RIGHT TO WIN 
             TABLE 118 KEY DEVELOPMENTS UNDERTAKEN BY LEADING PLAYERS IN THE CLEANROOM LIGHTING MARKET FROM 2020 TO 2023
             12.2.1 PRODUCT PORTFOLIO
             12.2.2 REGIONAL FOCUS
             12.2.3 MANUFACTURING FOOTPRINT
             12.2.4 ORGANIC/INORGANIC GROWTH STRATEGIES
     12.3 MARKET SHARE AND RANKING ANALYSIS, 2023 
             TABLE 119 DEGREE OF COMPETITION, 2023
     12.4 FIVE-YEAR COMPANY REVENUE ANALYSIS, 2018-2022 
     12.5 COMPANY EVALUATION MATRIX, 2022 
             FIGURE 55 CLEANROOM LIGHTING MARKET (GLOBAL): COMPANY EVALUATION MATRIX, 2023
             12.5.1 STARS
             12.5.2 EMERGING LEADERS
             12.5.3 PERVASIVE PLAYERS
             12.5.4 PARTICIPANTS
     12.6 COMPETITIVE BENCHMARKING 
             TABLE 120 COMPANY FOOTPRINT
             TABLE 121 COMPANY MOUNTING TYPE FOOTPRINT
             TABLE 122 COMPANY APPLICATION FOOTPRINT
             TABLE 123 COMPANY REGION FOOTPRINT
     12.7 STARTUP/SME EVALUATION MATRIX, 2023 
             FIGURE 56 CLEANROOM LIGHTING (GLOBAL): STARTUP/SME EVALUATION MATRIX, 2023
             12.7.1 PROGRESSIVE COMPANIES
             12.7.2 RESPONSIVE COMPANIES
             12.7.3 DYNAMIC COMPANIES
             12.7.4 STARTING BLOCKS
                        TABLE 124 CLEANROOM LIGHTING MARKET: DETAILED LIST OF KEY STARTUPS/SMES
                        TABLE 125 CLEANROOM LIGHTING MARKET: COMPETITIVE BENCHMARKING OF KEY STARTUP/SMES
     12.8 COMPETITIVE SCENARIO 
             12.8.1 PRODUCT LAUNCHES
                        TABLE 126 PRODUCT LAUNCHES, JANUARY 2020 TO DECEMBER 2023
             12.8.2 DEALS
                        TABLE 127 DEALS, JANUARY 2020 TO DECEMBER 2023
 
13 COMPANY PROFILES (Page No. - 170)
(Business Overview, Products/Solutions/Services Offered, Recent Developments, and MnM View (Key strengths/Right to Win, Strategic Choices Made, and Weaknesses and Competitive Threats))*  
     13.1 KEY PLAYERS 
             13.1.1 ACUITY BRANDS, INC.
                        TABLE 128 ACUITY BRANDS, INC.: BUSINESS OVERVIEW
                        FIGURE 57 ACUITY BRANDS, INC.: COMPANY SNAPSHOT
                        TABLE 129 ACUITY BRANDS, INC.: PRODUCTS/SOLUTIONS/SERVICES OFFERED
                        TABLE 130 ACUITY BRANDS, INC.: DEALS
             13.1.2 SIGNIFY HOLDING
                        TABLE 131 SIGNIFY HOLDING: COMPANY OVERVIEW
                        FIGURE 58 SIGNIFY HOLDING: COMPANY SNAPSHOT
                        TABLE 132 SIGNIFY HOLDING: PRODUCTS/SOLUTIONS/SERVICES OFFERED
                        TABLE 133 SIGNIFY HOLDING: DEALS
                        TABLE 134 SIGNIFY HOLDING: OTHERS
             13.1.3 CROMPTON GREAVES CONSUMER ELECTRICALS LIMITED
                        TABLE 135 CROMPTON GREAVES CONSUMER ELECTRICALS LIMITED: COMPANY OVERVIEW
                        FIGURE 59 CROMPTON GREAVES CONSUMER ELECTRICALS LIMITED: COMPANY SNAPSHOT
                        TABLE 136 CROMPTON GREAVES CONSUMER ELECTRICALS LIMITED: PRODUCTS/SOLUTIONS/SERVICES OFFERED
             13.1.4 TERRA UNIVERSAL. INC.
                        TABLE 137 TERRA UNIVERSAL. INC.: COMPANY OVERVIEW
                        TABLE 138 TERRA UNIVERSAL. INC.: PRODUCTS/SOLUTIONS/SERVICES OFFERED
                        TABLE 139 TERRA UNIVERSAL. INC.: DEALS
             13.1.5 KENALL MANUFACTURING
                        TABLE 140 KENALL MANUFACTURING: COMPANY OVERVIEW
                        TABLE 141 KENALL MANUFACTURING: PRODUCTS/SOLUTIONS/SERVICES OFFERED
                        TABLE 142 KENALL MANUFACTURING: PRODUCT LAUNCHES
             13.1.6 WIPRO LIGHTING.
                        TABLE 143 WIPRO LIGHTING: COMPANY OVERVIEW
                        TABLE 144 WIPRO LIGHTING: PRODUCTS/SOLUTIONS/SERVICES OFFERED
             13.1.7 LUG LIGHT FACTORY SP. Z.O.O.
                        TABLE 145 LUG LIGHT FACTORY SP. Z.O.O.: COMPANY OVERVIEW
                        TABLE 146 LUG LIGHT FACTORY SP. Z.O.O.: PRODUCTS/SOLUTIONS/SERVICES OFFERED
                        TABLE 147 LUG LIGHT FACTORY SP. Z.O.O.: OTHERS
             13.1.8 SOLITE EUROPE
                        TABLE 148 SOLITE EUROPE: COMPANY OVERVIEW
                        TABLE 149 SOLITE EUROPE: PRODUCTS/SOLUTIONS/SERVICES OFFERED
             13.1.9 BUKAS LIGHTING GROUP
                        TABLE 150 BUKAS LIGHTING GROUP: COMPANY OVERVIEW
                        TABLE 151 BUKAS LIGHTING GROUP: PRODUCTS/SOLUTIONS/SERVICES OFFERED
                        TABLE 152 BUKAS LIGHTING GROUP: OTHERS
             13.1.10 EAGLE LIGHTING AUSTRALIA PTY LTD
                        TABLE 153 EAGLE LIGHTING AUSTRALIA PTY LTD: COMPANY OVERVIEW
                        TABLE 154 EAGLE LIGHTING AUSTRALIA PTY LTD: PRODUCTS/SOLUTIONS/SERVICES OFFERED
     13.2 OTHER PLAYERS 
             13.2.1 ISOONE
             13.2.2 IMPERIAL
             13.2.3 LUDWIG LEUCHTEN GMBH & CO. KG
             13.2.4 HAVELLS INDIA LTD.
             13.2.5 LINDNER GROUP
             13.2.6 LEDSPAN LTD.
             13.2.7 ASTRA LIGHTING
             13.2.8 THORLUX LIGHTING
             13.2.9 LOS ANGELES LIGHTING MANUFACTURING COMPANY
             13.2.10 SAAKVEE TECHNOLOGIES INDIA PRIVATE LIMITED
             13.2.11 NORTHICLIFFE LIGHTING
             13.2.12 PMEA SOLAR TECH SOLUTIONS PRIVATE LIMITED
             13.2.13 CLEANAIR SOLUTIONS
             13.2.14 CLEANROOM INDUSTRIES SDN BHD.
             13.2.15 SUNYDA
             13.2.16 EATON
*Details on Business Overview, Products/Solutions/Services Offered, Recent Developments, and MnM View (Key strengths/Right to Win, Strategic Choices Made, and Weaknesses and Competitive Threats) might not be captured in case of unlisted companies.  
 
14 APPENDIX (Page No. - 218)
     14.1 DISCUSSION GUIDE 
     14.2 KNOWLEDGESTORE: MARKETSANDMARKETS’ SUBSCRIPTION PORTAL 
     14.3 AVAILABLE CUSTOMIZATIONS 
     14.4 RELATED REPORTS 
     14.5 AUTHOR DETAILS 


This research elucidates the approach used to compile this report on Cleanroom Lighting market. The study employs two fundamental information sources, secondary and primary sources, which collectively provide a comprehensive, technical, and commercial analysis of Cleanroom Lighting market. Secondary sources encompass data derived from sources like company websites, publications, industry associations, and databases such as OneSource, Factiva, and Bloomberg. Additionally, primary sources were tapped, including insights from key opinion leaders spanning various sectors, experts from governmental entities and associations, preferred suppliers, cleanroom lighting manufacturers, distributors, technology experts, subject matter specialists (SMEs), C-level executives of prominent firms, and industry consultants. These interviews were instrumental in acquiring, validating, and comprehending crucial information and in gauging the future prospects and trends within the Cleanroom Lighting market. Key market players were identified through secondary research, and their market positioning was assessed via a combination of primary and secondary research methods. Furthermore, this research integrated an examination of the annual reports of market participants to pinpoint the leading players in the Cleanroom Lighting market.

Secondary Research

In the secondary research phase, we referred to a variety of secondary sources to identify and collect pertinent information for this Cleanroom Lighting market study. These secondary sources encompassed materials such as companies' annual reports, press releases, and investor presentations, as well as white papers, accredited publications, and articles authored by recognized experts. We also consulted directories and databases. The global size of the Cleanroom Lighting market was determined through secondary data obtained from both paid and freely available sources. This involved evaluating the product portfolios of leading companies and assessing the quality of their offerings. The secondary research process was instrumental in gathering essential data related to the industry's supply chain, the financial aspects of the market, the total count of major market players, and the segmentation of the market in alignment with industry trends down to the most granular level, including geographic markets. Furthermore, this phase allowed for the identification and examination of industry trends and significant developments from both market and technology perspectives.

Primary Research

In the primary research phase, we conducted interviews with a range of primary sources to acquire both qualitative and quantitative data concerning the market in four primary regions: Asia Pacific, North America, Europe, and the Rest of the World (Middle East, Africa, and South America). On the supply side, primary sources included industry experts occupying various roles, such as CEOs, vice presidents, marketing directors, technology directors, and other key executives from major companies and organizations operating within the Cleanroom Lighting market or closely related sectors. This primary research was instrumental in gathering, verifying, and validating critical data that had been sourced from other channels following the market engineering phase.

Primary research also served to identify various market segments, industry trends, key players, the competitive landscape, and the pivotal market dynamics, encompassing factors such as drivers, constraints, opportunities, and challenges, as well as the key strategies adopted by market players. The majority of the primary interviews focused on engaging with the supply side of the market, and the collection of this primary data was carried out through questionnaires, email correspondence, and telephonic interviews.

Cleanroom Lighting Market
 Size, and Share

To know about the assumptions considered for the study, download the pdf brochure

Market Size Estimation

Both the top-down and bottom-up approaches were used extensively in the market engineering process. This entire research methodology includes the study of annual and financial reports of top players, as well as interviews with experts (such as CEOs, VPs, directors, and marketing executives) for key insights (both quantitative and qualitative). The key players in the cleanroom lighting market have been identified through secondary research, and their market share in the respective regions has been determined through primary and secondary research. All percentage shares, splits, and breakdowns have been determined using secondary sources and verified through primary sources. Several data triangulation methods were also used to perform market forecasting and market estimation for the overall market segments and sub-segments in the report. Multiple qualitative and quantitative analyses were performed on the market engineering process to gain key insights throughout the report. All the possible parameters that affect the markets covered in this research have been accounted for, viewed in detail, verified through primary research, and analyzed to obtain the final quantitative and qualitative data. This data was consolidated and supplemented with detailed inputs and analysis from MarketsandMarkets and presented in this report. The following figures depict the overall market size estimation process employed for the purpose of this study.

The revenues were identified geographically as well as market segment-wise, using financial statements and analyzing annual reports of the key market players. Interviews with CEOs, VPs, directors, and marketing executives were also conducted to gain insights on the key players and the cleanroom lighting market. All the market shares were estimated using secondary and primary research. This data was consolidated, supplemented with detailed inputs and analysis from MarketsandMarkets, and presented in this report.

Global Cleanroom Lighting Market Size: Bottom-Up Approach

Cleanroom Lighting Market
 Size, and Bottom-Up Approach

Global Cleanroom Lighting Market Size: Top-down Approach

Cleanroom Lighting Market
 Size, and Top-down Approach

Data Triangulation

Following the determination of the comprehensive market size through the previously described market size estimation process, the entire market was subsequently divided into multiple segments and sub-segments. To accomplish this and attain precise statistical data for all segments and sub-segments, the market engineering process employed a data triangulation method. This triangulation involved a thorough examination of diverse factors and trends originating from both the demand and supply aspects of the market. In addition to this, the market's accuracy and reliability were substantiated through a combination of both top-down and bottom-up approaches.

Market Definition

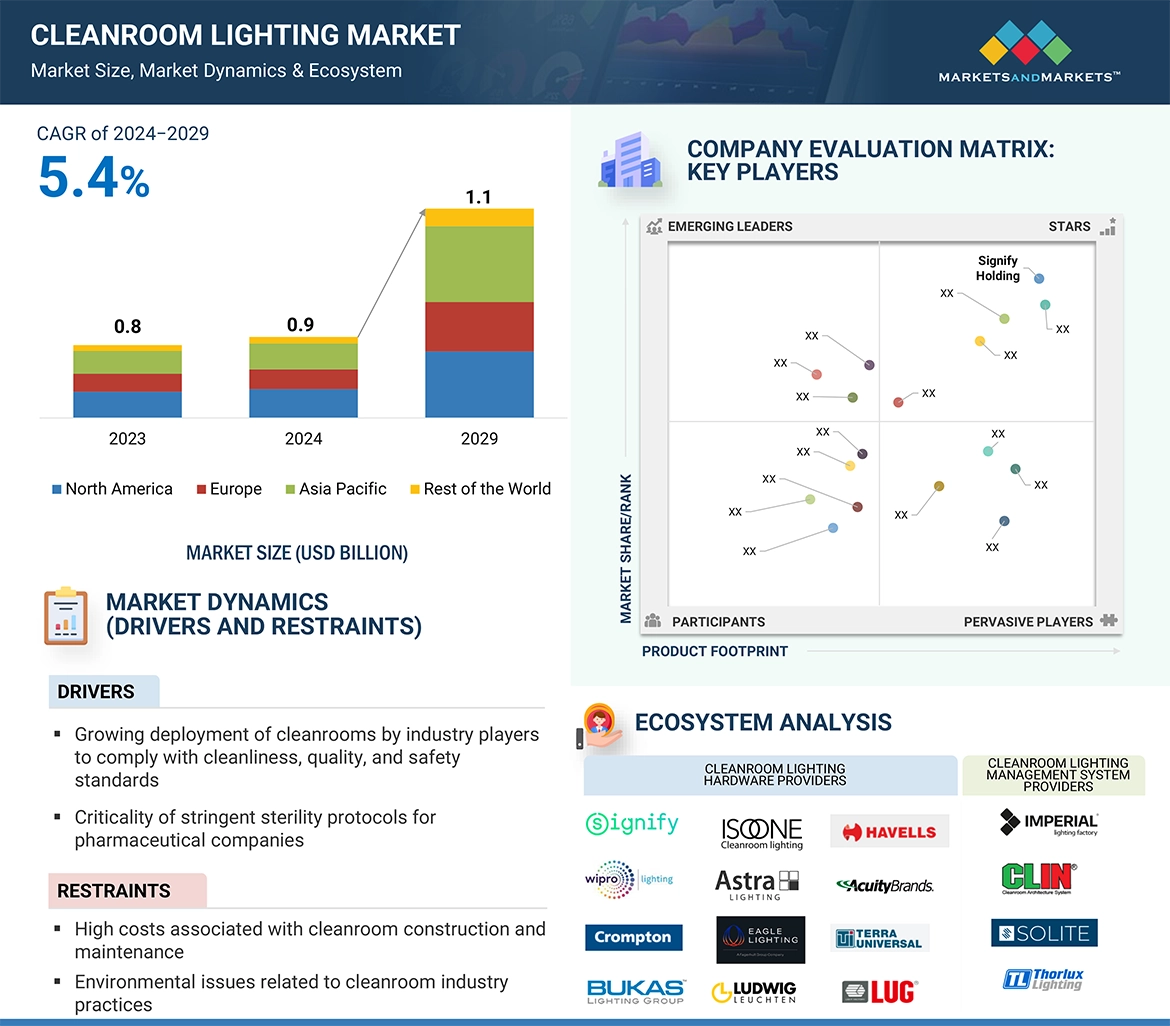
The cleanroom lighting market refers to the industry involved in the design, manufacturing, and distribution of specialized lighting solutions tailored for cleanroom environments. Cleanrooms are controlled spaces where the concentration of airborne particles, temperature, humidity, and other environmental factors are regulated to meet specific cleanliness standards. Cleanroom lighting plays a critical role in these environments by providing illumination while minimizing the risk of particle contamination. These lighting solutions are designed to comply with strict industry standards and regulations governing cleanliness, safety, and performance in sectors such as pharmaceuticals, biotechnology, semiconductor manufacturing, healthcare, and other industries where maintaining a controlled and sterile environment is crucial.

Stakeholders

  • Cleanroom product manufacturers
  • Cleanroom construction companies
  • Biotechnology companies
  • Medical device manufacturers
  • Pharmaceuticals manufacturers
  • Hospitals, research laboratories, and clinical laboratories
  • Solution integrators
  • Technology providers
  • Research organizations and consulting companies
  • Associations, organizations, forums, and alliances related to cleanroom lighting
  • Government bodies such as regulatory authorities and policymakers
  • Venture capitalists, private equity firms, and startups

Study Objectives

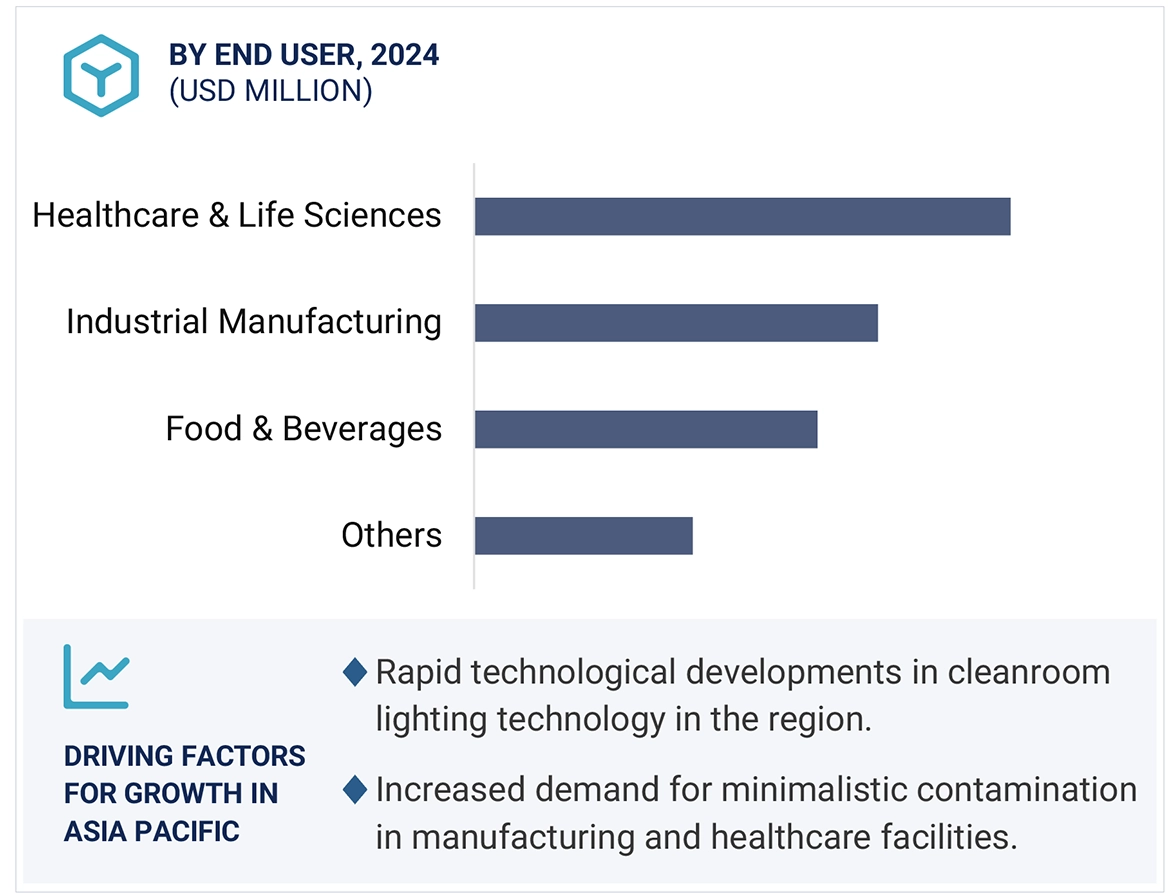
  • To estimate, segment, and forecast the overall size of the Cleanroom Lighting market, by mounting type, offering, light source, and region, in terms of value.
  • To forecast the market size, in terms of value, for Cleanroom Lighting market with regard to four main regions—North America, Europe, Asia Pacific, and the Rest of the World (RoW)
  • To describe and forecast the cleanroom lighting market, in terms of volume, by light source
  • To provide detailed information regarding the drivers, restraints, opportunities, and challenges influencing the growth of the market
  • To analyze the value chain of Cleanroom Lighting market
  • To strategically analyze macro and micromarkets1 with respect to individual growth trends, prospects, and contributions to the overall market
  • To analyze industry trends, pricing data, patents and innovations, and trade data (export and import data) in the Cleanroom Lighting market
  • To analyze opportunities in the market for stakeholders and provide a detailed competitive landscape
  • To study technology analysis, key buying criteria, and key conferences (2024 -2025)
  • To strategically profile the key players and comprehensively analyze their market position in terms of their ranking and core competencies2, and to provide detailed information about the competitive landscape of the market
  • To analyze the annual revenues generated by key players in Cleanroom Lighting market
  • To analyze growth strategies such as product developments, agreements, expansion, and mergers and acquisitions in the cleanroom lighting market
  • To analyze competitive developments, such as product launches & developments, collaborations, contracts, partnerships, acquisitions, and expansions, in the Cleanroom Lighting market
  • To analyze the overall, as well as regional impact of the recession on the market

Available Customizations

With the given market data, MarketsandMarkets offers customizations based on the specific requirements of companies. The following customization options are available for the report:

Company Information

  • Market size based on different subsegments of the Cleanroom Lighting Market
  • Detailed analysis and profiling of additional market players (up to five)
Custom Market Research Services

We will customize the research for you, in case the report listed above does not meet with your exact requirements. Our custom research will comprehensively cover the business information you require to help you arrive at strategic and profitable business decisions.

Request Customization
Report Code
SE 7115
Published ON
Jan, 2024
Choose License Type
BUY NOW
  • SHARE
X
Request Customization
Speak to Analyst
Speak to Analyst
OR FACE-TO-FACE MEETING
PERSONALIZE THIS RESEARCH
  • Triangulate with your Own Data
  • Get Data as per your Format and Definition
  • Gain a Deeper Dive on a Specific Application, Geography, Customer or Competitor
  • Any level of Personalization
REQUEST A FREE CUSTOMIZATION
LET US HELP YOU!
  • What are the Known and Unknown Adjacencies Impacting the Cleanroom Lighting Market
  • What will your New Revenue Sources be?
  • Who will be your Top Customer; what will make them switch?
  • Defend your Market Share or Win Competitors
  • Get a Scorecard for Target Partners
CUSTOMIZED WORKSHOP REQUEST
+1-888-600-6441
  • Call Us
  • +1-888-600-6441 (Corporate office hours)
  • +1-888-600-6441 (US/Can toll free)
  • +44-800-368-9399 (UK office hours)
CONNECT WITH US
ABOUT TRUST ONLINE
©2024 MarketsandMarkets Research Private Ltd. All rights reserved
DMCA.com Protection Status Website Feedback