The market size of companies offering cloud managed network was arrived at based on the secondary data available through paid and unpaid sources, and by analyzing the product portfolios of major companies in the ecosystem and rating the companies based on their product capabilities and business strategies.
Secondary Research
In the secondary research process, various sources were referred to, for identifying and collecting information for the study. Secondary sources included annual reports, press releases, investor presentations of companies, and product data sheets, white papers, journals, certified publications, and articles from recognized authors, government websites, directories, and databases.
Secondary research was used to obtain key information about the industry’s supply chain, the total pool of key players, market classification and segmentation according to industry trends to the bottom-most level, regional markets, and key developments from both market- and technology oriented perspectives, all of which were further validated by primary sources.
Primary Research
In the primary research process, various primary sources from both supply and demand sides were interviewed to obtain qualitative and quantitative information for this report. The primary sources from the supply side included industry experts, such as Chief Executive Officers (CEOs), Vice Presidents (VPs), marketing directors, technology and innovation directors, and related key executives from various key companies and organizations operating in the cloud managed network market.
Primary interviews were conducted to gather insights, such as market statistics, latest trends disrupting the market, new use cases implemented, data of revenue collected from products and services, market breakups, market size estimations, market forecasts, and data triangulation. Primary research also helped understand various trends related to technology, service type, deployment, and region. Demand-side stakeholders, such as Chief Information Officers (CIOs), Chief Technology Officers (CTOs), Chief Security Officers (CSOs), the installation teams of governments/end users using cloud managed network, and digital initiatives project teams were interviewed to understand the buyers’ perspective on suppliers, products, service providers, and their current use of services, which would affect the overall cloud managed network market.
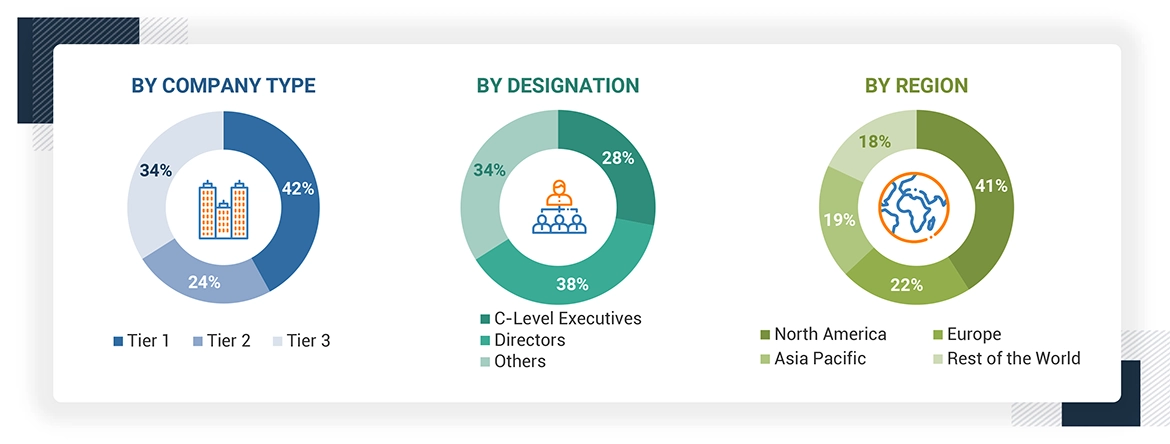
Note: Tier 1 company = recorded overall annual revenues of more than USD 10 billion; Tier 2 company =
USD 1–10 billion; and Tier 3 company = USD 500 million – 1 billion
RoW* includes Middle East and Africa and Latin America
To know about the assumptions considered for the study, download the pdf brochure
Market Size Estimation
Top-down and bottom-up approaches were used to estimate and validate the size of the cloud managed network market and various other dependent subsegments. The research methodology used to estimate the market size included the following:
-
Key players in the market were identified through secondary research, and their revenue contributions in respective countries were determined through primary and secondary research.
-
This entire procedure included the study of the annual and financial reports of top market players and extensive interviews for key insights from industry leaders, such as Chief Executive Officers (CEOs), VPs, directors, and marketing executives.
-
All percentage splits and breakups were determined using secondary sources and verified through primary sources.
All the possible parameters that affect the market covered in this research study have been accounted for, viewed in extensive detail, verified through primary research, and analyzed to get the final quantitative and qualitative data. This data is consolidated and supplemented with detailed inputs and analysis from MarketsandMarkets.
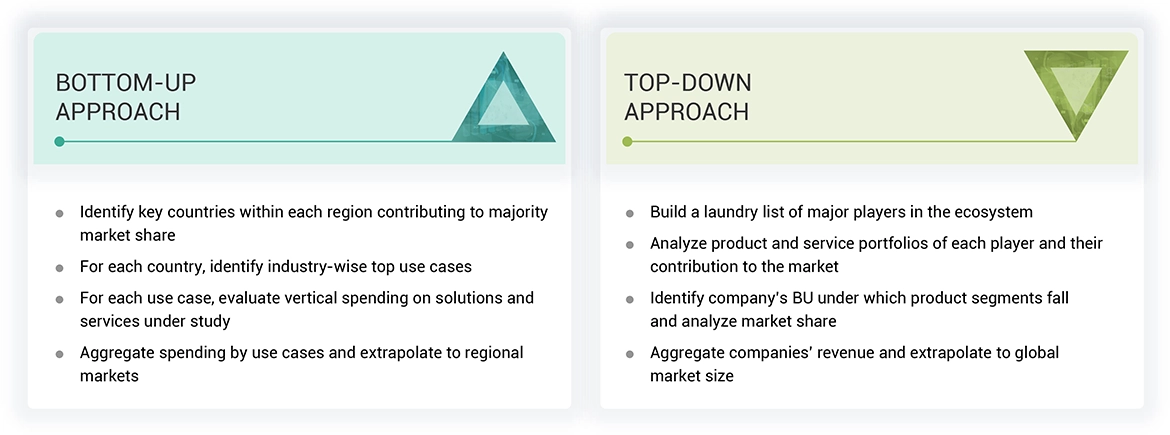
In the bottom-up approach, the adoption trend of cloud managed network among different industry verticals in key countries with respect to regions that contribute most of the market share was identified. For cross-validation, the adoption trend of cloud managed network, along with different use cases with respect to their business segments, was identified and extrapolated. Weightage was given to the use cases identified in different service areas for the calculation. An exhaustive list of all vendors offering services in the cloud managed network market was prepared. The revenue contribution of all vendors in the market was estimated through annual reports, press releases, funding, investor presentations, paid databases, and primary interviews. Vendors with cloud managed network offerings were considered for the evaluation of the market size. Each vendor was evaluated based on service offerings and services across verticals. The aggregate of the revenue of all companies was extrapolated to arrive at the overall market size. Each subsegment was studied and analyzed for its market size and regional penetration. Based on these numbers, the regional split was determined through primary and secondary sources.
Cloud Managed Network Market: TOP-DOWN and Bottom Up Approach
Data Triangulation
After arriving at the overall market size using the market size estimation processes as explained above, the market was split into several segments and subsegments. The data triangulation and market breakup procedures were employed, wherever applicable, to complete the overall market engineering process and arrive at the exact statistics of each market segment and subsegment. The data was triangulated by studying various factors and trends from both the demand and supply sides.
Report Objectives
-
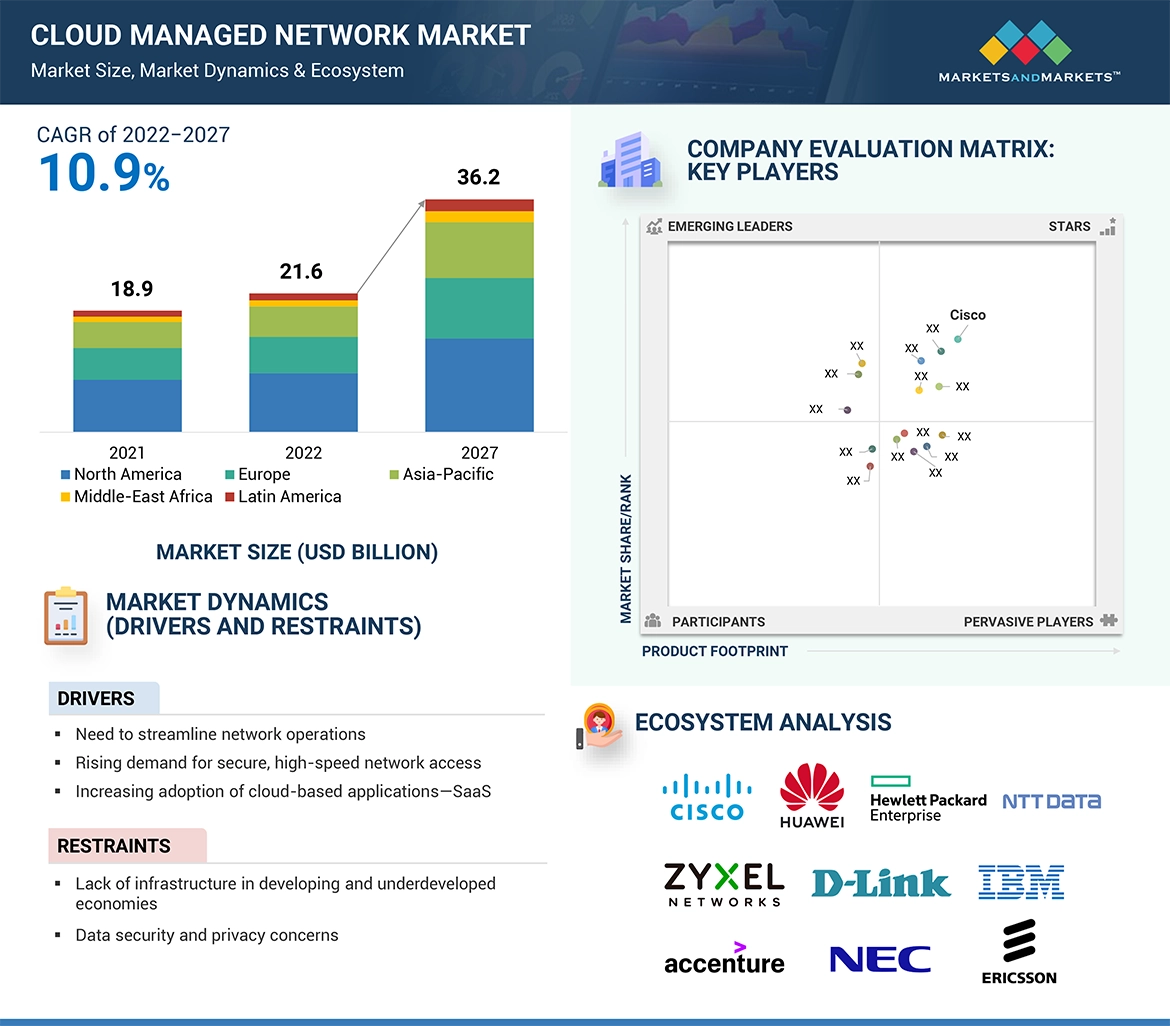
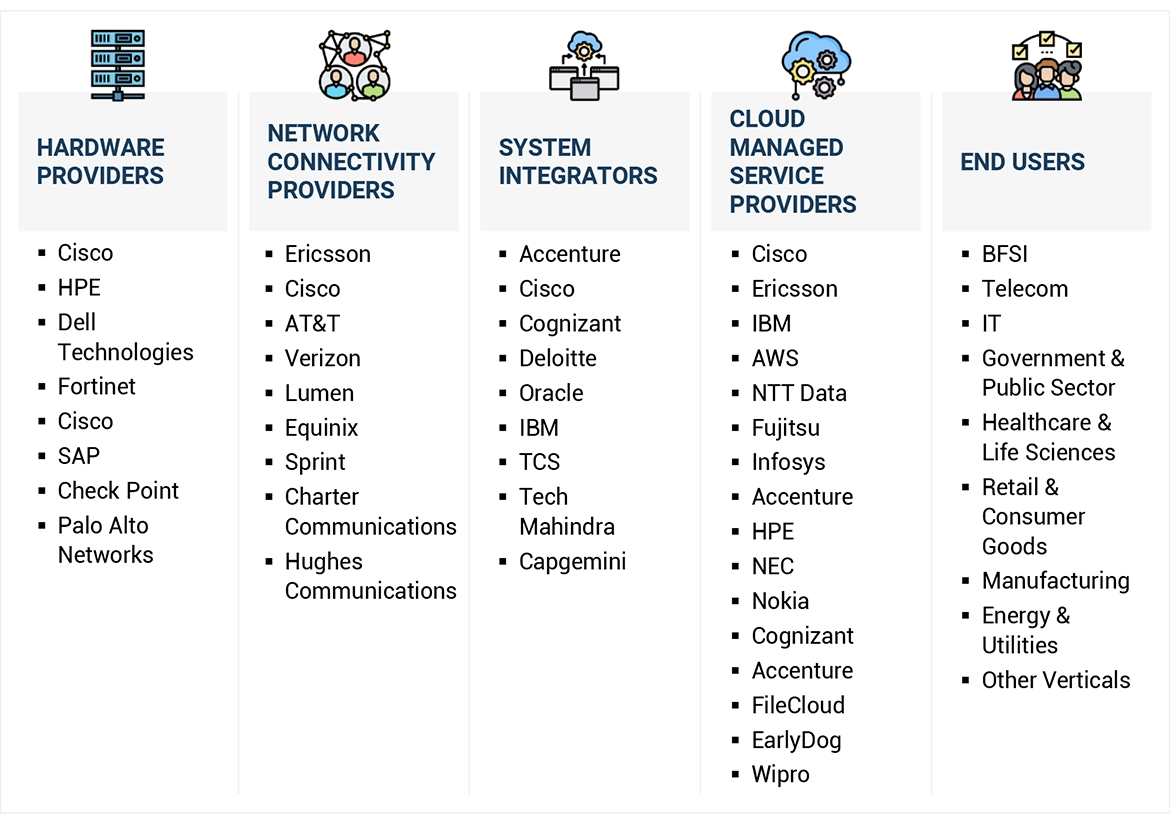
To define, describe, and forecast the global cloud managed network market on the basis of components (solutions and services), deployment mode (public and private cloud), organization size, verticals, and regions
-
To forecast the market size of the five major regional segments: North America, Europe, Asia Pacific, Middle East & Africa, and Latin America
-
To strategically analyze the market subsegments with respect to individual growth trends, prospects, and contributions to the total market
-
To provide detailed information related to the major factors influencing the growth of the market (drivers, restraints, opportunities, and challenges)
-
To strategically analyze macro and micromarkets1 with respect to growth trends, prospects, and their contributions to the overall market
-
To analyze industry trends, patents & innovations, and pricing data related to the cloud managed network market
-
To analyze the opportunities in the market for stakeholders and provide details of the competitive landscape for major players
-
To profile key players in the market and comprehensively analyze their market share/ranking and core competencies2
-
To track and analyze competitive developments in the market, such as mergers and acquisitions, new product developments, and partnerships and collaborations
Available Customizations
Along with the market data, MarketsandMarkets offers customizations as per the company’s specific needs. The following customization options are available for the report: Company information
-
Detailed analysis and profiling of additional market players (Up to 5)


 BY COUNTRY, 2022 (USD MILLION)
 DRIVING FACTORS FOR MARKET GROWTH IN ASIA PACIFIC
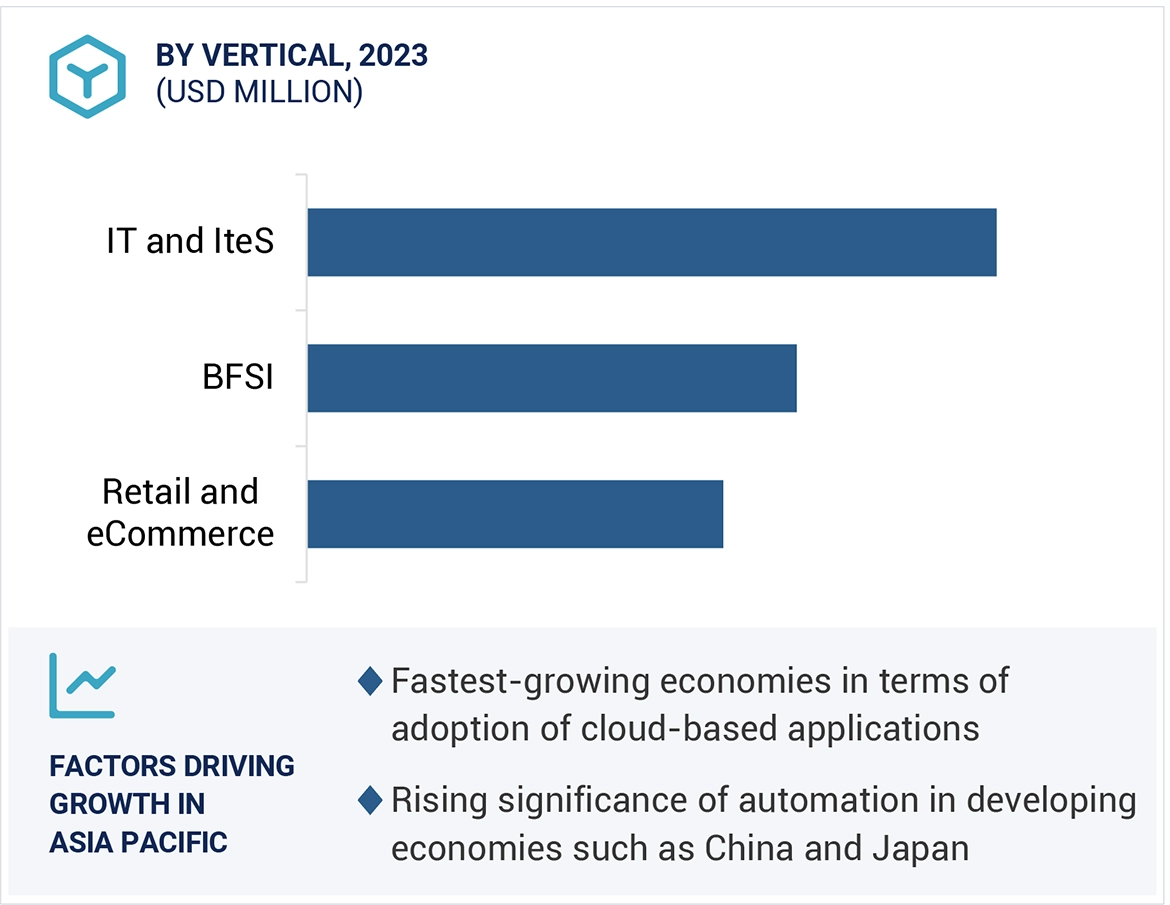


Growth opportunities and latent adjacency in Cloud Managed Network Market