This research study involved the substantial use of secondary sources, directories, and databases, such as D&B Hoovers, Bloomberg Businessweek, and Factiva, to identify and collect information on the Command and Control (C2) Systems Market. Primary sources included experts from core and related industries, suppliers, manufacturers, solution providers, technology developers, alliances, and organizations related to all segments of the industry’s value chain. All primary sources were interviewed to obtain and verify critical qualitative and quantitative information as well as assess prospects for the growth of the market during the forecast period.
Secondary Research
The market size of companies offering command and control systems was arrived at based on the secondary data available through paid and unpaid sources, as well as by analyzing the product portfolios of major companies and rating them based on their performance and quality.
In the secondary research process, various secondary sources were referred to identify and collect information for this study. These included government sources; corporate filings such as annual reports, press releases, and investor presentations; white papers, journals, and certified publications; and articles by recognized authors, directories, and databases.
Secondary research was mainly used to obtain key information about the industry’s value and supply chain and identify the key players by various products, market classifications, and segmentation according to their offerings and industry trends related to application, systems, solution, installation, and region, and key developments from both the market and technology-oriented perspectives.
Primary Research
In the primary research process, various primary sources from both the supply and demand sides were interviewed to obtain qualitative and quantitative information on the market. Primary sources from the supply side included various industry experts, such as vice presidents (VPs), directors from business development, marketing, product development/innovation teams, and related key executives from components vendors, command and control systems manufacturers, integrators, distributors, and key opinion leaders.
Primary interviews were conducted to gather insights such as market statistics, data on revenue collected from products, market breakdowns, market size estimations, market forecasting, and data triangulation. Primary research also helped me understand the various trends related to applications, solutions, systems, and regions. Stakeholders from the demand side, such as CIOs, CTOs, CSOs, and installation teams of customers/end users of command and control systems, were interviewed to understand the buyer’s perspective on suppliers, products, component providers, their current usage of command and control systems, and the outlook of their businesses.

To know about the assumptions considered for the study, download the pdf brochure
Market Size Estimation
Top-down and bottom-up approaches were used to estimate and validate the size of the Command and Control (C2) Systems Market. The research methodology used to estimate the size of the market includes the following details.
Key players in the Command and Control (C2) Systems Market were identified through secondary research, and their market share was determined through primary and secondary research. This included a study of the annual and financial reports of top market players and extensive interviews with leaders such as directors, engineers, marketing executives, and other stakeholders of leading companies operating in the Command and Control (C2) Systems Market.
All percentage shares, splits, and breakdowns were determined using secondary sources and verified through primary sources. All possible parameters that affect the markets covered in this research study were accounted for, viewed in extensive detail, verified through primary research, and analyzed to obtain the final quantitative and qualitative data on the Command and Control (C2) Systems Market. This data was consolidated, enhanced with detailed inputs, analyzed by MarketsandMarkets, and presented in this report.
Market Size Estimation Methodology: Bottom-Up Approach

Market Size Estimation Methodology: Top-Down Approach

Data Triangulation
After arriving at the overall market size from the market size estimation process, the total market was split into several segments and subsegments. Data triangulation and market breakdown procedures explained below were implemented, wherever applicable, to complete the overall market engineering process and arrive at the estimated market numbers for command and control systems segments and subsegments. The data was triangulated by studying various factors and trends from both the demand and supply sides. The market size was also validated using both top-down and bottom-up approaches.
Market Definition
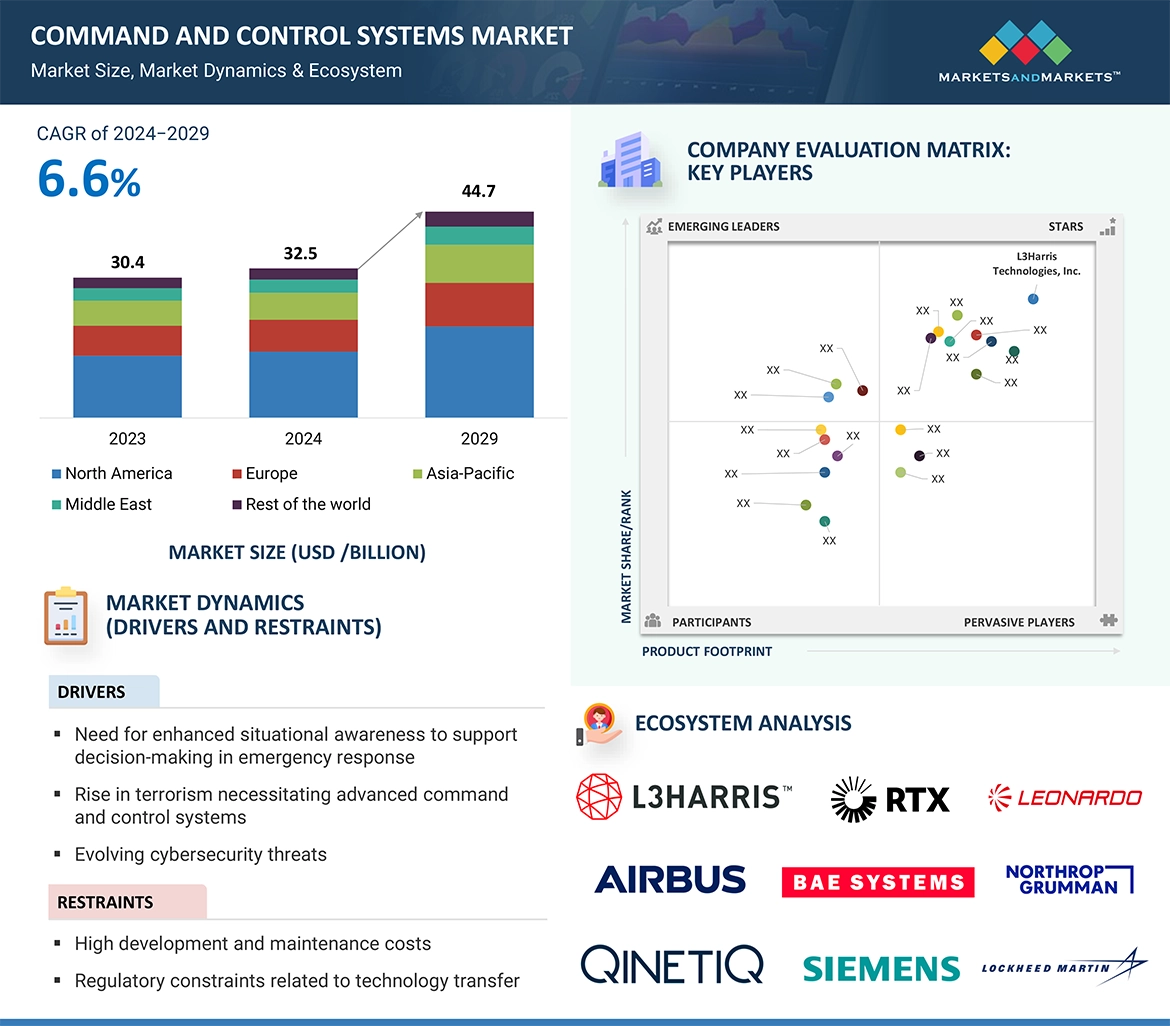
Command and control systems are frameworks or platforms that enable organizations, especially in military, emergency response, and large-scale operations, to manage and direct their resources effectively. These systems facilitate decision-making by providing real-time information, communication, and coordination capabilities. They integrate various data sources, such as sensors, communication networks, and databases, to give a comprehensive view of the operational environment. By streamlining information flow and enhancing situational awareness, command and control systems help leaders make informed decisions, deploy resources efficiently, and respond swiftly to dynamic situations.
Report Objectives
-
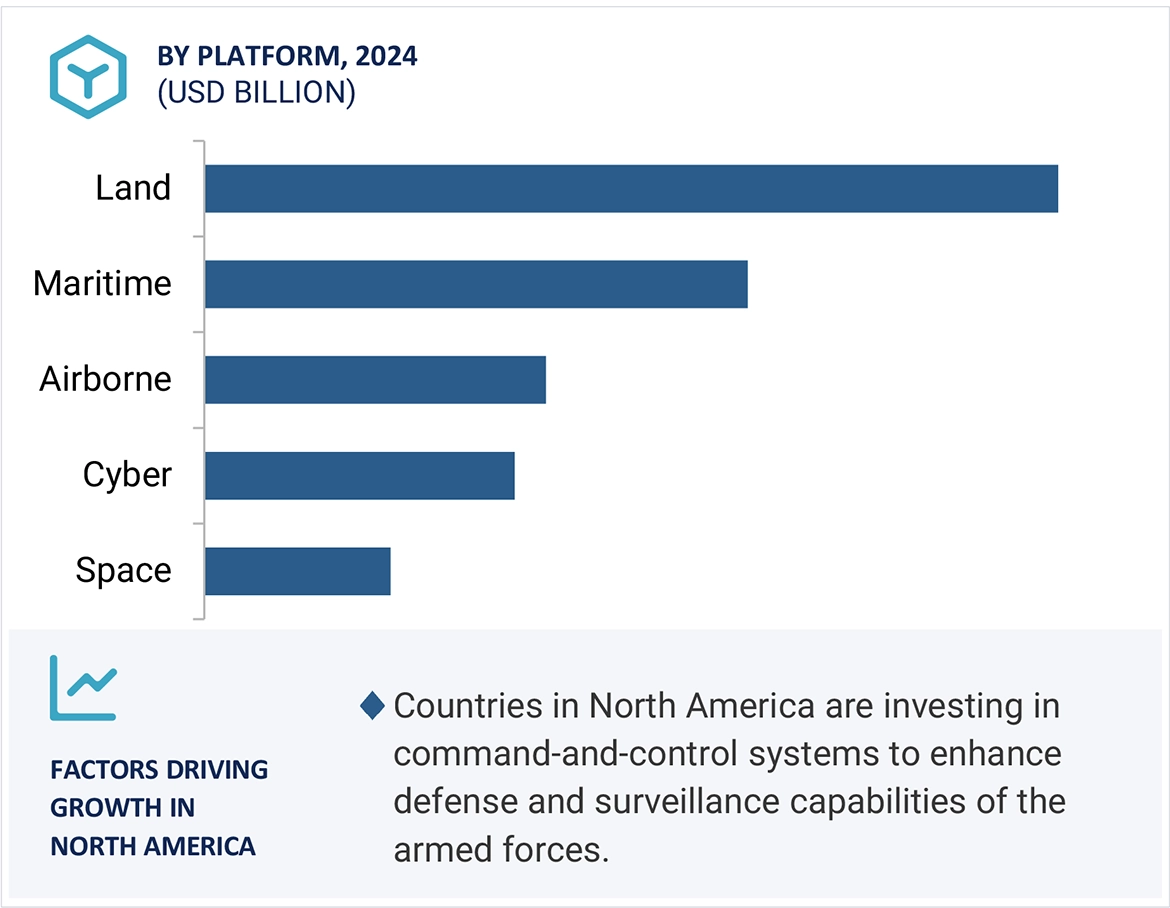
To define, describe, segment, and forecast the size of the Command and Control (C2) Systems Market based on platform, solution, system, application, installation, and region
-
To forecast the size of market segments with respect to five regions, namely North America, Europe, Asia Pacific, the Middle East, and the Rest of the World, along with major countries in each region
-
To identify and analyze key drivers, restraints, opportunities, and challenges influencing the market growth
-
To analyze micromarkets1 with respect to individual growth trends, prospects, and their contribution to the overall market
-
To analyze opportunities in the market for stakeholders by identifying key market trends
-
To profile key market players and comprehensively analyze their market shares and core competencies2
-
To identify detailed financial positions, key products, and unique selling points of leading companies in the market
-
To provide a detailed competitive landscape of the market, along with market share analysis, market ranking analysis, and revenue analysis of key players
-
To analyze the degree of competition in the market by identifying key growth strategies, such as product launches, contracts, agreements, and partnerships, adopted by leading market players
Available Customizations:
Along with the market data, MarketsandMarkets offers customizations as per the specific needs of companies. The following customization options are available for the report:
Product Analysis
-
Product matrix, which gives a detailed comparison of the product portfolio of each company
Regional Analysis
-
Further breakdown of the market segments at country-level
Company Information
-
Detailed analysis and profiling of additional market players (up to 5)


Hong
Oct, 2019
To build a business strategy for C2 systems, in APAC and Singapore, with a focus on the Singapore Government..