
Consumer Packaged Goods Market Size & Forecast

Consumer Packaged Goods Market by Product Type (Food & Beverages, Cosmetics & Personal Care Products, Household Care Products, Healthcare Products), Packaging Type (Rigid, Flexible), Packaging Material (Plastic, Metal, Paperboard, Glass), Distribution Channel (Supermarkets, Convenience Stores, E-commerce), and Region - Global Forecast to 2030


OVERVIEW
Source: Secondary Research, Interviews with Experts, MarketsandMarkets Analysis
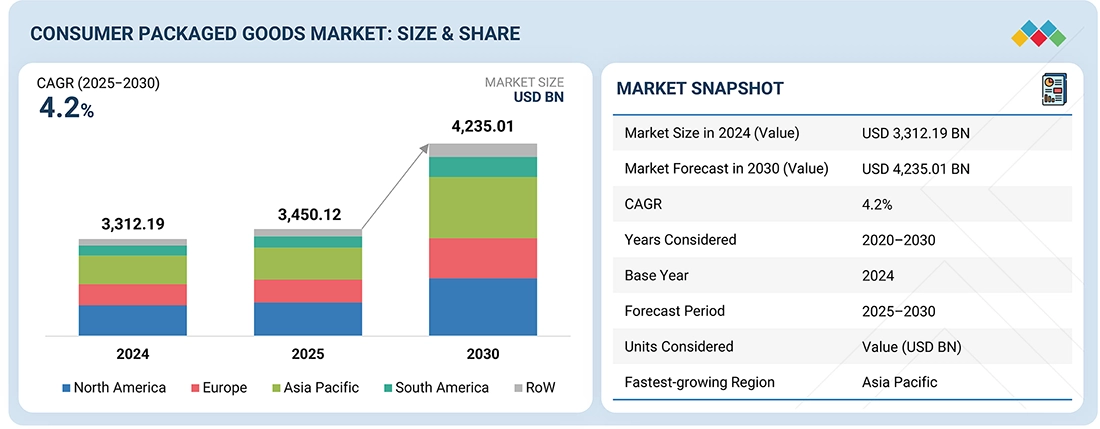
The consumer packaged goods market is expected to grow from USD 3,450.12 billion in 2025 to USD 4,235.01 billion by 2030, at a CAGR of 4.2%. Growth is driven by demand for convenience, sustainability, and personalization. Key factors include changing lifestyles, online sales, sustainable packaging, and premium products. Innovations like smart labeling and eco-friendly packaging improve safety, traceability, and shelf life while cutting waste. Technologies such as blockchain, AI demand forecasting, and IoT inventory management boost efficiency and cut costs through real-time monitoring. Environmentally friendly packaging is gaining popularity due to its green benefits, along with automation in transportation and manufacturing. The shift toward smart, customer-focused solutions is fueled by increased investment in e-commerce and sustainability.
Market Size and Forecast:
- Market Size Value in 2024: USD 3312.19 Billion
- Market Size Value in 2025: USD 3,450.12 Billion
- Revenue Forecast in 2030: USD 4,235.01 Billion
- Growth Rate: CAGR of 4.2% from 2025 to 2030
- Base year: 2024
- Forecast period: 2025–2030
- North America accounted for 33.8% of the packaging market in 2024.
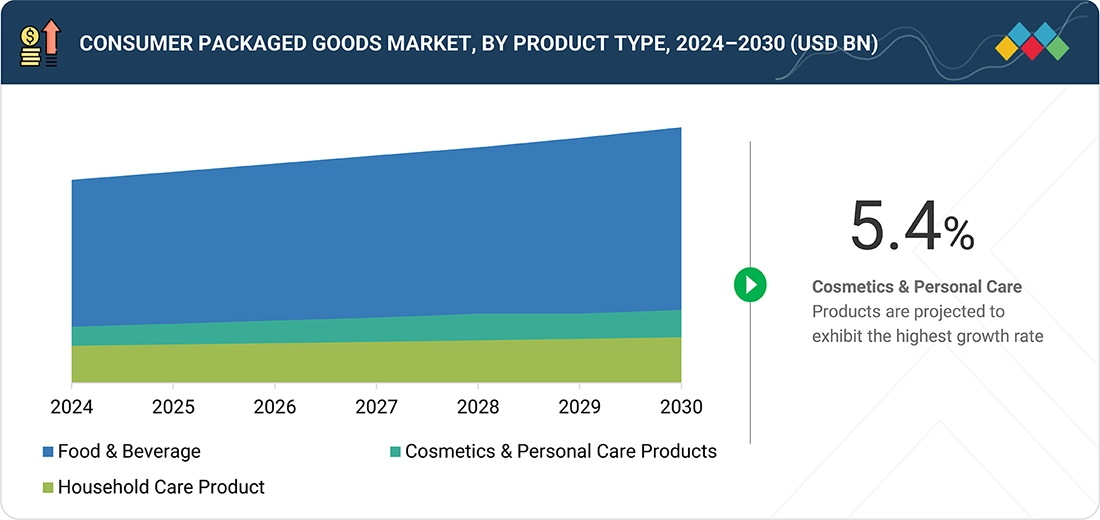
- The cosmetics & personal care packaging segment is expected to register the highest CAGR of 5.4% during 2025–2030.
Key Market Trends and Insights
- By Product Type: The Food & Beverages segment accounts for a significant share of the consumer packaged goods market, driven by rising consumer demand for convenient, ready-to-consume, and value-added food products across global markets.
- Consumer Trends:The market is witnessing increasing demand for premium, health-focused, sustainable, and personalized consumer packaged goods as purchasing preferences continue to evolve.
- Market Drivers:Growing urbanization, rising disposable incomes, changing lifestyles, expansion of modern retail channels, and increasing consumer spending on packaged products are supporting market growth.
- Future Prospects:Growth opportunities are emerging through digital commerce expansion, product innovation, sustainable packaging solutions, and the development of premium and functional consumer packaged goods.
KEY TAKEAWAYS
- North America accounted for 33.8% of the packaging market in 2024.
- The cosmetics & personal care packaging segment is expected to register the highest CAGR of 5.4% during 2025–2030.
- Bottles dominated the market in 2024, driven by extensive use across beverages, personal care, and household products.
- Paper & paperboard is the fastest-growing material category, supported by sustainability-focused packaging shifts.
- Rigid packaging held the highest market share of 62.19% in 2024 due to wide acceptance across end-use industries.
- Supermarkets and hypermarkets remain dominant channels, but e-commerce is expanding rapidly due to digital adoption and preference for online CPG purchases.
- Companies such as Grundfos Holding, KSB SE & Co. KGaA, Atlas Copco, GEA Group, and Fristam Pumps are positioned as leading players, supported by wide product portfolios and strong market penetration across industrial applications.
- Firms including Hammelmann GmbH, Rotech Pumps, Westcorp Pump, and amixon GmbH demonstrate strong innovation and emerging growth potential within niche pumping technologies and specialized application areas.
The global consumer packaged goods (CPG) market is undergoing significant transformation, shaped by evolving consumer behavior, technological advancements, and sustainability imperatives. Rising disposable incomes, urbanization, and shifting lifestyles are driving demand for convenient, branded packaged products across food, beverages, personal care, household, and healthcare categories. E-commerce adoption has accelerated, creating new growth avenues through digital platforms and direct-to-consumer models. Packaging innovations, particularly in flexible formats and sustainable materials such as recyclable paperboard and bio-based plastics, are increasingly important as governments enforce stricter environmental regulations. North America and Europe are mature markets, with growth driven by premiumization and sustainability, while Asia Pacific is emerging as the fastest-growing region due to expanding middle-class populations and rapid retail modernization. Competition remains fragmented, with global leaders like Nestlé, Unilever, Procter & Gamble, and Coca-Cola holding strong positions, while regional players and startups focus on affordability, local preferences, and eco-friendly solutions to gain traction.
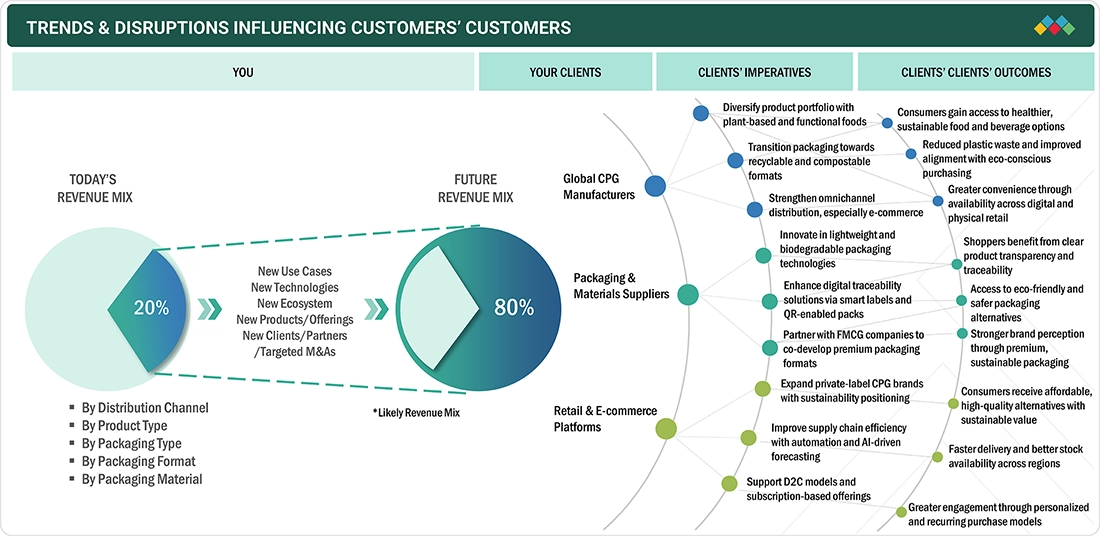
TRENDS & DISRUPTIONS IMPACTING CUSTOMERS' CUSTOMERS
The consumer packaged goods (CPG) market is being disrupted by a wave of transformative trends that are reshaping revenue sources and business priorities. Traditional drivers such as mass-market SKUs, legacy packaging, and retail-based distribution are losing ground to new, consumer-led models. Emerging disruptions include AI-driven demand forecasting, smart packaging with traceability, sustainable sourcing, and e-commerce fulfillment, which are redefining supply chains and consumer engagement. At the product level, plant-based and functional beverages, wellness-focused snacks, low-/no-sugar formulations, and eco-friendly personal care products are setting new standards for innovation. Meanwhile, refillable and reusable packaging formats are challenging single-use models. Looking further ahead, consumer demand for transparency and ethics, Gen Z’s preference for digital-first brands, growing acceptance of subscription-based models, and health and sustainability as primary purchase triggers are expected to dominate. Together, these disruptions mark a decisive shift toward personalization, sustainability, and digital integration across the CPG sector.
Source: Secondary Research, Interviews with Experts, MarketsandMarkets Analysis
MARKET DYNAMICS
Level
-
E-commerce expansion is fueling CPG growth by broadening consumer reach through online and omnichannel platforms

-
Growth and innovation through sustainability initiatives in the CPG industry

Level
-
High cost of sustainable materials

-
Impact of sustainability on product shelf life and quality

Level
-
Technology integration in the CPG industry

-
Growth in emerging markets

Level
-
Meeting growing sustainability demands in the CPG industry

-
Shifts in consumer behavior

Source: Secondary Research, Interviews with Experts, MarketsandMarkets Analysis
DRIVERS: E-commerce expansion is fueling CPG growth by broadening consumer reach through online and omnichannel platforms
E-commerce is vital in the CPG industry, transforming product delivery and marketing. The pandemic amplified this trend, which continues through 2024 and beyond. In 2022, global e-commerce sales reached USD 27 trillion across 43 major economies, over 75% of global GDP (UNCTAD 2023). Despite a slight dip in 2023 as consumers returned to stores, online sales remain strong due to their convenience, variety, and affordability, according to the International Trade Centre. Consumers now expect flexible services like home delivery and same-day options. Regions like South Africa and Southeast Asia see rapid growth, while advanced markets such as China, South Korea, and the UK have online sales accounting for 25-30% of retail, with the U.S. at around 15%. This digital shift offers long-term opportunities for CPG companies to engage with tech-savvy consumers worldwide.
RESTRAINTS: High cost of sustainable materials
The Consumer Packaged Goods sector faces major challenges in adopting sustainable materials due to their higher costs compared to conventional options. Eco-friendly materials like biodegradable plastics, recycled paper, and plant-based polymers tend to be more expensive to produce, posing difficulties for cost-sensitive industries. For instance, bioplastics are pricier than traditional plastics, discouraging widespread use. Several factors drive these costs, including the need for specialized machinery and technologies, which are costly investments. Ethical or fair trade raw materials, often more expensive, further increase expenses. Additionally, sustainable materials are still emerging and are produced in lower volumes, leading to higher per-unit costs. As demand and production grow, these costs are expected to decrease. Meanwhile, consumer packaged goods companies must weigh the economic impact of switching to sustainable packaging and explore ways to recover these costs, balancing environmental goals with profitability.
OPPORTUNITIES: Technology integration in the CPG industry
Innovation and efficiency in the consumer packaged goods sector depend on adopting technology, especially integrating operational technology (OT) and digital transformation (DT). This trend allows for real-time data sharing, improved decision-making, supply chain management, predictive maintenance, energy efficiency, and environmental friendliness. Using data insights reduces downtime, increases productivity, and improves equipment performance, supporting operational efficiency and sustainability while allowing growth without added costs. AI and ML drive this change by enabling personalized marketing, forecasting, and product development. For example, in December 2024, Colgate-Palmolive used digital channels and virtual testing to accelerate product development. AI also enhances inventory management through real-time monitoring, making processes more efficient and strengthening customer loyalty.
CHALLENGES: Shifts in consumer behavior
The post-pandemic era has reshaped the consumer packaged goods sector, bringing new challenges and opportunities. Consumers are more price-conscious, driven by inflation in 2022 and 2023, with 88% choosing store or generic brands and 44% opting for LendingTree. Omnichannel shopping is rising, blending online and offline experiences. Social media and influencers are increasingly influencing brand choices, pressuring companies to build loyalty while competing against private-label and digital-native brands that appeal to price-sensitive buyers. Additionally, social awareness and spending power have heightened consumer interest in health and sustainability. Over 80% value green products and seek healthier options like immunity foods, plant-based items, and eco-friendly personal care, according to a 2024 Purdue University study. To stay competitive, consumer goods firms must personalize marketing, ensure product accessibility online and offline, and adapt to these evolving values. Failure to do so risks losing market share to faster competitors.
Consumer Packaged Goods Market: COMMERCIAL USE CASES ACROSS INDUSTRIES
| COMPANY | USE CASE DESCRIPTION | BENEFITS |
|---|---|---|
 |
Implementing AI-driven demand forecasting and digital twins for food & beverages to match production with consumption patterns | Minimizes food waste, lowers supply chain costs, ensures product availability, improves forecasting accuracy |
 |
Deploying smart vending machines with IoT sensors for personalization (flavor-mix options, portion control) and digital engagement | Increased consumer engagement, better data capture, optimized inventory in vending networks |
 |
Integrating QR-enabled smart packaging to provide recycling instructions and authenticity checks for baby and feminine care products | Enhances consumer trust, ensures regulatory compliance, supports sustainability commitments |
 |
Investing in plant-based snacks and alternative protein beverages (e.g., Beyond Meat collaborations) to diversify portfolio | Access to health-conscious consumers, category diversification, premium pricing opportunities |
Logos and trademarks shown above are the property of their respective owners. Their use here is for informational and illustrative purposes only.
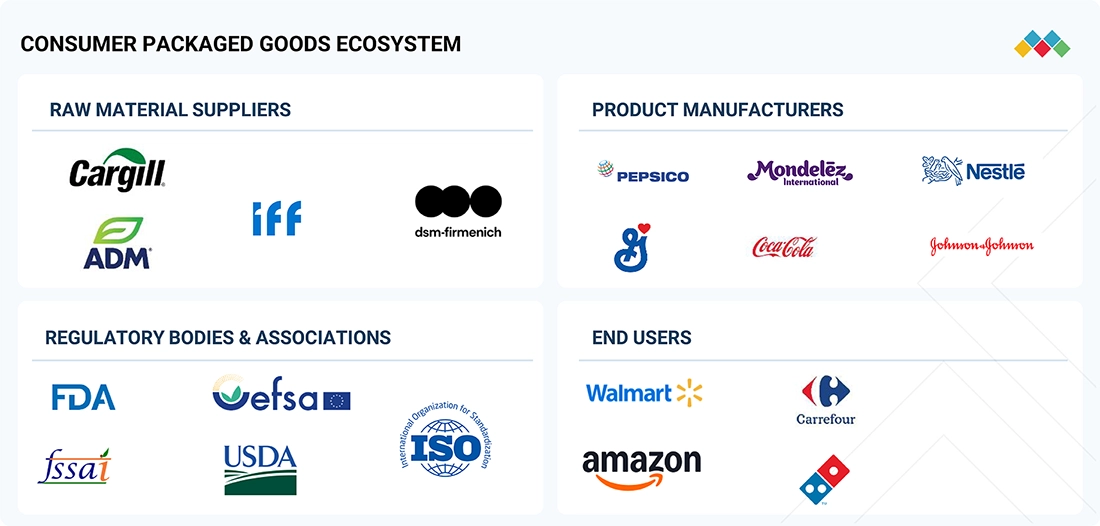
MARKET ECOSYSTEM
The consumer packaged goods (CPG) market operates within a highly interconnected ecosystem that spans raw material suppliers, manufacturers, packaging providers, regulatory authorities, and end users. On the supply side, raw material companies such as BASF, Cargill, and ADM ensure the steady provision of essential ingredients, while global CPG leaders like Nestlé, Coca-Cola, PepsiCo, and Mondelez transform these inputs into diverse food, beverage, and personal care products. Packaging and technology providers, including Amcor, Tetra Pak, and Huhtamaki, play a crucial role in driving sustainability, efficiency, and innovation across product delivery. The demand side is influenced heavily by regulatory bodies such as the FDA, FSSAI, EFSA, and USDA, which define safety and quality standards, and by global retail giants like Walmart, Amazon, Carrefour, and Domino’s, which distribute goods to consumers worldwide. This integrated value chain is increasingly shaped by sustainability goals, digital transformation, and evolving consumer preferences for convenience and transparency.
Logos and trademarks shown above are the property of their respective owners. Their use here is for informational and illustrative purposes only.
MARKET SEGMENTS
Source: Secondary Research, Interviews with Experts, MarketsandMarkets Analysis
CPG Market, By Distribution Channel
The CPG market is distributed through multiple channels, with supermarkets and hypermarkets continuing to dominate due to their wide product availability and competitive pricing. Convenience stores serve as essential outlets for quick-purchase items and impulse buys, particularly in urban areas. E-commerce has shown the fastest growth, driven by digital adoption, doorstep delivery, and subscription-based models, reshaping how consumers interact with packaged goods. Other channels, including local stores and specialty retailers, remain vital in emerging markets where modern retail penetration is still in its early stages of development.
CPG Market, By Product Type
Food and beverages remain the largest product category, fueled by rising consumption of packaged snacks, beverages, and ready-to-eat meals. Cosmetics and personal care products are experiencing strong growth with increasing consumer focus on wellness, beauty, and premium formulations. Household care products, including cleaning supplies and detergents, have gained traction due to heightened hygiene awareness post-pandemic. Health care products, such as OTC medicines and nutritional supplements, represent another expanding segment, supported by aging populations and preventive healthcare trends.
CPG Market, By Packaging Type
Bottles dominate in beverages and liquid personal care, offering convenience and branding opportunities. Cans are mainly used in carbonated drinks and processed foods, valued for durability and recyclability. Boxes serve a wide range of applications, from dry food packaging to personal care kits, while pouches have gained rapid adoption in snacks, pet food, and liquid concentrates due to their low weight and cost efficiency. Other packaging types, including tubes and trays, address niche applications in cosmetics, pharmaceuticals, and frozen food.
CPG Market, By Packaging Format
Rigid packaging remains critical in maintaining product integrity and shelf stability, particularly in beverages, dairy, and household care categories. Flexible packaging is the fastest-growing format, as it reduces material costs, enhances portability, and aligns with sustainability initiatives such as mono-material recyclable pouches. Other hybrid formats, including composite cartons and refill models, are emerging as sustainable alternatives and are expected to gain wider adoption across food and beverage categories.
CPG Market, By Packaging Material
Plastic continues to hold the largest share in packaging due to versatility and cost-effectiveness, though sustainability concerns are driving innovation in recyclable and bio-based plastics. Paper and paperboard are widely adopted in dry foods, bakery, and e-commerce deliveries, aligning with eco-friendly consumer preferences. Metal packaging is stable in beverages and canned foods, valued for durability and recyclability. Glass, though declining in share, remains relevant in premium beverages and cosmetics. Other materials, including compostable and plant-based options, are gaining traction in niche but growing applications.
REGION
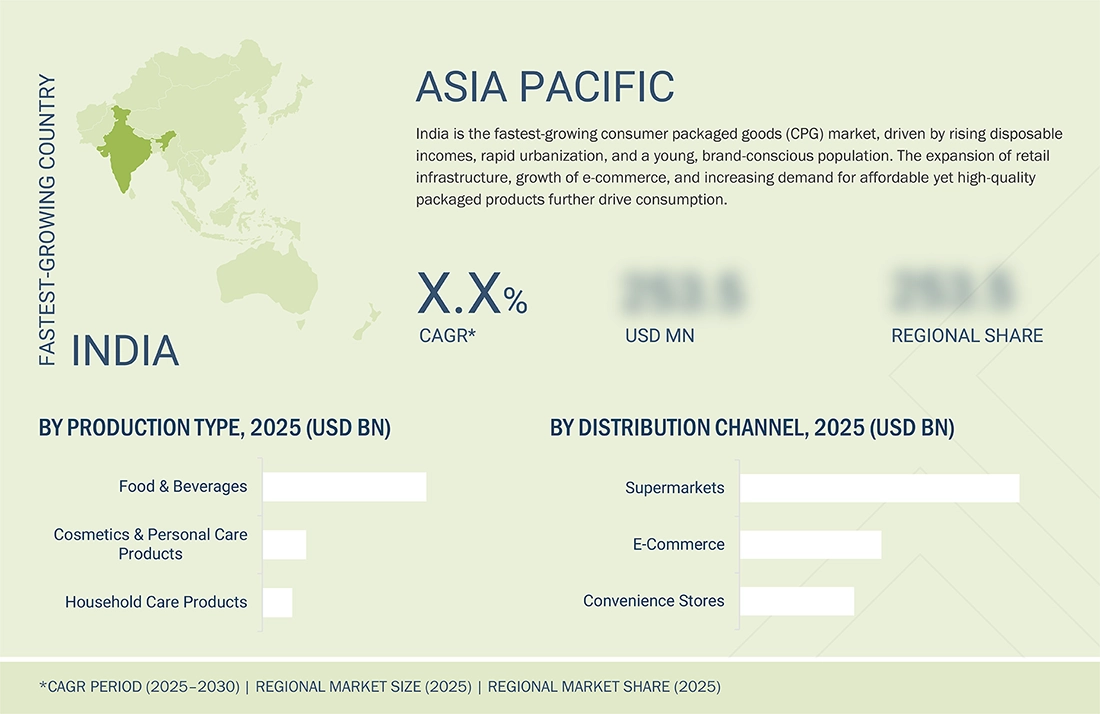
Asia Pacific to be the fastest growing region in the market during the forecast period
The global CPG packaging market reflects distinct regional dynamics. North America emphasizes premiumization, sustainability, and digital-first distribution models. Europe leads in regulatory-driven eco-innovation, with stringent recycling mandates shaping material choices. Asia-Pacific is the fastest-growing market, driven by urbanization, rising disposable incomes, and strong penetration of e-commerce platforms. South America is showing gradual expansion, supported by increasing middle-class consumption. Meanwhile, regions grouped under RoW are emerging as untapped opportunities, with growing demand for basic packaged goods and gradual improvements in retail and logistics infrastructure.
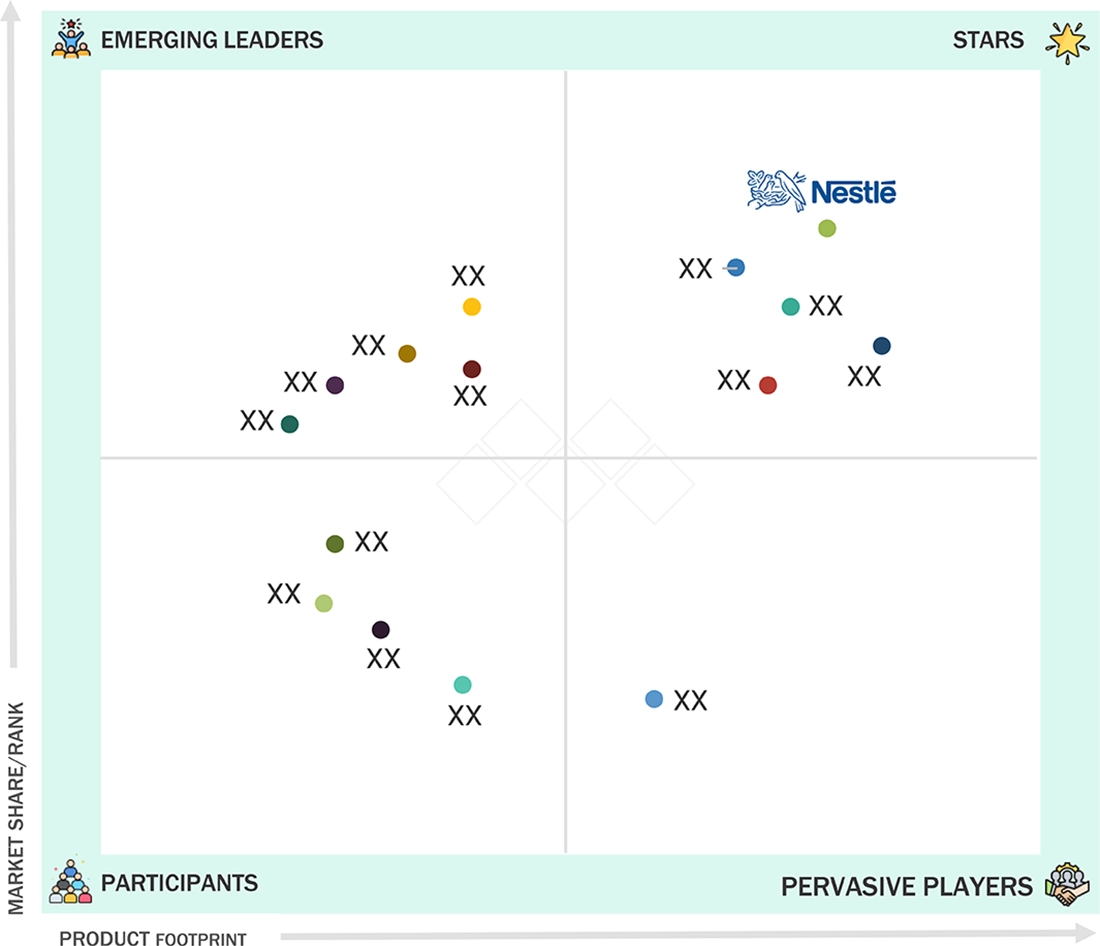
Consumer Packaged Goods Market: COMPANY EVALUATION MATRIX
Star Players in this market include Procter & Gamble, Nestlé, and Unilever, which maintain broad product portfolios, high market penetration, and consistent investments in innovation and sustainability. These firms leverage global supply chains, brand equity, and advanced digital engagement strategies to strengthen their competitive positioning. Emerging Leaders include fast-growing regional or niche companies such as Reckitt, Danone, or Mondelez International, which are expanding through targeted acquisitions, entry into new product categories, and a strong focus on health, wellness, and e-commerce distribution.
Source: Secondary Research, Interviews with Experts, MarketsandMarkets Analysis
KEY MARKET PLAYERS
MARKET SCOPE
| REPORT METRIC | DETAILS |
|---|---|
| Market Size in 2024 (Value) | USD 3,312.19 Billion |
| Market Forecast in 2030 (Value) | USD 4,235.01 Billion |
| Growth Rate | CAGR of 4.2% from 2025-2030 |
| Years Considered | 2020–2030 |
| Base Year | 2024 |
| Forecast Period | 2025–2030 |
| Units Considered | Value (USD Million/Billion) |
| Report Coverage | Revenue forecast, company ranking, competitive landscape, growth factors, and trends |
| Segments Covered |
|
| Regions Covered | North America, Europe, Asia Pacific, South America, and RoW |
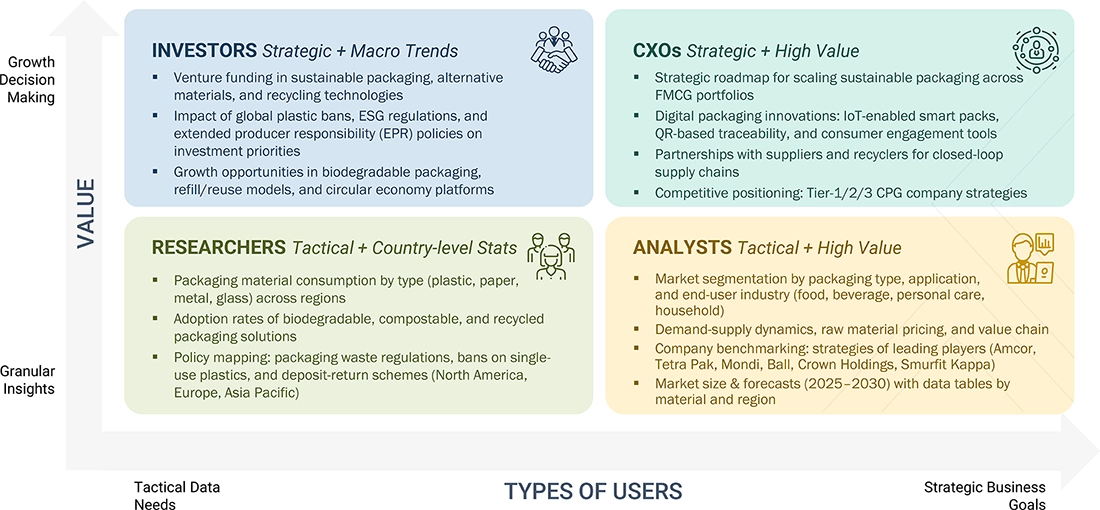
WHAT IS IN IT FOR YOU: Consumer Packaged Goods Market REPORT CONTENT GUIDE
DELIVERED CUSTOMIZATIONS
We have successfully delivered the following deep-dive customizations:
| CLIENT REQUEST | CUSTOMIZATION DELIVERED | VALUE ADDS |
|---|---|---|
| Regional Market Forecast with Packaging Material Split | The client sought clarity on the growth outlook of CPG markets in North America, Europe, and the Asia Pacific, with a specific split by packaging material (plastic, paperboard, metal, glass). We delivered a five-year forecast (2025–2030) showing regional CAGR, regulatory influences, and substitution trends for each packaging material. | Enabled the client to identify high-growth regions for sustainable packaging, align procurement with long-term demand, and pre-emptively adapt to upcoming regulations in Europe and Asia. |
| Competitive benchmarking of key players | The client wanted to understand how the rise of e-commerce was reshaping demand for packaging types. We delivered insights on how flexible packaging and lightweight materials are gaining share due to home-delivery models, while rigid packaging remains dominant in premium products. | Supported the client in refining distribution strategies, investing in e-commerce packaging innovation, and improving cost-efficiency in last-mile delivery models |
| Consumer behavior shifts in urban vs. rural markets | Modeled demand patterns across urban/rural regions, highlighting product preferences and packaging affordability | Assisted client in tailoring product portfolios for diverse demographic segments |
RECENT DEVELOPMENTS
- April 2025 : Unilever acquired Wild, a direct-to-consumer personal care brand known for refillable and plastic-free packaging solutions. This move strengthens Unilever’s focus on sustainability and premium categories, aligning with consumer demand for eco-friendly, digital-first brands. The acquisition highlights Unilever’s continued portfolio diversification strategy, positioning it as a leader in innovative and environmentally conscious personal care.
- September 2025 : Procter & Gamble partnered with Ohio State University to launch Spruce, its first lawn and garden product line. This collaboration marks P&G’s entry into an adjacent category, combining consumer insights with academic research to innovate outside its traditional scope. The launch underlines P&G’s commitment to diversification, leveraging partnerships to expand growth opportunities and build resilience beyond core consumer packaged goods.
- September 2025 : Procter & Gamble announced the expansion of its manufacturing facility in North St. Louis with an investment of USD 180 million. The project increases production capacity for core product lines while creating new local employment opportunities. This expansion demonstrates P&G’s strategy to strengthen domestic manufacturing, improve supply chain resilience, and support economic development in key operational regions within the United States.
Table of Contents
 Exclusive indicates content/data unique to MarketsandMarkets and not available with any competitors.
Methodology
The study involved two major approaches in estimating the current size of the CPG market. Exhaustive secondary research was done to collect information on the market, peer, and parent markets. The next step was to validate these findings, assumptions, and sizing with industry experts across the value chain through primary research. Both top-down and bottom-up approaches were employed to estimate the complete market size. After that, market breakdown and data triangulation were used to estimate the market size of segments and subsegments.
Secondary Research
This research study involved the extensive use of secondary sources—directories and databases such as Bloomberg Businessweek and Factiva—to identify and collect information useful for a technical, market-oriented, and commercial study of the market.
In the secondary research process, various sources, such as company annual reports, press releases, investor presentations, white papers, food journals, certified publications, articles from recognized authors, directories, and databases, were used to identify and collect information.
Secondary research was mainly used to obtain key information about the industry’s supply chain, the total pool of key players, and market classification and segmentation as per the industry trends to the bottom-most level, regional markets, and key developments from both market- and technology-oriented perspectives.
Primary Research
Extensive primary research was conducted after obtaining information regarding the CPG market scenario through secondary research. Several primary interviews were conducted with market experts from both the demand and supply sides across major countries of North America, Europe, Asia Pacific, South America, and the Rest of the World. Primary data was collected through questionnaires, emails, and telephonic interviews. The primary sources from the supply side included various industry experts, such as Chief X Officers (CXOs), Vice Presidents (VPs), Directors from business development, marketing, research, and development teams, and key opinion leaders. Primary interviews were conducted to gather insights such as market statistics, data on revenue collected from the products and services, market breakdowns, market size estimations, market forecasting, and data triangulation. Primary research also helped in understanding the various trends related to consumer packaged goods, product type, packaging type, distribution channel, packaging material, and region. Stakeholders from the demand side, such as research institutions and universities, third-party vendors, were interviewed to understand the buyer’s perspective on the product, and their current usage of consumer packaged goods and the outlook of their business, which will affect the overall market.

Note: The three tiers of the companies are defined based on their total revenues in 2023 or 2024,
as per the availability of financial data: Tier 1: Revenue > USD 1 billion; Tier 2: USD 100
million ≤ Revenue ≤ USD 1 billion; Tier 3: Revenue < USD 100 million.
To know about the assumptions considered for the study, download the pdf brochure
|
COMPANY NAME |
DESIGNATION |
|
Procter & Gamble (US) |
R&D expert |
|
Unilever (UK) |
Sales Manager |
|
Nestlé (Switzerland) |
Manager |
|
Danone (France) |
Sales Manager |
|
The Coca-Cola Company (US) |
Marketing Manager |
Market Size Estimation
Both the top-down and bottom-up approaches were used to estimate and validate the total size of the consumer packaged goods market. These approaches were also used extensively to determine the size of various subsegments in the market. The research methodology used to estimate the market size includes the following details:
- The key players in the industry and the overall markets were identified through extensive secondary research.
- All shares, splits, and breakdowns were determined using secondary sources and verified through primary sources.
- All possible parameters that affect the market covered in this research study were accounted for, viewed in extensive detail, verified through primary research, and analyzed to obtain final quantitative and qualitative data.
- The research included the study of reports, reviews, and newsletters of top market players, along with extensive interviews for opinions from leaders, such as CEOs, directors, and marketing executives.
Consumer Packaged Goods Market : Top-Down and Bottom-Up Approach

Data Triangulation
After arriving at the overall market size from the estimation process explained above, the total market was split into several segments and subsegments. The data triangulation and market breakdown procedures were employed, wherever applicable, to estimate the overall CPG market and arrive at the exact statistics for all segments and subsegments. The data was triangulated by studying various factors and trends from the demand and supply sides. The market size was also validated using both the top-down and bottom-up approaches.
Market Definition
Consumer Packaged Goods (CPG) are products that consumers use on a daily or frequent basis and that are consumed quickly, requiring regular repurchase. These goods are typically low-cost, non-durable items packaged for retail sale, including categories such as food and beverages, personal care products, cosmetics, cleaning supplies, and household items.
Stakeholders
- Raw Material Suppliers – Providers of essential ingredients and inputs required for the production and processing of consumer goods, including food, beverages, personal care products, and more.
- Manufacturers & Processors – Companies that transform raw materials into finished or semi-finished products through various production and processing techniques.
- Contract Manufacturers & Co-packers – Third-party firms that produce, assemble, or package products on behalf of brand owners, enabling scalability and efficiency in production.
- Packaging & Labeling Companies – Businesses that design and supply packaging materials and labeling solutions to ensure product safety, branding, and regulatory compliance.
- Logistics & Supply Chain Partners – Organizations responsible for the transportation, warehousing, and distribution of products across the supply chain to ensure timely delivery and inventory management.
- Distributors & Wholesalers – Entities that purchase goods in bulk from manufacturers and sell them to retailers or other businesses within the supply chain.
- Retailers – Businesses that sell finished products directly to consumers through physical stores or online platforms.
- Marketing & Advertising Agencies – Firms that develop and implement promotional strategies, brand campaigns, and market research to boost product visibility and consumer engagement.
- Regulatory Bodies & Certification Agencies – Organizations that establish and enforce standards for safety, quality, and compliance, and issue necessary certifications for market entry (e.g., FDA, USDA, ISO).
- Consumers – End-users who purchase and use products, influencing market trends and demand through preferences, feedback, and purchasing behavior.
- Investors & Financial Stakeholders – Individuals or institutions that provide funding and financial support to companies across the value chain in exchange for returns or equity.
- Technology Providers – Companies offering digital tools, automation solutions, data analytics, and software platforms to improve operational efficiency and innovation.
- Sustainability & ESG Stakeholders – Entities focused on environmental, social, and governance (ESG) criteria, driving sustainable practices, ethical sourcing, and responsible business conduct throughout the value chain.
Report Objectives
- To determine and project the size of the CPG market with respect to the product type, packaging type, distribution channel, packaging material, and regions in terms of value over five years, ranging from 2025 to 2030
- To identify the attractive opportunities in the market by determining the largest and fastest-growing segments across regions
- To provide detailed information about the key factors influencing market growth (drivers, restraints, opportunities, and challenges)
- To analyze the opportunities in the market for stakeholders and provide details of the competitive landscape for market leaders
- To analyze the micro-markets with respect to individual growth trends, prospects, and their contribution to the total market
- To identify and profile the key players in the CPG market
- To understand the competitive landscape and identify the major growth strategies adopted by players across the key regions
Available Customizations
With the given market data, MarketsandMarkets offers customizations according to company-specific scientific needs.
The following customization options are available for the report:
Product Analysis
- Service Matrix, which gives a detailed comparison of the service portfolio of each company.
Geographic Analysis as per Feasibility
With the given market data, MarketsandMarkets offers customizations according to company-specific scientific needs.
- Further breakdown of the Rest of European consumer packaged goods market into key countries.
- Further breakdown of the Rest of Asia Pacific consumer packaged goods market into key countries.
- Further breakdown of the Rest of South American consumer packaged goods market into key countries.
Company Information
- Detailed analyses and profiling of additional market players (up to five)
Key Questions Addressed by the Report
What is the expected CAGR of the global CPG market?
The global consumer packaged goods market is expected to grow at a CAGR of 4.2% from 2025 to 2030.
What is consumer packaged goods market?
Consumer packaged goods (CPG) market refers to the strategies and tactics used to promote products that are used frequently, purchased often, and replaced regularly—such as snacks, toiletries, cleaning products, and beverages. The goal of CPG marketing is to build brand loyalty, boost shelf visibility (both in stores and online), and drive repeat purchases through advertising, promotions, packaging, and digital engagement.
What are the key trends in the consumer packaged goods industry?
The CPG industry is experiencing several major trends, including a growing demand for sustainable packaging, increased consumer focus on health and wellness, the rise of direct-to-consumer brands, and greater use of data and AI for marketing and supply chain optimization.
What challenges does the consumer packaged goods market face?
Companies in the CPG market face several challenges including supply chain disruptions, inflation and rising input costs, changing consumer expectations, environmental concerns, and intense competition both online and offline.
How is technology impacting the consumer packaged goods industry?
Technology is reshaping the CPG industry by enabling real-time data tracking, smarter inventory management, AI-powered marketing, and enhanced product personalization. It is also helping companies become more agile and responsive to consumer demand.
What role does e-commerce play in the consumer packaged goods market?
E-commerce is transforming how CPG products are marketed and sold. Online platforms allow brands to reach consumers directly, offer personalized shopping experiences, and collect valuable data on buying behavior, making it a critical growth channel for the industry.
What is the current size of the consumer packaged goods market?
The consumer packaged goods market is estimated to be USD 3,312.19 billion in 2025 and is projected to reach USD 4,235.01 billion by 2030, registering a CAGR of 4.2% during the forecast period.
Which are the key players in the market, and how intense is the competition?
Procter & Gamble (US), Unilever (UK), Nestlé (Switzerland), The Coca-Cola Company (US), and Danone (France) are some of the key market players.
Which region is projected to account for the largest share of the consumer packaged goods market?
In North America, the consumer packaged goods industry is experiencing stable growth. Busy lifestyles are pushing consumers toward ready-to-eat meals, pre-cut vegetables, and packaged snacks. This convenience factor is a major growth drive in both urban and suburban areas.
What kind of information is provided in the company profiles section?
The company profiles provided deliver crucial details, including a thorough business summary that covers different segments, financial results, geographic presence, revenue distribution, and business revenue breakdown. They also offer insights into product lines, key achievements, and expert analyst opinions to better illustrate the company's potential.
What are the factors driving the consumer packaged goods market?
Consumers are increasingly choosing products that support healthy lifestyles, such as low-calorie, organic, and plant-based goods. This shift is influencing product innovation across food, beverage, and personal care segments.
What is driving the growth of the consumer packaged goods (CPG) market?
The CPG market is being driven by rising consumer demand for convenient, health-conscious, and sustainable products, along with rapid e-commerce expansion and digital retail innovations.
Need a Tailored Report?
Customize this report to your needs
Get 10% FREE Customization
Customize This ReportPersonalize This Research
- Triangulate with your Own Data
- Get Data as per your Format and Definition
- Gain a Deeper Dive on a Specific Application, Geography, Customer or Competitor
- Any level of Personalization
Let Us Help You
- What are the Known and Unknown Adjacencies Impacting the Consumer Packaged Goods Market
- What will your New Revenue Sources be?
- Who will be your Top Customer; what will make them switch?
- Defend your Market Share or Win Competitors
- Get a Scorecard for Target Partners

Custom Market Research Services
We Will Customise The Research For You, In Case The Report Listed Above Does Not Meet With Your Requirements
Get 10% Free CustomisationTESTIMONIALS

Business Innovation Director
US Based Leading Agribusiness,
Food and Ingredients ManufacturerI highly appreciate the team's efficiency for a well conducted study that helped us clarify some blind spots in food and agricultural niche markets. Although compiling information for B2B markets is very difficult, the MnM team pulled out the task successfully. The quality of research, level of insights, and responsiveness of team were commendable.


Growth opportunities and latent adjacency in Consumer Packaged Goods Market