
Containerized Battery Energy Storage System (BESS) Market Size, Share & Trends

Containerized Battery Energy Storage System (BESS) Market Size, Share, Growth & Trends by Battery Type (Lithium-ion, Advanced Lead-acid, Sodium-based Batteries), Capacity (<1,000 kWh, 1,000-5,000 kWh, >5,000 kWh), Container Size (10 Feet, 20 Feet, 40 Feet) - Global Forecast to 2030


CONTAINERIZED BESS MARKET SIZE, SHARE & TRENDS
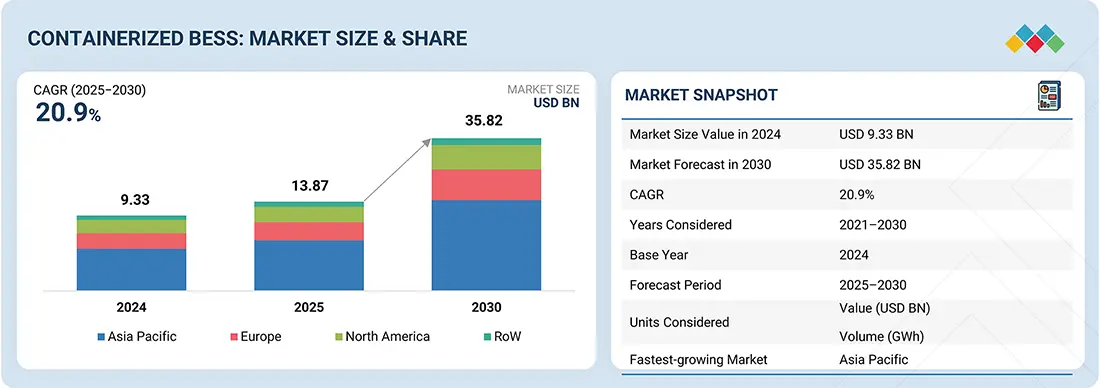
According to Marketsandmarkets, the global containerized BESS market size was valued at USD 13.87 billion in 2025 and is projected to reach USD 35.82 billion by 2030, growing at a CAGR of 20.9% from 2025 to 2030.This robust growth is fueled by the increasing integration of renewable energy sources, the rising demand for grid flexibility, and the need for reliable backup power across residential, commercial, and utility sectors. As global focus intensifies on decarbonization, grid modernization, and electrification, containerized BESS is emerging as a key enabler of the clean energy transition. Supportive policies, renewable integration mandates, and large-scale utility investments are expected to sustain market momentum through the decade's end.
MARKET SNAPSHOT TABLE
| REPORT METRIC | DETAILS |
|---|---|
| Market Size in 2025 (Value) | USD 13.87 Billion |
| Market Forecast in 2030 (Value) | USD 35.82 Billion |
| Growth Rate | CAGR of 20.9% from 2025–2030 |
| Years Considered | 2021–2030 |
| Base Year | 2024 |
| Forecast Period | 2025–2030 |
| Units Considered | Value (USD Million/Billion) and Volume (In GWh) |
| Report Coverage | Revenue Forecast, Company Ranking, Competitive Landscape, Growth Factors, and Trends |
| Top Companies |
|
| Growth Drivers |
|
| Segments Covered |
|
| Regional Scope | North America, Europe, Asia Pacific, Middle East, South America, and Africa |
Market Size & Forecast
KEY TAKEAWAYS
- Asia Pacific dominated the market with a 52.9% market share in 2024.
- The lithium-ion battery type segment is expected to hold the largest market share in 2030.
- Medium-capacity systems (1,000–5,000 kWh) are anticipated to gain the largest market size during the forecast period.
- Modular 20-feet containers are expected to grow with the highest CAGR of 23.1% during the forecast period.
- Commercial & Industrial applications to grow with the fastest CAGR of 22.1%.
- Tesla, BYD, and Contemporary Amperex Technology Co., Limited,were identified as Star players in the Containerized BESS market, as they have focused on innovation and have broad industry coverage, and strong operational & financial strength.
- Alpha ESS, TLS Offshore Containers, and Shanghai OE Industrial have distinguished themselves among startups and SMEs due to their strong product portfolio and business strategy
The containerized BESS industry is poised for robust growth, due to the rising demand for grid-scale energy storage, renewable integration, and commercial & industrial energy management. Lithium-ion batteries dominate, supported by modular container designs for scalable deployment across residential, commercial, and utility applications. Asia Pacific is the fastest-growing region, fueled by industrialization, government incentives, and large renewable projects. Declining battery costs, technological advancements, and a focus on sustainability and energy resilience also support the adoption of containerized BESS.
Source: Secondary Research, Interviews with Experts, MarketsandMarkets Analysis
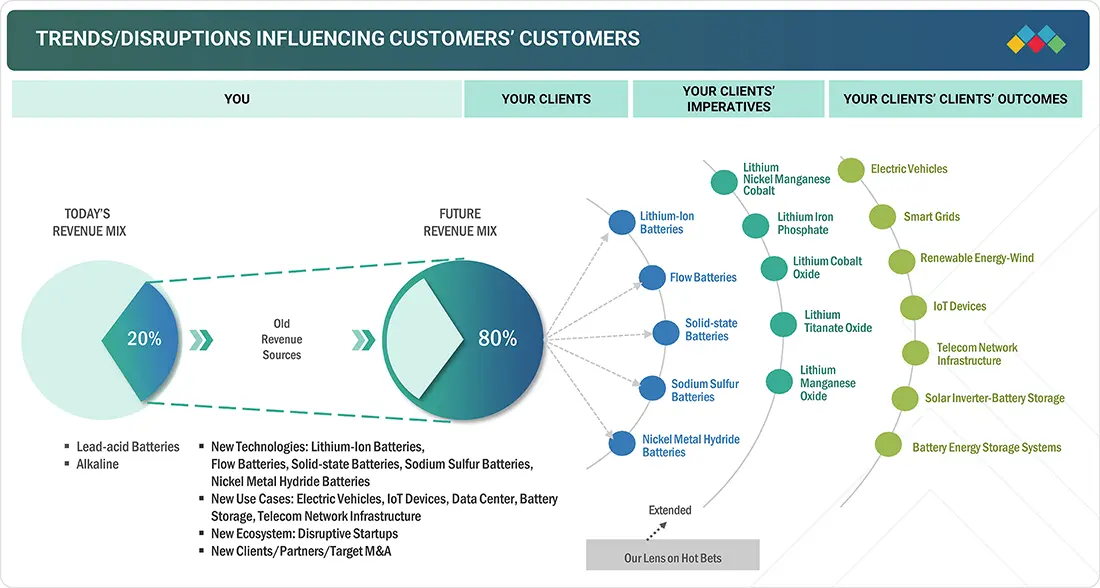
TRENDS & DISRUPTIONS IMPACTING CUSTOMERS' CUSTOMERS
The containerized BESS market size is growing rapidly, driven by increasing demand for flexible and scalable storage solutions amid ongoing grid modernization, the global shift toward low-carbon energy, and the rising use of lithium-ion batteries in renewable integration. Continued innovation in battery technologies and system integration is expected to open new revenue streams, especially in emerging markets and fast-developing energy ecosystems.
Source: Secondary Research, Interviews with Experts, MarketsandMarkets Analysis
CONTAINERIZED BESS MARKET DYNAMICS
Level
-
Growing emphasis on renewable energy generation

-
Increasing global investment in the innovation of grid infrastructure

Level
-
High initial investment costs

Level
-
Rising demand for off-grid and remote energy solutions

-
Expansion of EV charging infrastructure and urban grid support

Level
-
Complex system integration and site-specific requirements

-
Battery degradation, safety risks, and thermal management challenges

Source: Secondary Research, Interviews with Experts, MarketsandMarkets Analysis
Driver: Growing emphasis on renewable energy generation
The world is accelerating its energy transition, driven by ambitious decarbonization targets, rising renewable energy integration, and the imperative to mitigate climate change. As solar, wind, and other renewables grow fast, their variable and intermittent nature poses tremendous challenges to the grid's stability and energy reliability. Containerized BESS are becoming a key facilitator of the new energy infrastructure. These pre-engineered, modular solutions support rapid deployment, scalability, and cost-effective installation, making them extremely appealing to a range of grid-scale and behind-the-meter applications.
Restraint: High initial investment costs
One of the primary restraints hindering the growth of the containerized BESS market share is the high upfront capital investment required for deployment. While lithium-ion batteries, the core component of most energy storage systems, have declined significantly over the past decade, the total system cost for containerized solutions remains relatively high. This is because a containerized ESS includes the battery packs and power conversion systems (inverters), battery management systems (BMS), thermal management units (cooling or heating), fire suppression systems, and container housing, all of which contribute to a high capital expenditure (CAPEX).
Opportunity: Expansion of EV charging infrastructure and urban grid support
Containerized BESS offers a highly adaptable and modular solution to mitigate the grid stress challenges. By storing electricity during off-peak hours or from on-site renewable sources, such as rooftop solar, containerized systems, can deliver energy during peak demand periods at EV charging stations, effectively balancing loads and avoiding spikes that could otherwise overload distribution networks. This helps reduce the operational burden on utilities and enables EV charging operators to manage electricity costs more efficiently through peak shaving and time-of-use optimization.
Challenge: Battery degradation, safety risks, and thermal management challenges
Containerized BESS offers a highly adaptable and modular solution to mitigate these grid stress challenges. By storing electricity during off-peak hours or from on-site renewable sources, such as rooftop solar, containerized systems can deliver energy during peak demand periods at EV charging stations, effectively balancing loads and avoiding spikes that could otherwise overload distribution networks. This helps reduce the operational burden on utilities and enables EV charging operators to manage electricity costs more efficiently through peak shaving and time-of-use optimization.
Containerized Battery Energy Storage System (BESS) Market: COMMERCIAL USE CASES ACROSS INDUSTRIES
| COMPANY | USE CASE DESCRIPTION | BENEFITS |
|---|---|---|
 |
Megapack containerized BESS for utility-scale renewable integration and grid balancing | High-capacity energy storage | Fast deployment | Modular scalability | Grid stability |
 |
Blade battery-based containerized BESS for commercial and industrial energy management | Enhanced safety | Long lifecycle | Space optimization | Reliable power supply |
 |
Lithium-ion and sodium-ion containerized BESS for large-scale energy storage and microgrid solutions | High energy density | Cost-efficient | Adaptable to wide temperature ranges | Faster charging |
 |
Integrated containerized BESS with smart monitoring for commercial buildings and industrial sites | Improved energy efficiency | Predictive maintenance | Operational cost savings |
 |
Modular containerized BESS for commercial, industrial, and utility backup applications | Reliable power supply | Grid support | Easy scalability | Reduced operational downtime |
Logos and trademarks shown above are the property of their respective owners. Their use here is for informational and illustrative purposes only.
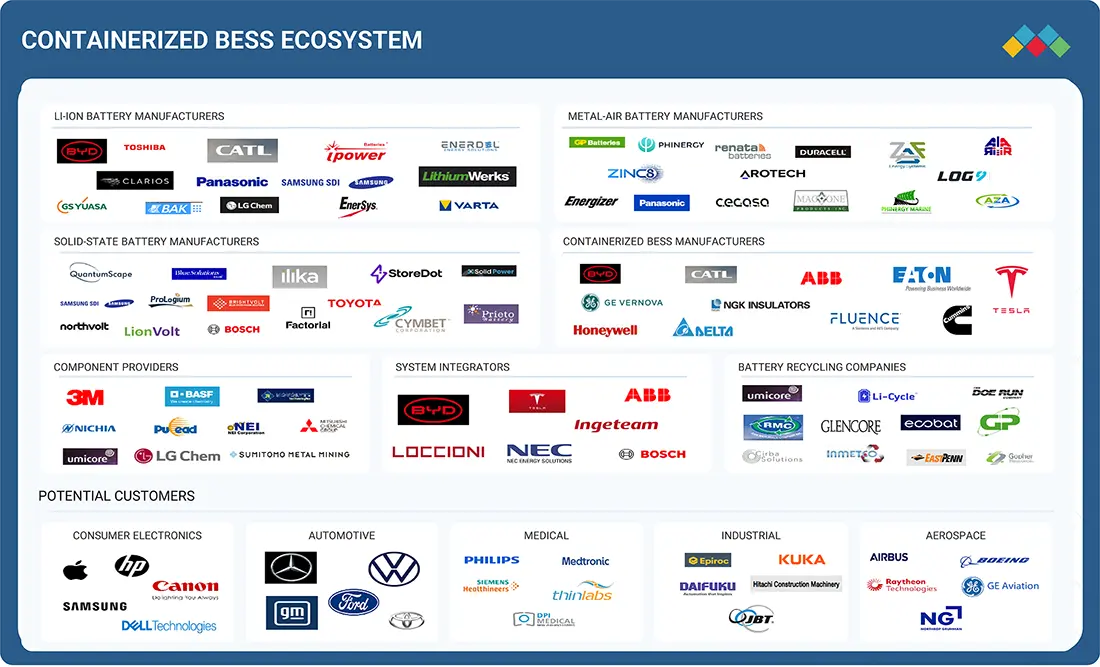
CONTAINERIZED BESS MARKET ECOSYSTEM
The high power and energy density requirements have led to a rise in demand for reliable and safe battery use in different industries. The advent of electric vehicles, renewable energy storage systems, and consumer electronics has been driving investments in the field of batteries, from incumbents and new players. With the rise in the adoption of electronic devices, the demand for containerized BESS has also grown significantly. There are several participants in the ecosystem of batteries, and each participant has a specific and vital role. Participants include Li-on battery manufacturers, metal-air battery manufacturers, solid-state battery manufacturers, containerized BESS manufacturers, component providers, system integrators, and battery recycling companies.
Logos and trademarks shown above are the property of their respective owners. Their use here is for informational and illustrative purposes only.
CONTAINERIZED BESS MARKET SEGMENTS
Source: Secondary Research, Interviews with Experts, MarketsandMarkets Analysis
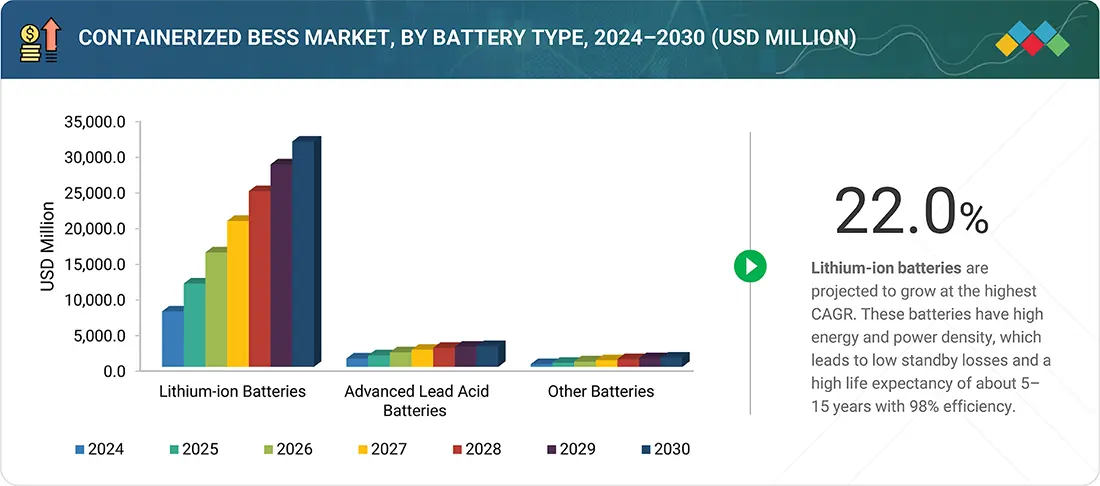
Containerized BESS Market Trends, By Battery Type
Lithium-ion batteries are projected to capture the largest market share due to their excellent performance attributes, high technological maturity, and widespread market penetration across a broad array of applications. Their high energy density, long cycle life, quick response time, and low maintenance requirements make them highly adaptable to short-duration and medium-duration storage applications, spanning peak shaving and frequency regulation to renewable energy integration and grid stabilization.
Containerized BESS Market, By Capacity
The 1,000–5,000 kWh capacity segment is estimated to capture the largest share of the containerized BESS market growth, driven by its optimal balance between energy capacity, cost-efficiency, and operational flexibility. This range is ideally suited for various commercial, industrial, and utility applications, including peak shaving, load shifting, backup power, and renewable energy integration. Containerized BESS units in this capacity range are often deployed in 20-foot and 40-foot containers, offering modularity, scalability, and ease of transportation.
Containerized BESS Market, By Container Size
20-foot containerized BESS units are expected to capture the largest market share, owing to their ideal balance between storage capacity, mobility, and ease of deployment. These containers offer a mid-size, modular format highly favored across various applications, from commercial and industrial (C&I) installations to utility-scale grid support, providing flexibility without the logistical challenges of larger units. The 20-foot size offers superior space-to-capacity efficiency while complying with global shipping and transport standards.
Containerized BESS Market, By Application
The commercial and industrial (C&I) segment is the most likely to experience the highest growth in the containerized BESS market due to the rising energy costs, business continuity, and business sustainability needs. Multiple categories of C&I buildings, including corporate campuses, data centers, manufacturing facilities, hospitals, municipalities, and schools, are rapidly adopting containerized BESS to maximize energy usage, reduce peak demand charges, and ensure power continuity during power outages.
CONTAINERIZED BESS MARKET BY REGION
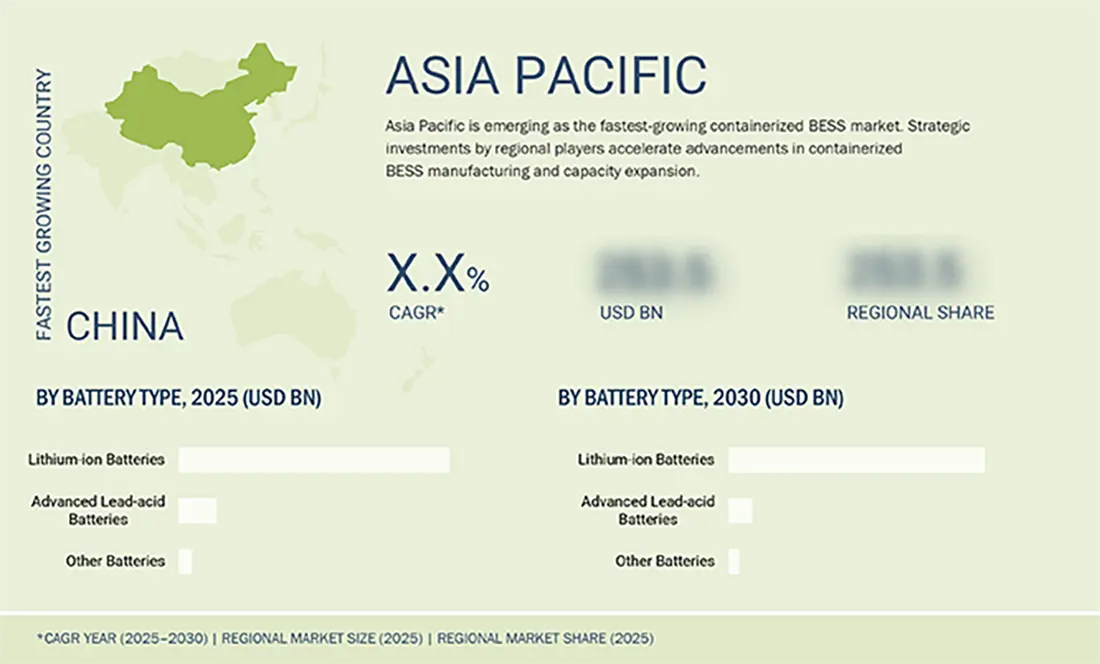
During the forecast period, Asia is expected to be the fastest-growing region in the global containerized BESS market share
Asia Pacific is expected to register the highest CAGR in the containerized BESS market share based on its status as the global battery manufacturing hub, rapid industrialization, and government support in clean energy transformation. China, South Korea, Japan, and India are leaders in battery manufacturing with key players, such as CATL, BYD, LG Energy Solution, and Samsung SDI, which provide strong supply chains, cost savings, and technology innovation for containerized BESS solutions.
Containerized Battery Energy Storage System (BESS) Market: COMPANY EVALUATION MATRIX
In the containerized BESS market matrix, Tesla (Star) leads with a strong global presence and a comprehensive portfolio of containerized BESS spanning various applications, including commercial, industrial, and utilities. GE Vernova (Emerging Leader) is gaining momentum with its new and improved containerized BESS solutions.
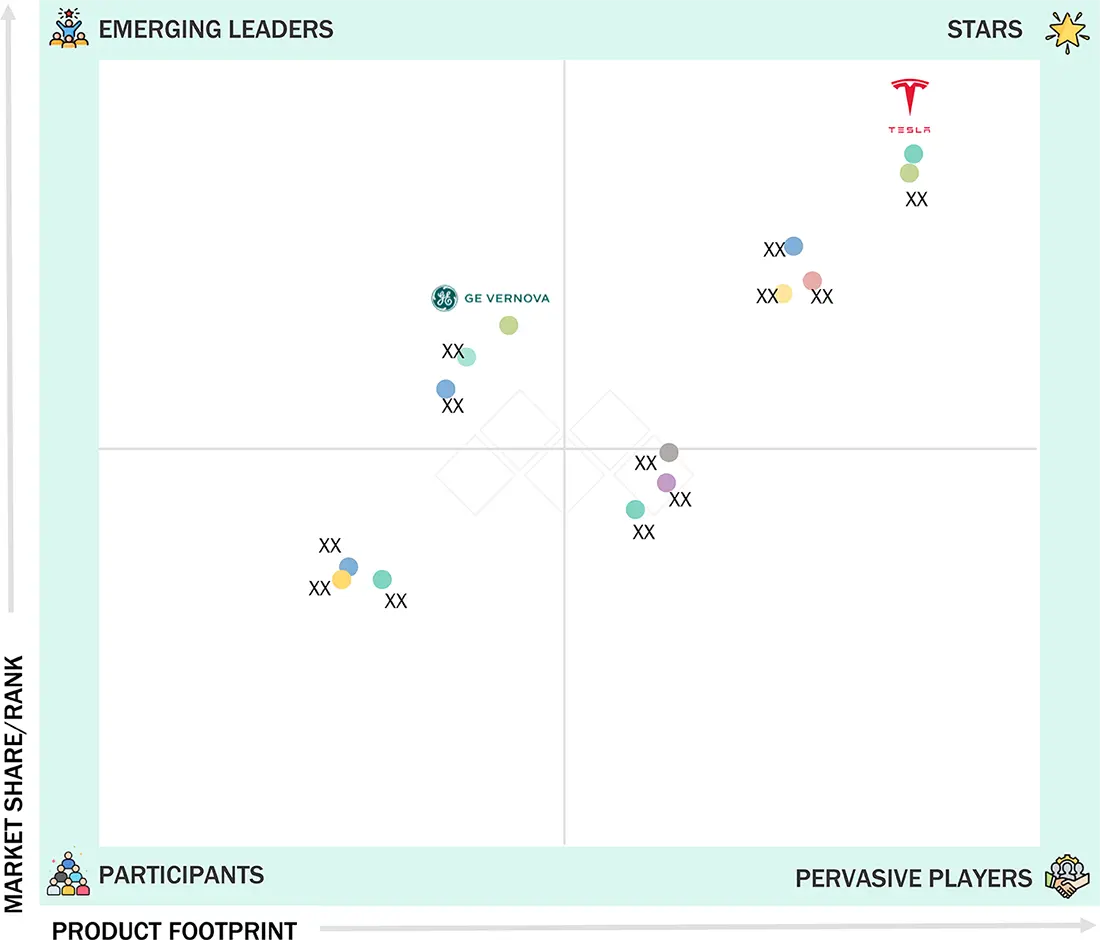
Source: Secondary Research, Interviews with Experts, MarketsandMarkets Analysis
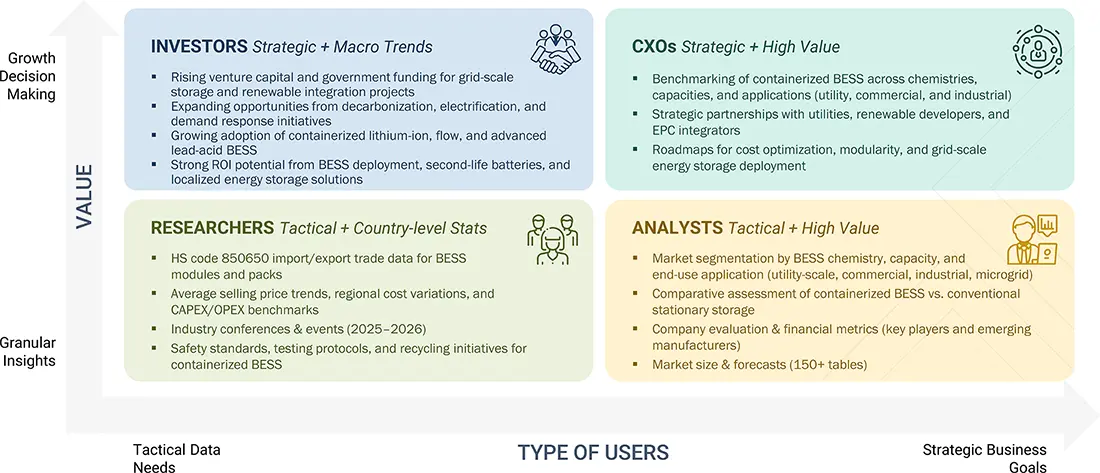
WHAT IS IN IT FOR YOU: Containerized Battery Energy Storage System (BESS) Market REPORT CONTENT GUIDE
DELIVERED CUSTOMIZATIONS
We have successfully delivered the following deep-dive customizations:
| CLIENT REQUEST | CUSTOMIZATION DELIVERED | VALUE ADDS |
|---|---|---|
| Utility-Scale Developer |
|
|
| Commercial & Industrial Energy User |
|
|
| Residential Energy Solutions Provider |
|
|
| Energy Storage Investor |
|
|
RECENT DEVELOPMENTS
- May 2025 : Contemporary Amperex Technology Co., Limited (CATL) launched the TENER Stack, the world’s first 9 MWh ultra-large capacity energy storage system, at Entry/Exit System (EES) Europe 2025. The product was introduced to meet rising global demand for high-density, flexible, and transportable energy storage solutions. Targeted at utilities, developers, and industrial users, the TENER Stack delivers significant advancements in space utilization, energy efficiency, and cost performance. It supports various applications, including AI data centers and industrial electrification.
- April 2025 : Honeywell commissioned a 1.4 MWh microgrid BESS for SECI’s Lakshadweep Islands project, India’s first on-grid solar-plus-storage system, integrating its Energy Management and microgrid control systems to decarbonize the remote Kavaratti microgrid.
- September 2024 : GE Vernova was selected by Quinbrook Infrastructure Partners to serve as the integration provider for stages 1 and 2 (totaling 500 MW/1,500 MWh) of the Supernode BESS project in Queensland, Australia. The deal aims to enable large-scale wind and solar energy storage, supporting one of Australia’s biggest grid-connected BESS installations and advancing renewable energy integration.
- June 2024 : NGK Insulators secured a contract to supply containerized NAS batteries for a grid-storage demonstration project at Hungary’s state-owned MVM Balance power station. The project aims to stabilize the electric grid by storing surplus energy and providing adjustment capacity.
Table of Contents
 Exclusive indicates content/data unique to MarketsandMarkets and not available with any competitors.
Methodology
The study involved major activities in estimating the current market size for the Containerized Battery Energy Storage System (BESS) Market. Exhaustive secondary research was done to collect information on the building information modeling industry. The next step was to validate these findings, assumptions, and sizing with industry experts across the value chain using primary research. Different approaches, such as top-down and bottom-up, were employed to estimate the total market size. After that, the market breakdown and data triangulation procedures were used to estimate the market size of the segments and subsegments of the Containerized Battery Energy Storage System (BESS) Market.
Secondary Research
The secondary research for this study involved gathering information from a wide range of credible sources. These included company annual reports, investor presentations, press releases, whitepapers, certified publications, and articles from reputable associations and government publications. Additional data was obtained from corporate filings, professional and trade associations, journals, and industry-recognized authors. Research from consortia, councils, and gold- and silver-standard websites, directories, and databases also contributed to the qualitative framework. Key global sources such as the International Trade Centre (ITC) and the International Monetary Fund (IMF) were consulted to support and validate the market analysis.
Primary Research
Extensive primary research was conducted after understanding and analyzing the Containerized Battery Energy Storage System (BESS) Market scenario through secondary research. Several primary interviews were conducted with key opinion leaders from demand- and supply-side vendors across four major regions—North America, Europe, Asia Pacific, and RoW. Approximately 20% of the primary interviews were conducted with the demand side and 80% with the supply side. Primary data was collected through questionnaires, e-mails, and telephonic interviews. Various departments within organizations, such as sales, operations, and administration, were contacted to provide a holistic viewpoint in the report.
 Market Size, and Share")
Note: Three tiers of companies are defined based on their total revenue as of 2024: tier 1 = revenue more than USD 5 billion; tier 2 = revenue between USD 500 million and USD 5 billion; and tier 3 = revenue less than USD 500 million. Other designations include sales managers, marketing managers, and product managers.
To know about the assumptions considered for the study, download the pdf brochure
Market Size Estimation
Both top-down and bottom-up approaches have been used to estimate and validate the total size of the containerized BESS market. These methods have also been used extensively to estimate the size of various subsegments in the market. The following research methodology has been used to estimate the market size:
- Major players in the industry and markets have been identified through extensive secondary research.
- The industry’s value chain and market size (in terms of value) have been determined through primary and secondary research processes.
- All percentage shares, splits, and breakdowns have been determined using secondary sources and verified through primary sources.
Containerized Battery Energy Storage System (BESS) Market : Top-Down and Bottom-Up Approach
 Market Top Down and Bottom Up Approach")
Data Triangulation
After arriving at the overall size of the containerized BESS market from the market size estimation process explained above, the total market has been split into several segments and subsegments. Data triangulation and market breakdown procedures have been employed, wherever applicable, to complete the overall market engineering process and arrive at the exact statistics for all segments and subsegments of the market. The data has been triangulated by studying various factors and trends from both the demand and supply sides. Along with this, the market size has been validated using both top-down and bottom-up approaches.
Market Definition
A containerized battery energy storage system (BESS) is a plug-and-play, pre-assembled energy storage solution housed within standard 10-ft, 20-ft, or 40-ft containers. It integrates batteries, inverters, thermal management, and safety systems into a modular and transportable unit. Designed for fast deployment and easy scalability, it minimizes on-site work and supports various grid and off-grid applications. Its standardized design ensures efficient logistics, making it ideal for utility, commercial, and industrial use. These systems enable flexible, space-efficient energy storage with reduced installation time and costs..
Key Stakeholders
- BESS manufacturers and integrators
- Lithium-ion battery manufacturers
- Government bodies and policymakers
- Standards organizations, forums, alliances, and associations
- Market research and consulting firms
- Raw material suppliers and distributors
- Research institutes and organizations
- Material and technology providers
- Battery cell and battery pack manufacturers
- Consumer electronics manufacturers
- Testing, inspection, and certification providers
- Distributors and resellers
Report Objectives
- To define, describe, and forecast the containerized BESS market in terms of battery type, capacity, container size, application, and region
- To describe and forecast the market, in terms of value, with regard to four main regions: North America, Europe, Asia Pacific, and Rest of the World (RoW), along with their respective countries
- To provide detailed information regarding major factors influencing the market growth (drivers, restraints, opportunities, and challenges)
- To provide a detailed overview of the value chain of the containerized BESS market.
- To strategically analyze micromarkets with respect to individual growth trends, prospects, and contributions to the containerized BESS market
- To analyze opportunities in the market for stakeholders by identifying high-growth segments of the containerized BESS market
- To strategically profile key players and comprehensively analyze their market position in terms of ranking and core competencies, along with detailing the competitive landscape for market leaders
- To analyze competitive strategies, such as product launches, expansions, and mergers & acquisitions, adopted by key market players in the containerized BESS market
Available customizations:
With the given market data, MarketsandMarkets offers customizations according to the company’s specific needs. The following customization options are available for the report:
Company Information
- Detailed analysis and profiling of additional market players (up to five)
Key Questions Addressed by the Report
What is the current size of the global containerized BESS market?
The global containerized Battery Energy Storage System (BESS) market is estimated at USD 13.87 billion in 2025. The market includes containerized systems based on lithium-ion, advanced lead-acid, and sodium-based batteries for utility, commercial, industrial, and residential applications. (MarketsandMarkets)
What will be the projected size of the containerized BESS market by 2030?
The containerized BESS market is projected to reach USD 35.82 billion by 2030. Growth is driven by renewable energy integration, grid modernization, and increasing demand for flexible energy storage solutions. (MarketsandMarkets)
What is the CAGR of the containerized BESS market?
The market is expected to grow at a CAGR of 20.9% from 2025 to 2030 due to increasing deployment of renewable energy storage, microgrids, and backup power systems. (MarketsandMarkets)
What are the major growth drivers of the containerized BESS industry?
Key growth drivers include increasing renewable energy generation, rising investment in grid infrastructure, demand for energy resilience, expansion of EV charging infrastructure, and adoption of off-grid energy solutions. (MarketsandMarkets)
What are the major trends shaping the containerized BESS market?
Major trends include modular and scalable battery storage architectures, advanced battery chemistries, AI-based energy management, improved thermal management, renewable energy integration, rapid deployment solutions, and container design innovations. (MarketsandMarkets)
Which industries and applications are driving containerized BESS adoption?
Containerized BESS is widely used in utilities, commercial & industrial facilities, renewable energy projects, microgrids, EV charging infrastructure, and backup power applications. The commercial & industrial segment is expected to grow at a CAGR of 22.1% during 2025–2030. (MarketsandMarkets)
Which companies are major players in the containerized BESS market?
Key companies include Tesla, Contemporary Amperex Technology Co. Limited (CATL), BYD, Eaton, Honeywell International Inc., GE Vernova, Alpha ESS, TLS Offshore Containers, and Shanghai OE Industrial. (MarketsandMarkets)
Which battery type and capacity segment dominates the containerized BESS market?
Lithium-ion batteries are expected to hold the largest market share by 2030 due to high energy density, efficiency, and wide adoption. Medium-capacity systems (1,000–5,000 kWh) are expected to gain significant market share during the forecast period. (MarketsandMarkets)
Which region leads the global containerized BESS market?
Asia Pacific dominated the market with a 52.9% share in 2024, supported by large-scale renewable energy deployment, battery manufacturing capabilities, and government initiatives in countries such as China, Japan, South Korea, and India. (MarketsandMarkets)
What does the MarketsandMarkets containerized BESS market report cover?
The report provides market forecasts, competitive landscape analysis, growth drivers, trends, opportunities, and segmentation by battery type (lithium-ion, advanced lead-acid, sodium-based), capacity (<1,000 kWh, 1,000–5,000 kWh, >5,000 kWh), container size (10 ft, 20 ft, 40 ft), application, and region. The report includes 230 pages and 150 market tables and covers 2021–2030 analysis. (MarketsandMarkets)
Need a Tailored Report?
Customize this report to your needs
Get 10% FREE Customization
Customize This ReportPersonalize This Research
- Triangulate with your Own Data
- Get Data as per your Format and Definition
- Gain a Deeper Dive on a Specific Application, Geography, Customer or Competitor
- Any level of Personalization
Let Us Help You
- What are the Known and Unknown Adjacencies Impacting the Containerized Battery Energy Storage System (BESS) Market
- What will your New Revenue Sources be?
- Who will be your Top Customer; what will make them switch?
- Defend your Market Share or Win Competitors
- Get a Scorecard for Target Partners

Custom Market Research Services
We Will Customise The Research For You, In Case The Report Listed Above Does Not Meet With Your Requirements
Get 10% Free CustomisationTESTIMONIALS

Tetsuya Ohhira
Business Development Manager-Technology Business
Nikon Corporation,
Leading Japanese MNC specializing in optics and imaging productswww.nikon.com
MarketsandMarkets™ response
is quick. Their attitude is flexible and positive. Analyst Insights are globally considered and
significant. Client Services quickly respond to our inquiry and demand. Their wide range of global
surveys help us make our strategic plan.
We hope Knowledge Store will be easier to search
for a report.
VP - Marketing & Business Development
Leading Provider of Process Control Solutions
We engaged with MarketsandMarkets on a study to perform an analysis and recommend a Go-To-Market strategy for metrology and process control in the semiconductor market. The study was tailored to our targets and needs with well-defined milestones. Our overall experience with the MarketsandMarkets team was very good throughout the project in all aspects including the analysis methodologies used, the quality and depth of primary and secondary data sets, the professionalism and flexibility of the team and the ability to meet the target schedule and milestones. We want to thank MarketsandMarkets team for a job well done.
Growth opportunities and latent adjacency in Containerized Battery Energy Storage System (BESS) Market


Emmett
Apr, 2026
Does this report include region-wise growth trends for containerized BESS, including emerging markets like Southeast Asia and Africa?.
Raymond
Apr, 2026
Would it be possible to add market analysis by deployment type, like on-grid versus off-grid applications?.