Data Center Busways Market

Data Center Busways Market by IT Load (Al, Non-Al), Data Center Type (Hyperscale, Colocation, Enterprise), Conductor Type (Copper, Aluminum & Hybrid), Power Source (AC, DC), Power Ampacity, and Region - Global Forecast to 2032




DATA CENTER BUSWAYS MARKET
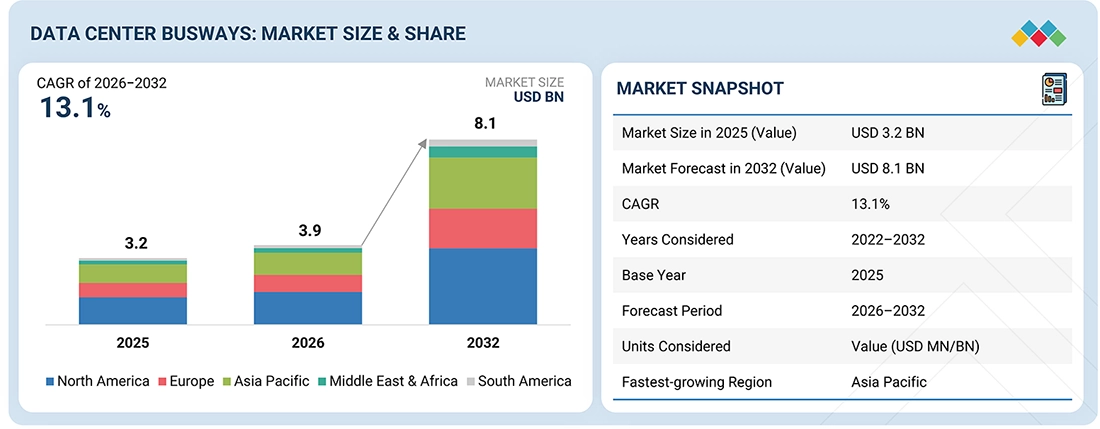
Source: Secondary Research, Interviews with Experts, MarketsandMarkets Analysis | Updated on : September 21, 2026
KEY TAKEAWAYS
-
By RegionThe global data center busways market is led by North America with a share of 54%, in terms of value, in 2025. The market in the region is projected to register a CAGR of 13.1% between 2026 and 2032.
-
By IT Load TypeThe AI data center segment accounted for a share of 17.9%, in terms of value, of the overall market in 2025.
-
BY Power AmpacityMedium ampacity (800 A to 1,000 A) busways accounted for the largest share of the market at 55%, in terms of value, of the overall market
-
By Power SourceThe AC busway segment is expected to dominate the market during the forecast period.
-
By Conductor TypeCopper remains the preferred conductor material in hyperscale and mission-critical data centers due to its higher conductivity, compact footprint, and ability to handle very high currents.
-
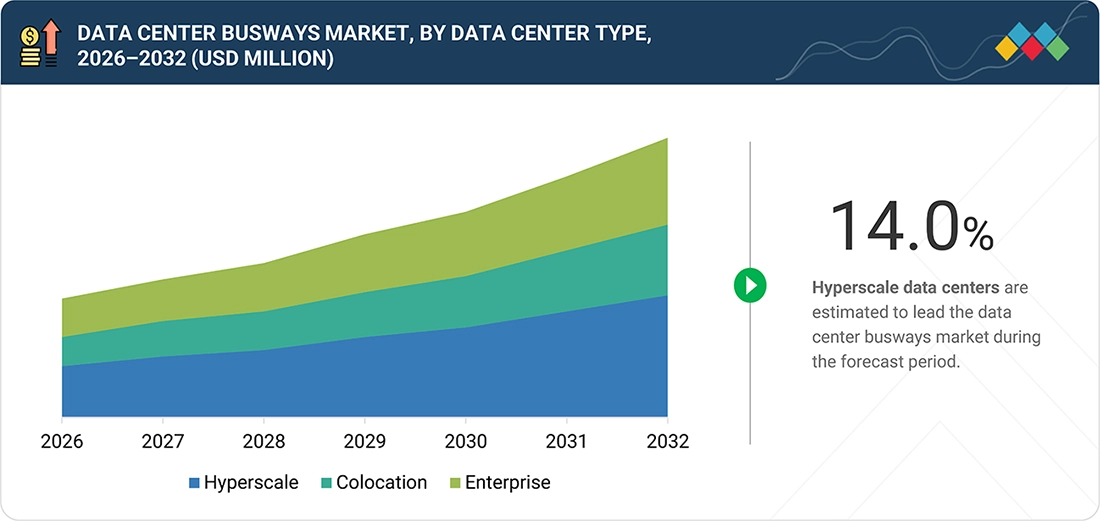
By Data Center TypeHyperscale is the largest and fastest-growing data center type for busways, accounting for 64% of the overall market in terms of value in 2025.
-
Competitive Landscape - Key PlayersSchneider Electric, Legrand, Eaton, ABB, and Siemens were identified as the leading participants in the data center busways market, supported by their extensive product portfolios, global manufacturing footprint, installed base, and strong relationships with hyperscale, colocation, and enterprise data center operators.
-
Competitive Landscape - StartupsUSA TrackBusway LLC, Zhenjiang Anyi Electrical Co., Ltd., and several regional busway manufacturers have strengthened their presence in the data center busways market by offering specialized power distribution solutions for hyperscale, colocation, and high-density computing environments. Their growing participation in AI-focused data center projects highlights their potential to expand their market presence over the coming years
The data center busways market is experiencing a significant growth trend due to the rapid growth of AI-powered compute infrastructure, the deployment of hyperscale cloud facilities, and the demand for flexible and scalable power distribution. Data center operators are rapidly moving toward modular busway infrastructure from traditional cable-based architectures to improve deployment time, operational flexibility, and scalability. Due to increasing rack power densities driven by AI and High Performance Computing (HPC) workloads, demand for medium- and high-ampacity busway systems capable of handling higher power is projected to grow. Hyperscale data centers command the largest share of the market due to massive investments from major cloud service providers, coupled with continuous buildout of AI infrastructure. Colocation providers are increasingly adopting busway systems to deliver power more quickly and accommodate tenants' changing requirements. North America is the leading regional market, with multiple hyperscale campus facilities and significant investment in AI infrastructure, whereas Asia Pacific is estimated to exhibit the highest growth rate owing to growing cloud deployment, digital transformation initiatives, and enormous construction activities for data centers. Established product offerings, large installed bases, and strong relationships with data center operators enable market leaders such as Schneider Electric, Legrand (Starline), Eaton, ABB, and Siemens to maintain and strengthen their market positions.
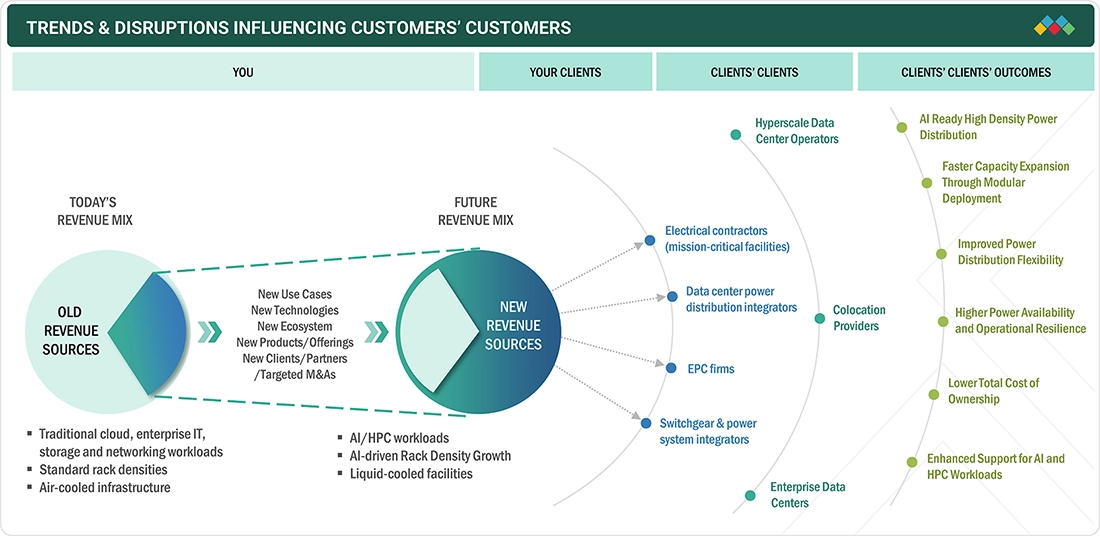
TRENDS & DISRUPTIONS IMPACTING CUSTOMERS' CUSTOMERS
The evolution of the data center busways market is being influenced by the acceleration of AI-powered compute infrastructure, the growth of hyperscale cloud deployments, and rising rack power densities. Over time, the market will see a gradual shift in demand from conventional enterprise and cloud workloads, which use standard rack-density, air-cooled facilities, toward AI/HPC deployments and liquid-cooled facilities requiring more versatile, higher-capacity power distribution infrastructure. These trends are creating new growth for the busway and tap-off unit market and reinforcing the importance of electrical contractors, power distribution integrators, and EPCs in the success of large-scale colocation, enterprise, and hyperscale facilities. As data center operators modernize their power distribution networks to meet the high-density demands of modern workloads, data center busway suppliers are expected to see a significant increase in demand for busways in high-density data center facilities.
Source: Secondary Research, Interviews with Experts, MarketsandMarkets Analysis
DATA CENTER BUSWAYS MARKET DYNAMICS

Level
-
AI clusters are breaking traditional power distribution architectures

-
Expansion of hyperscale data centers


Level
-
Higher initial capital cost

-
Intense procurement scrutiny


Level
-
AI Infrastructure will require entirely new busway designs

-
Emergence of high-power DC distribution


Level
-
Thermal management is becoming a design bottleneck

-
Copper price volatility directly impacts profitability

Source: Secondary Research, Interviews with Experts, MarketsandMarkets Analysis
Driver: Expansion of hyperscale data centers
The expanding number of hyperscale data centers is now expected to be one of the primary growth drivers of the data center busways market. Increasing cloud workloads and the use of digital services and AI applications require leading cloud service providers to continuously deploy new, more power-intensive data centers. This increase in facility scale has required data center infrastructure operators to focus on power distribution technologies that enable rapid deployment, easy infrastructure alterations, and seamless future expansion. Compared to conventional cable-based power distribution systems, busway architectures allow for much easier manipulation of rack placement and power density within data centers; thus, they are more adaptable in hyperscale data centers, which are known for the largest facilities. The further construction of hyperscale campuses should drive the demand for busway systems in new data centers and facility retrofits.
Restraint: Higher initial capital cost
The higher initial investment needed for implementing busway systems is a limiting factor compared to conventional cable-based power distribution schemes. Installation costs cover not only the busway itself, but also busway-specific components such as tap-off boxes, support structures, monitoring equipment, and installation labor. Despite offering long-term benefits such as improved expandability, simplified maintenance, and reduced infrastructure modifications, data center owners and operators in the small- and medium-sized business segment often place greater emphasis on upfront investment costs when making power distribution design decisions. The higher initial cost associated with busway systems becomes a more important consideration for retrofit projects and smaller enterprise data centers, potentially delaying adoption.
Opportunities: AI infrastructure will require entirely new busway designs
The rapid deployment of AI infrastructure is creating new requirements for power distribution systems that challenge many conventional data center design approaches. AI clusters and high-performance computing environments are significantly increasing rack power densities, resulting in greater current-carrying requirements and more concentrated power delivery needs. For these next-generation facilities to be supported, busway makers will need to provide systems with higher ampacity, improved thermal performance and monitoring capabilities, and compatibility with liquid-cooled data center environments. As data center owners ramp up deployments of AI-focused infrastructure, there should be significant growth opportunities for busway makers and technology suppliers, driven by rising demand for new busway architectures tailored to high-density compute operations.
Challenges: Regulatory & standardization constraint
The rapid evolution of AI infrastructure is creating uncertainty around future power distribution standards and design requirements across the data center industry. Growing rack power densities and operators' exploration of alternative cooling technologies, high-voltage architectures, and power distribution solutions are increasing the need for busway manufacturers to maintain compliance with electrical, safety, and performance standards, which may be modified by future market trends. Disparities in regional specifications, certification requirements, and design specifications among countries may pose challenges to developing and exporting products worldwide. Manufacturers could also incur additional costs for product testing, certification, and modifications to satisfy the requirements of future industry and customers.
DATA CENTER BUSWAYS MARKET: COMMERCIAL USE CASES ACROSS INDUSTRIES
| COMPANY | USE CASE DESCRIPTION | BENEFITS |
|---|---|---|
 |
Provides modular and scalable power distribution solutions for hyperscale cloud, colocation, enterprise, and AI-ready data centers | Supports rapid deployment and expansion of high-density computing environments through flexible electrical distribution architectures | Enables faster deployment of IT infrastructure | Simplifies power distribution reconfiguration | Reduces installation complexity compared to traditional cabling | Supports increasing power demands associated with AI and HPC workloads |
 |
Delivers overhead power distribution systems used across hyperscale, colocation, enterprise, and high-performance computing facilities | Supports dynamic rack layouts and changing power requirements through flexible plug-and-play power distribution architectures | Enhances operational flexibility | Reduces downtime during infrastructure modifications | Improves space utilization | Supports evolving compute requirements in cloud and AI-driven environments |
 |
Provides configurable power distribution solutions for mission-critical facilities, cloud campuses, enterprise data centers, and colocation environments | Supports scalable electrical infrastructure capable of adapting to changing capacity requirements and facility expansions | Enhances power infrastructure scalability | Expedites capacity expansion | Simplifies maintenance requirements | Improves operational efficiency through flexible and configurable power distribution architectures |
 |
Supplies modular electrical distribution solutions for hyperscale, enterprise, and colocation data centers requiring reliable and efficient power delivery | Supports long-term infrastructure growth through scalable and expandable power architectures | Increases power distribution reliability | Enables modular facility expansion | Improves electrical efficiency | Minimizes operational disruption during infrastructure upgrades and expansions |
 |
Provides busbar power distribution systems designed to meet the demand of enterprise facilities, cloud campuses, large data centers and other mission-critical locations | Enables the high efficiency power transmission and meet the demand for future capacity growth and upgrade of the facility | Reduces cable complexity | Improves installation efficiency | Supports future scalability requirements | Enhances reliability of mission-critical electrical infrastructure |
Logos and trademarks shown above are the property of their respective owners. Their use here is for informational and illustrative purposes only.
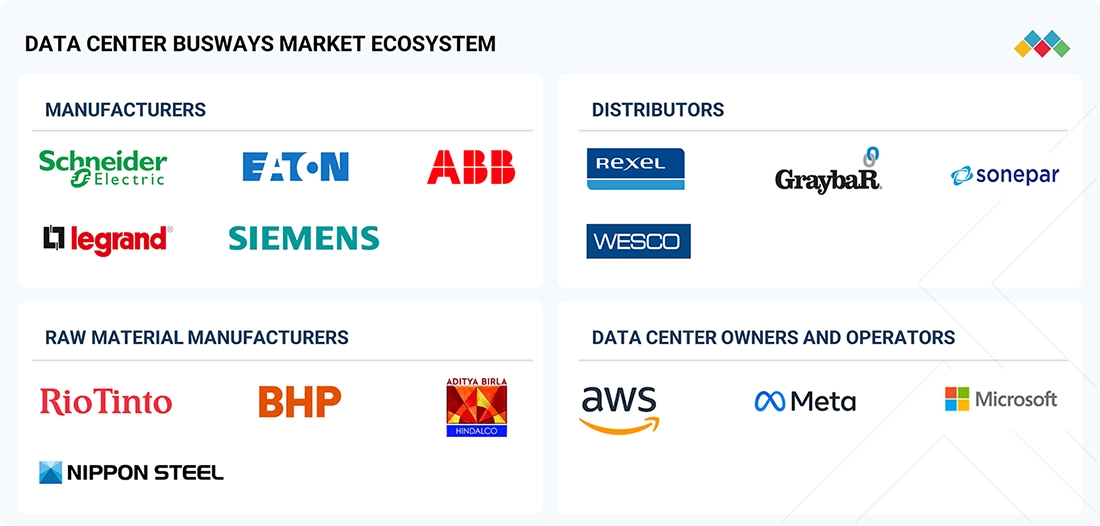
DATA CENTER BUSWAYS MARKET ECOSYSTEM
Key players in this market are large, established electrical infrastructure companies with extensive experience in mission-critical power distribution and strong relationships across the global data center ecosystem. Some key players in the market are Legrand (France), Schneider Electric (France), Vertiv Group Corp. (US), Eaton (Ireland), and ABB (Switzerland)
Logos and trademarks shown above are the property of their respective owners. Their use here is for informational and illustrative purposes only.
DATA CENTER BUSWAYS MARKET SEGMENTS
Source: Secondary Research, Interviews with Experts, MarketsandMarkets Analysis
Data Center Busways Market By Data Center Type
Hyperscale installations have increasingly gained prominence in driving the data center busway market. Increased hyperscale demand for scalable high-capacity power distribution infrastructure has continued to grow at a fast pace. The need for rapid deployment, driven by cloud computing, AI, and high-performance computing (HPC) workloads, is prompting users to select modular busway systems, enabling faster deployment and scalability of the distribution system while also enhancing operational agility. Colocation operators have also been augmenting their deployment of busway solutions in their facilities due to requirements of various tenants to fulfill differing needs and for quick provisioning of power in their high-density data centers. Enterprise facilities continue to be an essential segment as organizations upgrade their existing electrical systems toward flexible power distribution to support digital transformation trends, hybrid cloud adoption, and changing compute needs.
Data Center Busways Market By Power Source
AC-based busway systems currently dominate the data center market due to their widespread adoption in enterprise, colocation, and hyperscale sites, as well as their interoperability with existing power distribution system components, such as switchgear, UPSs, transformers, and power distribution units. In fact, new data centers are largely still being designed with AC power distribution systems in mind because they are familiar, there are established ecosystem solutions, and they offer proven operational reliability. Nevertheless, increasing rack power densities required for AI and high-performance computing (HPC) workloads have generated increased industry interest in new DC power distribution systems that could improve power conversion efficiency and reduce electrical losses in high-density computing environments. Despite today's relatively low adoption rate, future investments in AI infrastructure and new data center architectures should lead to increased adoption of DC-based power distribution systems over the long term.
Data Center Busways Market By Conductor Type
Copper remains the preferred conductor material in data center busway systems for its superior electrical conductivity, compact footprint, and ability to efficiently support high-current applications in mission-critical environments. The increasing deployment of AI and high-performance computing (HPC) infrastructure is further reinforcing demand for copper-based busways, particularly in high-density facilities requiring greater power delivery capabilities. However, rising focus on capital efficiency and large-scale data center construction is encouraging operators to evaluate aluminum-based alternatives, which offer a lower-cost solution while providing acceptable performance for many power distribution applications. Hybrid conductor designs that combine copper and aluminum are also attracting interest as operators seek to balance performance, weight, and cost considerations, particularly in large facilities where power distribution requirements vary across different applications.
REGION
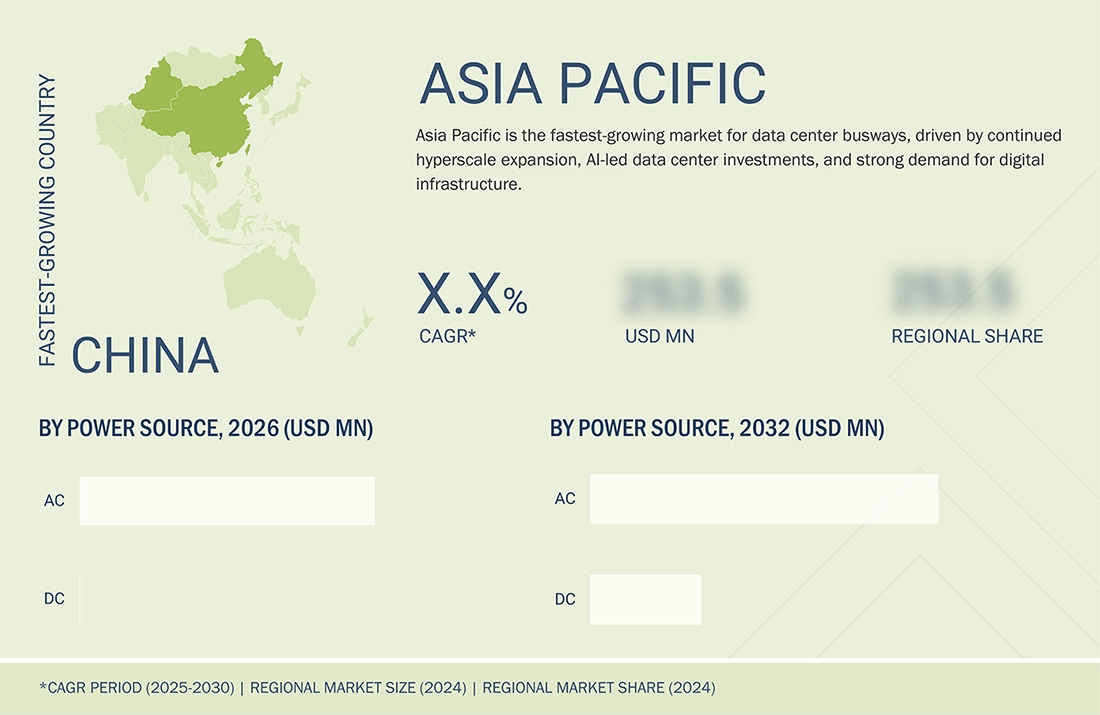
Asia Pacific is expected to be the fastest-growing market during the forecast period.
Asia Pacific is set to be the fastest-growth region in the data center busways market, mainly backed by a quick push of hyperscale, colocation, and AI-centric data centers across China, India, Southeast Asia, Japan, and Australia. In the meantime, the region’s data center electricity usage is climbing fast, and the newer sites are getting planned for bigger, larger capacities too, which then boosts the need for high-ampacity, modular, and scalable busway systems. With the rising AI take-up and cloud adoption, busway deployment should get an extra lift for more efficient but also flexible power distribution.
DATA CENTER BUSWAYS MARKET: COMPANY EVALUATION MATRIX
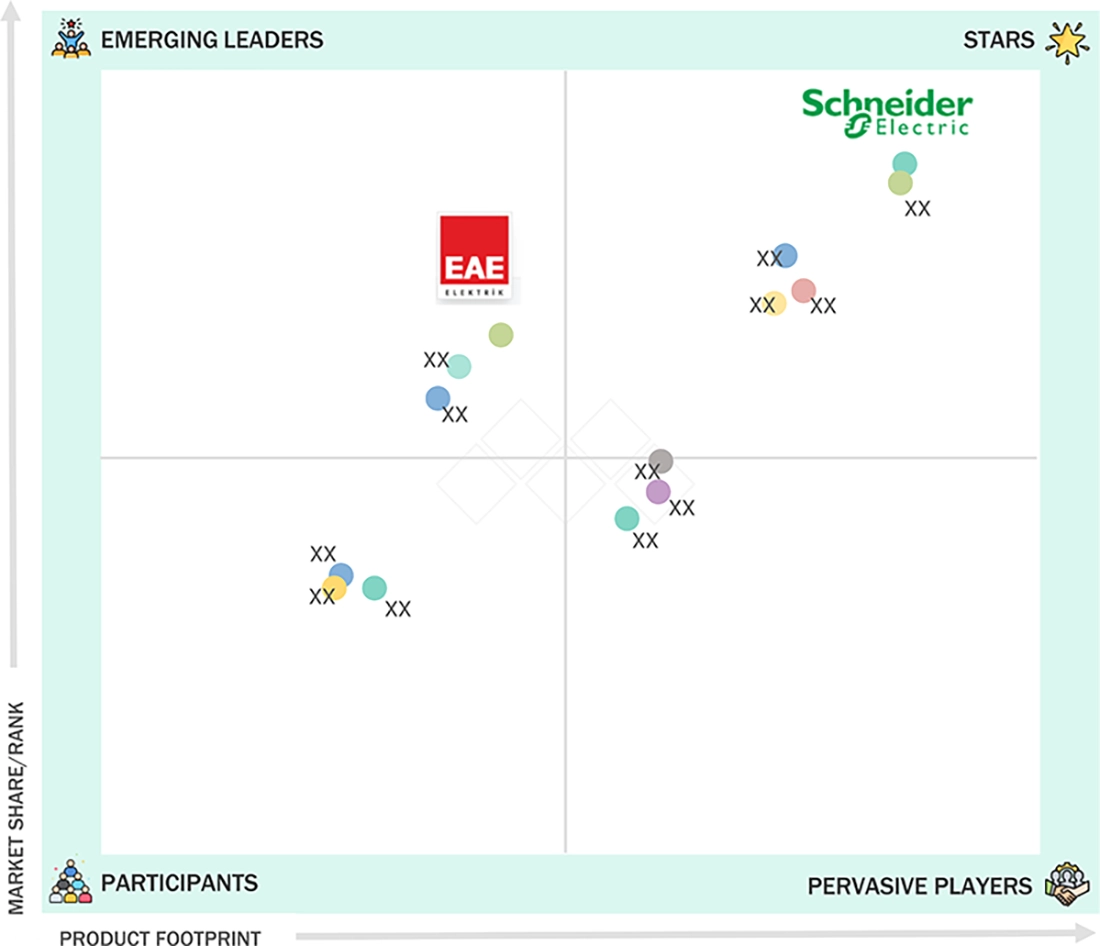
In the data center busways market, Schneider Electric (Star) stands as a leading solution provider, offering a comprehensive portfolio of busway systems and power distribution solutions designed for hyperscale, colocation, and enterprise data centers. The company's strong presence in energy management, extensive installed base, and continuous innovation in data center-specific busway technologies, including solutions for high-density and AI-driven environments, position it to maintain its leadership in the market. EAE Electric (Emerging Leader) is strengthening its position through its expanding portfolio of modular busway solutions tailored for dynamic data center environments, with a particular focus on scalable overhead power distribution systems that support AI, high-performance computing (HPC), and evolving power density requirements.
Source: Secondary Research, Interviews with Experts, MarketsandMarkets Analysis
DATA CENTER BUSWAYS MARKET PLAYERS
- Legrand
- Schneider Electric
- Vertiv Group Corp.
- Eaton
- ABB
- Siemens
- Delta Power Solutions
- LS Cable & System Ltd.
- Wetown
- FLEX LTD
- EAE Electric
DATA CENTER BUSWAYS MARKET SCOPE
| REPORT METRIC | DETAILS |
|---|---|
| Market Size in 2025 (Value) | USD 3.2 Billion |
| Market Size in 2026 (Value) | USD 3.9 Billion |
| Market Forecast in 2032 (Value) | USD 8.1 Billion |
| Growth Rate | CAGR of 13.1% from 2026–2032 |
| Years Considered | 2022–2032 |
| Base Year | 2025 |
| Forecast Period | 2026–2032 |
| Units Considered | Value (USD MN/BN) |
| Report Coverage | The report defines, segments, and projects the data center busways market based on IT load type, data center type, power ampacity, conductor type, power source, and region. It provides detailed information on the major factors influencing the market's growth, including drivers, restraints, opportunities, and challenges. It strategically profiles data center busway manufacturers, comprehensively analyzes their market shares and core competencies, and tracks and analyzes competitive developments they undertake in the market, such as expansions, partnerships, and new product launches. |
| Segments Covered |
|
| Regional Scope | North America, Europe, Asia Pacific, Rest Of World |
WHAT IS IN IT FOR YOU: DATA CENTER BUSWAYS MARKET REPORT CONTENT GUIDE
DELIVERED CUSTOMIZATIONS
We have successfully delivered the following deep-dive customizations:
| CLIENT REQUEST | CUSTOMIZATION DELIVERED | VALUE ADDS |
|---|---|---|
| Hyperscale Cloud Providers |
|
|
| Colocation Data Center Operators |
|
|
| Enterprise Data Center Operators |
|
|
RECENT DEVELOPMENTS
- June 2025 : In June 2025, Legrand announced the acquisition of Linkk Busway Systems, a Malaysian specialist in power busbars for data center grey-space applications.
- April 2024 : Legrand launched the Remote Plug-In Actuator for Starline Track Busway, enabling remote operation of plug-in units and improving safety in high-density AI and HPC data centers.
- March 2024 : Schneider Electric announced a collaboration with NVIDIA to develop AI-ready data center reference architectures. The partnership focuses on optimizing performance, scalability, energy efficiency, and infrastructure readiness for next-generation AI deployments.
Table of Contents
 Exclusive indicates content/data unique to MarketsandMarkets and not available with any competitors.
Methodology
The study involved four major activities in estimating the current market size of data center busways. Exhaustive secondary research was done to collect information on the market, the peer market, and the parent market. The next step was to validate these findings, assumptions, and sizes with industry experts across the value chain of data center busways through primary research. Both top-down and bottom-up approaches were employed to estimate the complete market size. After that, market breakdown and data triangulation were used to estimate the size of the segments and sub-segments of the market.
Secondary Research
The research methodology used to estimate and forecast the data center busways market begins with capturing data on the revenues of key vendors in the market through secondary research. In the secondary research process, various secondary sources, such as Hoovers, Bloomberg Businessweek, Factiva, World Bank, Uptime Institute, JLL Data Center Outlook, AFCOM, and industry journals, were referred to for identifying and collecting information for this study. These secondary sources included annual reports, press releases, and investor presentations of companies; white papers; certified publications; articles by recognized authors; notifications by regulatory bodies; trade directories; and databases. Product portfolios and business developments of market participants were also taken into consideration to determine market segmentation and competitive positioning.
Primary Research
The data center busways market comprises several stakeholders, such as busway manufacturers, power distribution equipment suppliers, data center developers, colocation providers, and regulatory organizations in the supply chain. Various primary sources from both the supply and demand sides of the market were interviewed to obtain qualitative and quantitative information. Primary sources from the supply side included industry experts such as Chief Executive Officers (CEOs), vice presidents, marketing directors, technology and innovation directors, and related key executives from various key companies and organizations operating in the data center busways market. Primary sources from the demand side included directors, marketing heads, and purchase managers from various end-use industries. The following is the breakdown of the primary respondents:
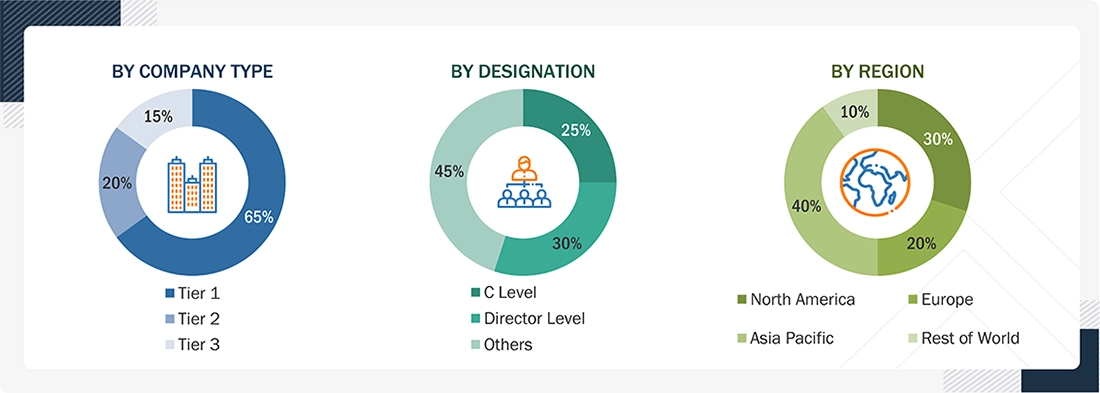
To know about the assumptions considered for the study, download the pdf brochure
Market Size Estimation
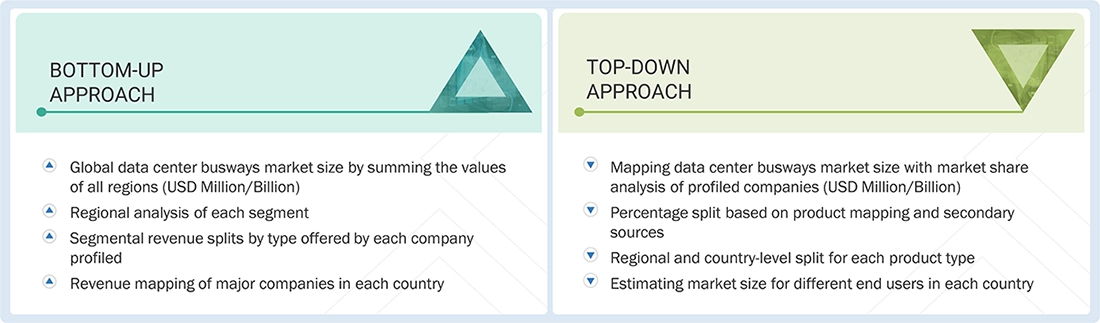
Both the top-down and bottom-up approaches have been used to estimate and validate the total size of the data center busways market. These approaches have also been used extensively to estimate the size of various dependent subsegments of the market. The research methodology used to estimate the market size included the following.
The following segments provide details about the overall market size estimation process employed in this study:
- The key players in the market were identified through secondary research.
- The market shares in the respective regions were identified through primary and secondary research.
- The value chain and market size of the data center busways market, in terms of value, were determined through primary and secondary research.
- All percentage shares, splits, and breakdowns were determined using secondary sources and verified through primary sources.
- All possible parameters that affect the market covered in this research study were accounted for, viewed in extensive detail, verified through primary research, and analyzed to obtain the final quantitative and qualitative data.
- The research included the study of annual and financial reports of the top market players and interviews with industry experts, such as CEOs, VPs, directors, sales managers, and marketing executives.
Global Data Center Busways Market Size: Bottom-Up Approach and Top-Down Approach
Data Triangulation
After arriving at the overall market size using the market size estimation processes as explained above, the market was split into several segments and sub-segments. To complete the overall market engineering process and arrive at the exact statistics of each market segment and subsegment, the data triangulation and market breakdown procedures were employed, wherever applicable. The data was triangulated by studying various factors and trends from both the demand and supply sides in various sectors.
Market Definition
Data center busways are modular electrical power distribution systems used to deliver power from upstream electrical infrastructure to IT equipment within data center facilities. These systems provide a flexible, scalable, and efficient alternative to conventional cable-based power distribution architectures, enabling simplified installation, capacity expansion, and maintenance. Data center busways are deployed across enterprise, colocation, and hyperscale facilities and are available in various configurations based on power source, conductor type, and ampacity requirements. They are increasingly adopted to support higher rack densities, artificial intelligence workloads, and growing power demands in modern data center environments.
Key Stakeholders
- Data center busway manufacturers
- Data center busway traders, distributors, and suppliers
- Data center busway developers, operators, colocation providers, and hyperscalers
- Governments and research organizations
- Associations and industrial bodies
- Research and consulting firms
- Research & development (R&D) institutions
- Investment banks and private equity firms
Report Objectives
- To analyze and forecast the market size of the data center busways market in terms of value
- To provide detailed information regarding the major factors (drivers, restraints, challenges, and opportunities) influencing the market
- To analyze and forecast the global data center busways market on the basis of IT load type, power ampacity, power source, conductor type, data center type, and region
- To analyze the opportunities in the market for stakeholders and provide details of the competitive landscape for market leaders
- To forecast the size of various market segments based on five major regions: Asia Pacific, Europe, North America, the Rest of World, along with their respective key countries
- To track and analyze the competitive developments, such as acquisitions, partnerships, collaborations, agreements, and expansions in the market
- To strategically profile the key players and comprehensively analyze their market shares and core competencies
Available customizations:
With the given market data, MarketsandMarkets offers customizations according to the client-specific needs.
The following customization options are available for the report:
- Additional country-level analysis of the data center busways market
- Profiling of additional market players (up to 5)
Product Analysis
- Product matrix, which gives a detailed comparison of the product portfolio of each company.


Personalize This Research
- Triangulate with your Own Data
- Get Data as per your Format and Definition
- Gain a Deeper Dive on a Specific Application, Geography, Customer or Competitor
- Any level of Personalization
Let Us Help You
- What are the Known and Unknown Adjacencies Impacting the Data Center Busways Market
- What will your New Revenue Sources be?
- Who will be your Top Customer; what will make them switch?
- Defend your Market Share or Win Competitors
- Get a Scorecard for Target Partners

Custom Market Research Services
We Will Customise The Research For You, In Case The Report Listed Above Does Not Meet With Your Requirements
Get 10% Free CustomisationTESTIMONIALS

We at Nissan Chemicals Corporation have been clients of MarketsandMarkets for more than a year now. We recently consulted MarketsandMarkets for a study, the team at MarketsandMarkets was extremely professional and organized. The business insights were very detailed and aligned well with our expectations that really helped us formulate the Business Plans and device new strategies for development themes. MarketsandMarkets offers a unique combination of expertise and dedicated engagement model. Their research findings have helped us in designing our Pricing Strategy which will make it easier for us to predict the future sales and profits for the next ten years. We look forward to working with MarketsandMarkets in the future.
VP of Strategy & New Business Development
Leading Specialty Chemical Company
The MarketsandMarkets Engagement Model, composed of both the Knowledge Store and advisory custom research, has greatly helped us in understanding our markets and making strategic decisions. The Knowledge Store is a fast way to allow everyone in our organization to understand more about most any market they are interested in. The ability to then get custom research done and get answers to specific strategic questions and market insight has been spectacular. The Markets and Markets team feel more like colleagues than vendors and their services have helped us change our culture where statements of things like growth opportunities and competitive position are always backed by industry research.

Rich Gibson,
Director, Corporate Strategy
Milliken & Company,
Leading Industrial Manufacturer of specialty chemical, floor covering, performance and protective textile materials, and healthcaremilliken.com
MarketsandMarkets is a trusted resource that helps us to better understand markets that are near-adjacencies-whether its technology, value chain or geography. Their Knowledge Store platform provides a dashboard of markets and their characteristics which is easy to use and saves us time.
Adam Shaw,
Market Development and Strategy Manager
AdvanSix Inc. USA,
An American Leader in Chemicalswww.advansix.com
The Knowledge Store from MarketsandMarkets is a valuable tool which has helped my team acquire greater insight in to the end markets that our business serves. This has enabled us to help our company build stronger strategies throughout our planning process.
TOSHIO KINOSHITA
Senior Chif Consultion Research & Consulting Division
Mitsubishi Chemical Research Corporation,
Leading Manufacturer of Chemical Productswww.mitsubishichem-res.co.jp/en/

We recently engaged with MarketsandMarkets for a study, the team not only clearly understood our business objectives but was also extremely professional in the way they handled the entire project. The study was efficiently conducted in a phase-wise manner, and the engagement model furnished us with high-quality business insights that far exceeded our expectations at each phase. We were especially happy that MarketsandMarkets could provide us with both, an English as well as a Japanese version of the study. A special thanks to the Analyst Team and Client Services Team, whose fluency in Japanese enhanced our comfort level, as we could converse with them in our preferred language.
Independent entrepreneurs
Arrow Precision
We approached MarketsandMarkets for study on Proppants Market, and their work exceeded our expectations. The study conducted was comprehensive and enabled us to view the market through the various dimensions. In addition, the team was extraordinarily responsive throughout the process and resolved our queries on time. I strongly recommend MarketsandMarkets and will certainly consider them for additional market assessments we will need in the future.
Global engineering company, Japan
Deputy Manager,
Strategic Planning OfficeThe high-quality insights shared by the MarketsandMarkets team helped us understand the pharmaceutical plant designers in a specific geography. It also captured the risks that we may likely face in communicating with our potential partners. The study would enable us identify partners, which would impact our future growth.
- US Data Center Busways Market
- Canada Data Center Busways Market
- Mexico Data Center Busways Market
- Germany Data Center Busways Market
- UK Data Center Busways Market
- France Data Center Busways Market
- Netherlands Data Center Busways Market
- Rest Of Europe Data Center Busways Market
- China Data Center Busways Market
- Japan Data Center Busways Market
- India Data Center Busways Market
- Australia Data Center Busways Market
- Rest Of Asia Pacific Data Center Busways Market






Growth opportunities and latent adjacency in Data Center Busways Market