
Derma Fillers Market Size, Growth, Share & Trends Analysis

Derma Fillers Market by Brand (Juvederm, Sculptra, Radiesse), Product (Hyaluronic, Collagen, PLLA), Procedure (Skin Rejuvenation, Scar Removal, Face & Body Contouring), End User (Dermatology Clinic, Beauty Centers, Medical Spa) - Global Forecast to 2030


OVERVIEW

Source: Secondary Research, Interviews with Experts, MarketsandMarkets Analysis
The global dermal fillers market is entering a phase of accelerated growth, projected to expand from USD 4.13 billion in 2025 to USD 7.32 billion by 2030, at a CAGR of 12.1%. Demand is being fueled by the rising popularity of minimally invasive cosmetic procedures, the growing influence of social media, and increased consumer spending on self-care and aesthetic enhancement. North America continues to lead due to established clinical infrastructure and a culture of early adoption. Europe is supported by strong clinical expertise and a rising MedSpa culture, albeit within a more regulated framework. However, Asia Pacific is emerging as the fastest-growing region, driven by the surge in medical tourism in countries such as South Korea, Thailand, and India, combined with the expansion of the middle-class consumer base seeking affordable yet advanced aesthetic solutions. Increasingly, men and younger demographics such as Gen Z are entering the market, reinforcing that dermal fillers are no longer limited to middle-aged women but are becoming part of a wider preventive and lifestyle-driven beauty ecosystem.
KEY TAKEAWAYS
- The North America derma fillers market accounted for a 42.2% revenue share in 2024.
- By product type, synthetic dermal fillers segment is expected to register the highest CAGR of 17.3%.
- By brand, the Juvederm is expected to dominate the market with a share of 31.5% in 2024.
- By procedure, the skin rejuvenation segment is expected to hold the largest share of 34.0% in 2024.
- By end user, the dermatology clinics & hospitals segment will grow the fastest with CAGR of 12.6% during the forecast period.
- Company AbbVie Inc., Galderma and Revance were identified as some of the star players in derma fillers market (global), given their strong market share and products footprint.
- Companies Prollenium Medical Technologies, Cytophil,Inc., and Tiger Aesthetics, among others, have distinguished themselves among startups and SMEs by securing strong footholds in specialized niche areas, underscoring their potential as emerging market leaders
One of the most important trends shaping the dermal fillers market is the integration of aesthetic procedures into lifestyle and wellness routines. Fillers are increasingly being adopted as “prejuvenation” treatments, where younger individuals seek early interventions to maintain their appearance and delay signs of aging. The rise of medical tourism is another significant growth driver, with patients traveling to hubs such as Turkey, South Korea, and the UAE for cost-effective procedures bundled with luxury wellness experiences. Digitalization is also reshaping the patient journey, as AI-powered facial mapping, AR-based consultations, and tele-aesthetic platforms enhance personalization and trust. Social media influencers and celebrity culture continue to play a pivotal role in setting beauty trends, directly translating into spikes in demand for specific procedures such as lip augmentation and jawline sculpting. The growing acceptance of aesthetic medicine across demographics and geographies is pushing dermal fillers further into the mainstream.
TRENDS & DISRUPTIONS IMPACTING CUSTOMERS' CUSTOMERS
Customers’ businesses, such as dermatology clinics, plastic surgeons, and medical spas, are being shaped by technology-led disruptions and shifting consumer behaviors. Combination therapies that integrate fillers with Botox, RF microneedling, or thread lifts are becoming increasingly popular, enabling providers to deliver holistic facial rejuvenation packages that boost procedure value and patient retention. Younger consumers, especially Gen Z, are redefining demand patterns by seeking subtle, natural enhancements tailored to their unique features rather than conventional anti-aging treatments. To address affordability concerns, many clinics are adopting subscription-based membership models that spread the cost of repeat treatments over time, making fillers more accessible and predictable as lifestyle expenditures. Non-injectable alternatives, such as energy-based devices and bioactive skincare, are emerging as competitive disruptors, challenging providers to differentiate filler-based treatments through outcomes, safety, and patient experience. However, the rise of unregulated practitioners, particularly in emerging economies, has heightened concerns about procedural safety and clinical complications. Counterfeit and black-market fillers represent 15–20% of injections in some European markets. This has led to increasing regulatory scrutiny and demand for standardized training and accreditation frameworks.

Source: Secondary Research, Interviews with Experts, MarketsandMarkets Analysis
MARKET DYNAMICS
Level
-
Increasing adoption of minimally invasive and non-invasive aesthetic procedures

-
Growing demand for aesthetic treatments among elderly and men

Level
-
Risk of infection and safety concerns

-
Complex regulatory framework and compliance standards

Level
-
Growth opportunities in emerging markets

-
Launch of new technologies and products

Level
-
High cost of treatments and devices

-
Social and cultural barriers

Source: Secondary Research, Interviews with Experts, MarketsandMarkets Analysis
Driver: Rising demand for cosmetic enhancements
The dermal fillers market is heavily driven by the evolution of cosmetic enhancements into lifestyle choices. Fillers are considered part of a broader self-care routine, complementing fitness, skincare, and wellness practices. They allow consumers to achieve subtle yet meaningful improvements that align with their individual aesthetic ideals. Quick and minimally invasive procedures are particularly attractive to younger consumers who wish to maintain a youthful look without undergoing disruptive surgical interventions. Gen Z in particular favors personalized, preventive treatments that preserve rather than restore beauty, reinforcing the shift of fillers from corrective solutions to routine, ongoing maintenance. This cultural and generational shift has firmly embedded dermal fillers into modern beauty consumption.
Restraint: Need of multi-procedure regimens
Despite their popularity, dermal fillers face limitations due to the need for multi-procedure regimens. Most fillers have a duration of 6 to 18 months, necessitating regular touch-ups every 9 to 12 months. The recurring nature of treatments adds a significant financial burden, with follow-up procedures costing 20–40% of the initial expense. This limits adoption among cost-sensitive patients and creates a sense of treatment fatigue. While newer cross-linked HA formulations with extended durability of up to two years are entering the market, widespread reliance on short-duration products remains a restraint. The market also faces logistical challenges, such as the need for highly trained injectors, which can restrict accessibility in certain regions and slow broader adoption.
Opportunity: Expanding to new indications to diversify product use
The expansion of dermal fillers into new indications presents one of the most promising opportunities for market growth. Fillers are being explored for hand rejuvenation, jawline contouring, acne scar reduction, and post-surgical corrections such as scar treatment and HIV-associated lipoatrophy. These newer applications broaden the addressable patient pool and blur the line between purely cosmetic and medically adjacent uses, opening the door for future reimbursement considerations. Changing consumer needs, particularly the demand for natural, minimally invasive solutions, are encouraging manufacturers to diversify their portfolios with innovative filler types, hybrid products, and procedures tailored to specific anatomical areas. As a result, dermal fillers are evolving into a versatile solution for aesthetic and functional enhancements, providing manufacturers and providers with multiple avenues for expansion.
Challenge: Complications in unregulated segments
The dermal fillers market experiences the proliferation of unregulated segments, particularly in emerging economies. Inconsistent training standards, the prevalence of counterfeit products, and unauthorized practitioners create significant risks of complications, leading to negative publicity and undermining consumer confidence. In Europe, 15–20% of procedures are estimated to be performed using black-market or non-approved products, posing serious safety concerns. Moreover, competition from adjacent categories, such as energy-based devices and advanced skincare solutions, is forcing providers to justify the value proposition of injectables through better patient outcomes and service differentiation. Addressing these challenges requires stronger regulatory frameworks, improved accreditation systems for practitioners, and sustained consumer education to safeguard patient safety while ensuring market integrity.
derma fillers market: COMMERCIAL USE CASES ACROSS INDUSTRIES
| COMPANY | USE CASE DESCRIPTION | BENEFITS |
|---|---|---|
 |
Provides dermal filler treatments (anti-aging, facial contouring, rejuvenation) in medical spa settings | Increased client acquisition/retention, premium positioning, recurring revenue via maintenance treatments |
 |
Provides minimally invasive cosmetic treatments to enhance facial volume, reduce wrinkles, and improve skin appearance | Non-surgical alternatives reduce surgical load and enhances patient wellness and confidence post-medical treatments |
 |
Integrates dermal fillers with spa & beauty services as a gateway to premium skincare and cosmeceuticals | Trend alignment with consumer demand for minimally invasive enhancements and cross-selling of medical-grade skincare post-filler care |
 |
Provides non-invasive treatments as alternatives to surgery, serving actors, models, and influencers seeking on-demand rejuvenation | Enhances brand credibility, word-of-mouth marketing, and strong presence in celebrity-driven culture |
Logos and trademarks shown above are the property of their respective owners. Their use here is for informational and illustrative purposes only.
MARKET ECOSYSTEM
The market ecosystem of dermal filler products is anchored by global leaders such as AbbVie (Juvederm), Ipsen, Galderma (Restylane), Revance (RHA Collection), and Teoxane, which collectively dominate the supply landscape with extensive product portfolios, strong clinical trial pipelines, and physician training programs. Surrounding this core, regional players and emerging biotech companies are developing differentiated products targeting niche indications and a longer duration of effect. On the delivery side, dermatology clinics and hospitals remain the backbone of filler adoption, but a fast-expanding network of medical spas, chain aesthetics clinics (e.g., Ideal Image, LaserAway), and tele-aesthetic platforms is broadening accessibility. This multi-tiered ecosystem illustrates how product innovation, service delivery models, and consumer behavior are tightly interlinked in driving the industry’s momentum.

Logos and trademarks shown above are the property of their respective owners. Their use here is for informational and illustrative purposes only.
MARKET SEGMENTS

Source: Secondary Research, Interviews with Experts, MarketsandMarkets Analysis
Derma Fillers Market, By Product
The dermal fillers ecosystem is shifting from traditional single-function HA fillers toward more advanced and diversified product categories. Hyaluronic acid fillers continue to dominate the global market, driven by their safety, reversibility, and versatility. However, there is a marked increase in the uptake of biostimulator fillers/synthetic fillers such as calcium Hydroxylapatite (CaHA) and poly-L-lactic acid (PLLA), which deliver longer-lasting results through collagen stimulation. These products appeal to patients seeking durability and natural regeneration rather than temporary volume enhancement. Hybrid fillers that combine HA with stimulatory compounds are emerging as premium offerings, particularly from European innovators, such as Teoxane and Revance, creating a differentiated tier within the market. Collagen-based fillers are experiencing a revival, supported by natural-sourced positioning and younger consumer preference for biocompatibility. Overall, product category trends reflect a movement toward longer duration, regenerative capabilities, and hybridized solutions, with global leaders investing heavily in pipeline innovation while regional players compete through niche formulations and localized sourcing.
Derma Fillers Market, By Procedure
The application landscape for dermal fillers is broadening beyond traditional facial rejuvenation into new territories that expand the addressable patient base. Lip augmentation and cheek volumization remain core, but hand rejuvenation is emerging as a high-growth application in North America and Europe, where older demographics are seeking comprehensive anti-aging solutions. Jawline and chin contouring, strongly influenced by social media aesthetics, are gaining popularity among younger patients in the Asia Pacific and Latin America. Scar treatment, particularly acne scars and post-surgical corrections, offers minimally invasive alternatives to surgical approaches and appeals to younger and therapeutic patient segments. The trend toward emerging applications signals a strategic shift from purely cosmetic enhancements to a wider blend of lifestyle, corrective, and therapeutic procedures, offering opportunities for both manufacturers and providers to broaden their portfolios and capture new demand streams.
Derma Fillers Market, By End User
The end-user landscape for dermal fillers is increasingly diversified, reflecting consumer preferences and evolving care delivery models. Dermatology and plastic surgery clinics remain the anchor of the market, performing high-complexity procedures and driving adoption of premium filler brands such as AbbVie’s Juvederm or Galderma’s Restylane. However, the medical spas segment is the fastest-growing, particularly in North America and Europe, where younger patients prefer convenient, affordable, and socially normalized treatment environments. These settings are increasingly supported by franchise and chain-based models such as Ideal Image, LaserAway, and Kaya Skin Clinics, which use standardized protocols and bundled services to expand access at scale. Hospitals play a role in reconstructive applications and post-surgical corrections, particularly in Europe and Asia. Emerging digital platforms that connect patients with certified injectors through teleconsultation and booking services are creating a new access channel, particularly in markets such as South Korea and India, where younger demographics dominate demand. This diversification of end users shows that fillers are no longer confined to elite clinics but are spreading through an ecosystem of medical, spa-based, and digital-first providers, expanding reach and normalizing adoption.
REGION
The US to dominate the North American derma fillers market in 2025
The US holds the largest share of the North American derma fillers market, since consumers are becoming more inclined toward non-surgical cosmetic methods to treat facial rejuvenation, restore volume, and treat wrinkles. North America represents the most mature and lucrative dermal fillers ecosystem, driven by strong consumer demand, advanced clinical infrastructure, and sustained innovation from market leaders. AbbVie’s Juvederm portfolio, Galderma’s Restylane line, and Revance’s RHA Collection dominate the competitive landscape, supported by robust physician training programs and FDA-cleared product pipelines. Consumer behavior in the region is heavily shaped by social media and celebrity culture, fueling demand for lip augmentation, cheek volumization, and Instagram aesthetics such as jawline sculpting. Medical spas and chain aesthetics providers are growing rapidly, introducing subscription-based models that align with consumers' willingness to spread out treatment costs. Male adoption is higher in North America than in most other regions, reflecting increasing acceptance of subtle cosmetic enhancements among professional and millennial men. Overall, the North American dermal fillers ecosystem reflects a highly consolidated supply base, a digitally influenced consumer base, and an expanding provider base, which reinforce its position as the global benchmark for aesthetics markets.

derma fillers market: COMPANY EVALUATION MATRIX
The dermal fillers market is highly competitive and dominated by global leaders alongside a growing base of regional innovators and niche players. AbbVie, through its Allergan Aesthetics division, holds the most extensive portfolio globally with its Juvederm family. Its strategy of bundling Juvederm with Botox has created a powerful integrated aesthetics offering, supported by FDA approvals, physician training programs, and large-scale consumer marketing campaigns. Galderma is its closest rival, with the Restylane family complemented by Sculptra, a leading poly-L-lactic acid (PLLA) filler. The company has positioned itself strongly in Europe and increasingly in Asia, differentiating on both breadth and innovation, particularly in biostimulatory products that deliver long-lasting collagen stimulation. Revance is an emerging challenger in the US, carving out a premium niche with its RHA Collection, which offers resilient hyaluronic acid technology. The company focuses on competing with AbbVie in the US through differentiated technology and premium branding, often appealing to younger and high-income patients seeking natural results with longer duration. Teoxane is expanding its footprint globally with the Teosyal line, including RHA-based and hybrid fillers. The company has successfully positioned itself as a premium boutique brand, appealing to practitioners and consumers who prioritize innovation and subtlety over mass-market adoption.

Source: Secondary Research, Interviews with Experts, MarketsandMarkets Analysis
KEY MARKET PLAYERS
- Allergan Aesthetics (US)
- Merz Pharma KGaA (Germany)
- Galderma (Switzerland)
- Sinclair Pharma (UK)
- Bioxis Pharmaceutical (France)
- Suneva Medical (US)
- Croma Pharma (Austria)
- Prollenium Medical Technologies (Canada)
- Dermax Med (China)
- Zimmer Aesthetics (Germany)
- Marllor Biomedical (Italy)
- MEDYTOX (South Korea)
- Revance Therapeutic (US)
- Dr. Korman Pharma (Israel)
- BioScience GmbH (Germany)
MARKET SCOPE
| REPORT METRIC | DETAILS |
|---|---|
| Market Size in 2024 (Value) | USD 3.74 Billion |
| Market Forecast in 2030 (value) | USD 7.32 Billion |
| Growth Rate | 12.1% |
| Years Considered | 2023–2030 |
| Base Year | 2024 |
| Forecast Period | 2025–2030 |
| Units Considered | Value (USD billion), Volume (Procedure) |
| Report Coverage | Revenue forecast, company ranking, competitive landscape, growth factors, and trends |
| Segments Covered |
|
| Regions Covered | North America, Asia Pacific, Europe, Latin America, Middle East & Africa |
WHAT IS IN IT FOR YOU: derma fillers market REPORT CONTENT GUIDE
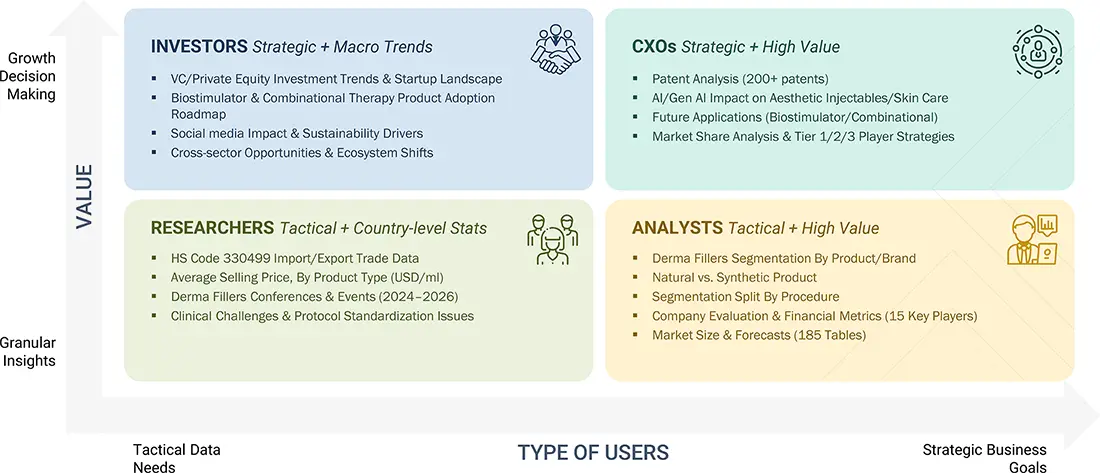
DELIVERED CUSTOMIZATIONS
We have successfully delivered the following deep-dive customizations:
| CLIENT REQUEST | CUSTOMIZATION DELIVERED | VALUE ADDS |
|---|---|---|
| Leading Medical Aesthetic Company |
|
|
| Medical Aesthetic Manufacturer |
|
|
RECENT DEVELOPMENTS
- January 2024 : Galderma has received regulatory approval for Restylane SHAYPE, a hyaluronic acid injectable that enhances the chin area, providing a bone-like effect for shaping the lower face. Using NASHA HD technology, it offers natural-looking, long-lasting results for up to 12 months.
- August 2024 : Galderma partnered with L’Oréal Group for dermatological R&D, targeting advanced anti-aging solutions. L’Oréal also secured a 10% stake in Galderma, reinforcing its collaborative growth focus.
- September 2024 : Ultherapy PRIME by Merz Pharma is a cutting-edge, FDA-cleared ultrasound platform offering personalized, non-invasive skin lifting with zero recovery time. Featuring advanced real-time imaging and enhanced efficiency, it ensures long-lasting outcomes and improved workflows.
Table of Contents
 Exclusive indicates content/data unique to MarketsandMarkets and not available with any competitors.
Methodology
The size of the derma fillers market was based on four primary studies to ensure accuracy. Initial data for the derma fillers market and related sectors was gathered from 3 to 5 secondary sources. This information was then validated through primary research to confirm the assumptions and overall market sizing. Both top-down and bottom-up approaches were employed to determine the total market size, which was subsequently refined into segment and subsegment sizes. Finally, data triangulation was conducted to verify the accuracy of the findings.
Secondary Research
Secondary research sources included directories, Factiva, white papers, Bloomberg Business, annual reports, SEC filings, business filings, and investor presentations. These sources offered valuable insights into market leaders, sector divisions, and technological differences within various segments of the derma fillers industry.
Primary Research
Primary research consisted of quantitative and qualitative insights gathered through interviews with key stakeholders. On the demand side, participants included physicians, researchers, department heads, and staff from diagnostic centers, hospitals, and research institutes. On the supply side, interviews were conducted with CEOs, area sales managers, territory and regional sales managers, and other top executives from relevant companies. These direct conversations helped validate the findings from secondary research and provided an opportunity to directly question and confirm assumptions.
A breakdown of the primary respondents is provided below.

Note 1: Others include sales managers, marketing managers, business development managers, product managers, distributors, and suppliers.
Note 2: Companies are classified into tiers based on their total revenue. As of 2024, Tier 1 = >USD 1 billion, Tier 2 = < USD 500 million, and Tier 3 = < USD 100 million.
To know about the assumptions considered for the study, download the pdf brochure
Market Size Estimation
This report utilized the revenue share analysis of major companies to evaluate the size of the global derma fillers market. This analysis involved identifying key market participants and calculating their revenue from derma fillers using a variety of data collected during both primary and secondary research phases. One aspect of the secondary research included reviewing the annual and financial reports of leading market players. Conversely, primary research consisted of detailed interviews with influential thought leaders, including directors, CEOs, and key marketing executives.
To determine the overall market value, the segmental revenue was calculated by mapping the revenue of the leading solution and service providers. The process involved several steps.
- Making a list of leading international companies in the derma fillers industry
- Charting annual profits made by leading companies in the derma fillers sector (or the closest stated business unit/product category)
- 2024 revenue mapping of leading companies to cover a significant portion of the global market
- Calculating the global value of the derma fillers industry
Global Derma Fillers Market: Bottom-up and Top-down Approaches

Data Triangulation
To ensure accurate data, the derma fillers market was divided into various segments and subsegments. A data triangulation process that used both top-down and bottom-up approaches was applied. This involved analyzing factors and trends from both the demand and supply sides to validate the findings for each segment. The combination of this segmentation with the triangulation process helps ensure that the market data is both accurate and reliable.
Market Definition
Derma fillers are gel-like injectable products that temporarily restore volume to the face, smooth fine lines and wrinkles, and enhance facial contours for a more youthful look. The procedure is quick, safe, and minimally invasive. Filling agents are injected just below the skin by a healthcare professional. Derma fillers are commonly used to treat signs of aging, correct facial asymmetries, and improve the appearance of scars and hollow wells or document delay areas.
Dermal fillers are derived from various materials, including hyaluronic acid, calcium hydroxylapatite, and poly-l-lactic acid. They are injected into the tissue of the face, lips, or hands to restore volume and provide enhancement. Results are instantaneous, and they last anywhere from a few months to years, depending upon the dermal filler used and the treatment area.
Stakeholders
- Manufacturers of derma fillers.
- Healthcare providers such as hospitals, dermatology clinics, beauty centers, and medical spas
- Patients using derma fillers for various conditions
- Healthcare professionals, including dermatologists, surgeons, and aesthetic practitioners
- Insurance companies are involved in reimbursement and coverage
- Regulatory bodies oversee product standards and safety
- Suppliers and distributors of derma filler products
- Research & development firms focusing on innovation and technology in derma fillers
Report Objectives
- To define, describe, and forecast the derma fillers market based on brand, product, procedure, end user, and region
- To provide detailed information regarding the major factors influencing the growth of the market (drivers, restraints, opportunities, and industry-specific challenges)
- To strategically analyze micromarkets with respect to individual growth trends, prospects, and contributions to the total market
- To analyze opportunities in the market for stakeholders and provide details of the competitive landscape for market leaders
- To forecast the revenue of the market segments with respect to five regions: North America, Europe, the Asia Pacific, Latin America, and the Middle East & Africa
- To profile the key players and comprehensively analyze their market ranking and core competencies
- To benchmark players within the market using a proprietary Company Evaluation Matrix framework, which analyzes market players on various parameters within the broad categories of business strategy excellence and strength of product portfolio
- To analyze competitive developments such as product launches, agreements, expansions, collaborations, and acquisitions in the derma fillers market
Key Questions Addressed by the Report
What will be the addressable market value of the global derma fillers market within five years?
The global derma fillers market is projected to reach USD 7.32 million by 2030 from USD 4.13 million in 2025, at a CAGR of 12.1%.
Which product segments have the highest potential for growth in the derma fillers market?
Natural dermal fillers are expected to exhibit the highest growth rate.
Who are the top three market players, and what is the current market landscape?
The leading companies in the market are Allergan Aesthetics (US), Merz Pharma KGaA (Germany), and Galderma (Switzerland). The market is moderately consolidated, with the top players holding 70–75% of the market share.
What are the major strategies adopted by leading players to enter emerging regions?
Distribution agreements, partnerships, product launches, and product approvals represent the major growth strategies adopted by major market players.
What are the emerging trends in the global derma fillers market?
New trends include an emphasis on natural and subtle results, growing popularity among younger patients, expansion of biostimulatory fillers, technological advancements, sustainability, combination treatments, expanded indications, and the constant development of new products.
What are the major factors likely to hamper the growth of the derma fillers market?
Factors include strict regulatory requirements, treatment costs, safety or ethical concerns, availability of qualified practitioners, temporary effects, and limited access or affordability in some regions.
Need a Tailored Report?
Customize this report to your needs
Get 10% FREE Customization
Customize This ReportPersonalize This Research
- Triangulate with your Own Data
- Get Data as per your Format and Definition
- Gain a Deeper Dive on a Specific Application, Geography, Customer or Competitor
- Any level of Personalization
Let Us Help You
- What are the Known and Unknown Adjacencies Impacting the Derma Fillers Market
- What will your New Revenue Sources be?
- Who will be your Top Customer; what will make them switch?
- Defend your Market Share or Win Competitors
- Get a Scorecard for Target Partners

Custom Market Research Services
We Will Customise The Research For You, In Case The Report Listed Above Does Not Meet With Your Requirements
Get 10% Free CustomisationTESTIMONIALS

JAYANT RAJPUROHIT
Director of Market Insights, Data and Analytics
SFI Health,
Leading Pharmaceutical Companywww.sfihealth.com/

We at SFI Health approached MarketsandMarkets for an Opportunity Assessment on "Incidence and Prevalence of Focus Indications" as we wanted to know the most attractive HCPs like Physician, Functional MD, Naturopath and Pharmacist. The project was critical for us to ensure our focus on the right target which would enable sustainable growth and profitability for SFI Health. The business insights provided exceeded our expectations and we were extremely impressed. The team at MarketsandMarkets is highly professional and detail oriented and very well understood our business needs. MarketsandMarkets offers a unique combination of expertise and dedicated engagement model. We identified 2 new products to be launched in coming months, based on the research findings provided by MarketsandMarkets. We are happy with the services and would strongly recommend MarketsandMarkets to my peers in the industry.

BEATRIZ DE LA CALLE
Head of Commercial Analytics
Qualicaps,
Leading Pharmaceutical Companywww.qualicaps.com/

We partnered with MarketsandMarkets for an assessment study on hard empty capsules. The team was extremely professional in understanding our business requirements and we received timely responses to all our queries. The market intelligence and the recommendations has met our business requirements. We were extremely impressed to see the final study results; it really exceeded our expectations. The market intelligence offered by MarketsandMarkets, and clarity on next steps will help us achieve our business objective for the Year 2021. We are happy with the services and would strongly recommend MarketsandMarkets to my peers in the industry.

Bob Williams,
Senior Director Business Development & Innovation
Bracco Diagnostics Inc.,
Italian Multinational in life sciences sector and a World Leader in imaging diagnosticsimaging.bracco.com/us-en
We were pleased with targeted insights that MarketsandMarkets identified from a custom study on the 'Radiation Dose Management Solutions Market'. Your team identified and characterized the market participants as well as underlying trends accurately. This study was useful to Bracco in formulating business strategies for our dose monitoring product lines and we thank MarketsandMarkets for the job well done.
Cody Coonradt,
Market Development and Strategy Manager
3M Health Information Systems,
Leader in Health care Coding, Payment & Analytics Solutions.www.3m.com/3M/en_US/health-information-systems-us
The value for our organization comes from three things: depth of research, specificity of segments and being easy to work with. As important as the first two are, the third can't be underestimated. MarketsandMarkets, maybe more than any other research vendor, wants to know what is top of mind for our team and what big questions we are grappling to answer.
Their customer first approach and high value engagement model, have given us great analysis and excellent value for money


Growth opportunities and latent adjacency in Derma Fillers Market