Digital Twins in Healthcare Market

Digital Twins in Healthcare Market by Component (Software, Services), Application (Personalized Medicine, Drug Discovery, Medical Education, Workflow Optimization), End User (Providers, Research & Academia, Payers), and Region - Global Forecast to 2028

Report Code: HIT 8675 Jun, 2023, by marketsandmarkets.com

The global digital twins in healthcare market in terms of revenue was estimated to be worth $1.6 billion in 2023 and is poised to reach $21.1 billion by 2028, growing at a CAGR of 67.0% from 2023 to 2028. The new research study consists of an industry trend analysis of the market. The new research study consists of industry trends, pricing analysis, patent analysis, conference and webinar materials, key stakeholders, and buying behaviour in the market. The rising demand of technologically advanced solutions and the growing emphasis of digital twin technology supporting various healthcare applications are some of the critical factors offering opportunities to the market.

However, lack of technical expertise and data management issues are key factors challenging the growth of the market.

Digital Twins in Healthcare Market

To know about the assumptions considered for the study, Request for Free Sample Report

Digital Twins in Healthcare Market

Digital Twins in Healthcare Market Dynamics

Driver: Increasing investments in digital twin technology by public and private entities

In recent years, there has been a growing interest in digital twin technology, it is a concept that involves creating a virtual replica of a physical object, system, or process. Technology has a wide range of applications across industries, including manufacturing, healthcare, construction, and infrastructure management. As a result, both public and private entities have been increasing their investments in digital twin technology, recognizing its potential to drive innovation and improve operational efficiency. 'Digi Twins' is a European flagship project launched in 2018 with over 200 partners from 32 countries working together. These partners include universities, research institutes, hospitals, and technology companies. Key partners involved in the project include Siemens, Philips, Fraunhofer Institute, Technical University of Munich, Imperial College London, Karolinska Institute. It has received USD 1,180 million in funding over 10 years. This project aimed to develop personalized healthcare and prevention strategies based on the idea of a 'virtual patient'. Similarly, in October 2021, Twin Health, a company that makes technology called Whole Body Digital Twin to improve healthcare, received USD 140 million in Series C funding. Unlearn is a company from the US that created a machine-learning platform called DiGenesis. The investments made by both public and private sectors will help accelerate the development and adoption of digital twins’ technology. Creating new opportunities in the healthcare industry will boost the market growth in the coming years.

Restraint: Managing data quality and privacy issues and high implementation costs

Technology that involves collecting and analyzing sensitive data has concerns about data quality and privacy. Data is collected from multiple sources, including electronic health records, wearables, and other medical devices. Then it is integrated into the digital twins in a consistent, reliable, and secure way. Without high-quality data, the accuracy and reliability of the digital twin are compromised, which can impact patient care and treatment outcomes. Another critical concern is data privacy. To avoid privacy issues, organizations should adopt robust data governance frameworks and security protocols to ensure the accuracy, reliability, and security of patient data.

Implementing digital twins’ technology can be costly due to acquiring the necessary hardware, software, and data storage systems. As technology matures and becomes more widely adopted, it is expected that costs may decrease over time. The aforementioned factors are expected to impact market growth to a certain extent.

Opportunity: Increasing focus on cutting-edge real-time data analytics

Digital twins generate vast amounts of data that can be analyzed in real-time to provide insights into patient health, resource utilization, and operational efficiency. For example, a hospital's digital twins can collect and analyze real-time data from various sources, including medical devices, electronic health records, and IoT sensors, to detect potential equipment failures, predict patient outcomes, and identify areas of operational inefficiency. Real-time data analytics can also help healthcare providers make informed treatment plans, resource allocation, and patient care decisions. The base of the complete digital twins technology is data analytics. Once established, digital twins and analytics will provide more accurate diagnostics, and optimal and predictive operations. These advancements have facilitated digital twins technology in healthcare, which is expected to create potential in the coming years.

Challenge: Lack of technical expertise and data management issues

Implementing and maintaining digital twin technology in healthcare requires specialized skills and knowledge in areas such as data science, software engineering, and machine learning. Adapting to this nascent technology is challenging, especially in the healthcare field, with large unstructured data repositories. Without enough skilled professionals to design, implement, and maintain digital twins’ technology, healthcare organizations may face delays, higher costs, and limited access to the benefits of this technology. To address this challenge, healthcare organizations can invest in training and education programs for their existing workforce and collaborate with academic institutions to develop specialized training programs to meet the growing demand for skilled professionals in this field.

Digital Twin in Healthcare Market Ecosystem

The ecosystem market map of the overall market comprises the elements present in this market and defines these elements with a demonstration of the bodies involved. It includes products and services. The manufacturers of various products include the organizations involved in the entire process of research, product development, optimization, and launch. The services are offered to end-users by vendors either directly or in collaboration with a third party.

Research and product development includes in-house research facilities, contract research organizations, and contract development and manufacturing organizations, which play a key role in outsourcing services for product development.

Digital Twins in Healthcare Market Ecosystem

Source: Secondary Literature, Interviews with Experts, and MarketsandMarkets Analysis

Personalized Medicine segment of Digital Twins in Healthcare Industry is expected to register the significant share by the application during the forecast period

The personalized medicine segment of Digital Twins in Healthcare Market is expected to register a significant share by the application during the forecast period. The growth of personalized medicine is driven by its ability to improve treatment efficacy, minimize adverse effects, and enhance patient outcomes. Advancements in genomics, molecular diagnostics, and precision medicine have further fueled the demand for digital twin solutions in personalized medicine, leading to significant market growth.

Healthcare Providers segment accounted for a considerable share in the digital twins in healthcare industry, by the end user in 2022

In 2022, the healthcare providers segment accounted for a significant share of the digital twins in healthcare market. The large share of this segment can be attributed to the enhanced diagnostic capabilities of the hospitals enabling more precise disease diagnosis, better and in-time medications, data-driven decision-making, and the increasing adoption of telehealth & telemedicine in healthcare.

North America dominated the digital twins in healthcare industry in 2022

North America accounted for the largest share of the digital twins in healthcare market. The large share of North America can be attributed to the increasing government funding & investments for digital twin and a growing number of digital twin companies catering to the healthcare industry in the region.

Digital Twins in Healthcare Market by Region

To know about the assumptions considered for the study, download the pdf brochure

Prominent companies in this market include Siemens Healthineers AG (Germany), Dassault Systèmes (France), Microsoft (US), Koninklijke Philips N.V. (Netherlands), Faststream Technologies (US), Twin LTD (US), IBM (US), NVIDIA Corporation (US), GE Healthcare (US), NUREA (France), ANSYS, Inc. (US), Rescale, Inc. (US), Predictiv (US), Verto Health (Canada), PrediSurge (France), Qbio (US), Virtonomy GmbH (Germany), Unlearn AI (US), Atos SE (France), ThoughtWire (Canada), Amazon Web Services, Inc.(US), Oracle(US), PTC (US), SAP (Germany), Sim and Cure (France).

Scope of the Digital Twins in Healthcare Industry

Report Metric 

Details 

Market Revenue in 2023

$1.6 billion

Projected Revenue by 2028

$21.1 billion

Revenue Rate

Poised to Grow at a CAGR of 67.0%

Market Driver

Increasing investments in digital twin technology by public and private entities

Market Opportunity

Increasing focus on cutting-edge real-time data analytics

The study categorizes the digital twins in healthcare market to forecast revenue and analyze trends in each of the following submarkets:

By Component

  • Software
  • Services

By Application

  • Drug Discovery & Development
  • Personalized medicine
  • Surgical Planning and Medical Education
  • Medical Device Design and Testing
  • Healthcare Workflow Optimization & Asset Management
  • Others

By End User

  • Pharma & Bio-pharma companies
  • Research & Academia
  • Providers
  • Medical device Companies
  • Others

By Region

  • North America
    • US
    • Canada
  • Europe
    • Germany
    • France
    • UK
    • RoE
  • Asia Pacific
    • Japan
    • China
    • RoAPAC
  • Rest of the World

Recent Developments of Digital Twins in Healthcare Industry

  • In April 2023, Oracle (US) collaborated with Deloitte (UK), This collaboration focuses on modernizing electronic health records, optimizing operations, and leveraging AI-driven insights to deliver a patient-centric, future-ready healthcare delivery system. By combining Deloitte's industry expertise with Oracle's technology portfolio, they aim to meet the evolving needs of the healthcare industry and improve operational efficiency.
  • In July 2022, PTC (US) formed an allince with Schaeffler (Germany), through this, Schaeffler will use PTC technologies to create an integrated, end-to-end IT landscape as part of a new strategic alliance. PTC's efforts to further develop and evolve market-specific standard solutions to better satisfy the demands of automotive and industrial companies would benefit from Schaeffler's input. The new partnership will expand on Schaeffler's strong twenty-year relationship with PTC, which began with Schaeffler's adoption of PTC's CAD and PLM products. These tools are critical for introducing and developing Schaeffler's digital twin initiatives and visualizing 3D models (such as those utilized in augmented reality projects).
  • In March 2022 Microsoft (US) partnered with Johnson & Johnson (US), This collaboration aims to develop a new digital surgical platform using Azure Digital Twins technology which will enable surgeons to create a digital twin of a patient's anatomy to plan and practice surgeries

Frequently Asked Questions (FAQ):

To speak to our analyst for a discussion on the above findings, click Speak to Analyst

TABLE OF CONTENTS
 
1 INTRODUCTION (Page No. - 24)
    1.1 STUDY OBJECTIVES 
    1.2 MARKET DEFINITION 
          TABLE 1 INCLUSIONS & EXCLUSIONS
    1.3 STUDY SCOPE 
          FIGURE 1 DIGITAL TWINS IN HEALTHCARE MARKET SEGMENTATION
           1.3.1 DIGITAL TWINS IN HEALTHCARE INDUSTRY, BY REGION
           1.3.2 YEARS CONSIDERED
    1.4 CURRENCY 
          TABLE 2 EXCHANGE RATES UTILIZED FOR CONVERSION TO USD
    1.5 STAKEHOLDERS 
    1.6 LIMITATIONS 
    1.7 IMPACT OF RECESSION 
 
2 RESEARCH METHODOLOGY (Page No. - 28)
    2.1 RESEARCH APPROACH 
          FIGURE 2 RESEARCH DESIGN
           2.1.1 SECONDARY RESEARCH
                    2.1.1.1 Key data from secondary sources
           2.1.2 PRIMARY RESEARCH
                    FIGURE 3 PRIMARY SOURCES
                    2.1.2.1 Key data from primary sources
                    2.1.2.2 Breakdown of primaries
                                FIGURE 4 BREAKDOWN OF PRIMARY INTERVIEWS: BY COMPANY TYPE, DESIGNATION, AND REGION
                    2.1.2.3 Insights from primary experts
    2.2 MARKET SIZE ESTIMATION 
          FIGURE 5 BOTTOM-UP APPROACH
          FIGURE 6 TOP-DOWN APPROACH
          FIGURE 7 CAGR PROJECTIONS FROM ANALYSIS OF MARKET DRIVERS, RESTRAINTS, OPPORTUNITIES, AND CHALLENGES OF DIGITAL TWINS IN HEALTHCARE INDUSTRY
          FIGURE 8 CAGR PROJECTIONS: SUPPLY-SIDE ANALYSIS
    2.3 MARKET BREAKDOWN DATA TRIANGULATION 
          FIGURE 9 DATA TRIANGULATION METHODOLOGY
    2.4 MARKET SHARE ESTIMATION 
    2.5 STUDY ASSUMPTIONS 
    2.6 RESEARCH LIMITATIONS 
           2.6.1 METHODOLOGY-RELATED LIMITATIONS
    2.7 RISK ASSESSMENT 
          TABLE 3 RISK ASSESSMENT: MARKET
    2.8 IMPACT OF RECESSION ON MARKET 
 
3 EXECUTIVE SUMMARY (Page No. - 41)
    FIGURE 10 DIGITAL TWINS IN HEALTHCARE MARKET, BY COMPONENT, 2023 VS. 2028 (USD MILLION)
    FIGURE 11 DIGITAL TWINS IN HEALTHCARE INDUSTRY, BY APPLICATION, 2023 VS. 2028 (USD MILLION)
    FIGURE 12 MARKET, BY END USER, 2023 VS. 2028 (USD MILLION)
    FIGURE 13 GEOGRAPHICAL SNAPSHOT OF MARKET
 
4 PREMIUM INSIGHTS (Page No. - 45)
    4.1 DIGITAL TWINS IN HEALTHCARE MARKET OVERVIEW 
          FIGURE 14 INCREASING USE OF DIGITAL TWINS AND GROWING IMPORTANCE OF PATIENT-CENTRIC CARE IN HEALTHCARE TO DRIVE MARKET GROWTH
    4.2 ASIA PACIFIC: DIGITAL TWINS IN HEALTHCARE INDUSTRY, BY COMPONENT AND COUNTRY 
          FIGURE 15 SOFTWARE SEGMENT TO COMMAND LARGEST SHARE OF ASIA PACIFIC MARKET IN 2023
    4.3 GEOGRAPHIC SNAPSHOT OF MARKET 
          FIGURE 16 MARKET IN CHINA TO GROW AT HIGHEST CAGR DURING FORECAST PERIOD
    4.4 REGIONAL MIX: MARKET 
          FIGURE 17 ASIA PACIFIC TO WITNESS HIGHEST GROWTH DURING FORECAST PERIOD
    4.5 MARKET: DEVELOPED VS. DEVELOPING ECONOMIES 
          FIGURE 18 DEVELOPING ECONOMIES TO REGISTER HIGHER GROWTH RATES DURING FORECAST PERIOD
 
5 MARKET OVERVIEW (Page No. - 49)
    5.1 INTRODUCTION 
    5.2 MARKET DYNAMICS 
          FIGURE 19 DIGITAL TWINS IN HEALTHCARE MARKET: DRIVERS, RESTRAINTS, OPPORTUNITIES, AND CHALLENGES
          TABLE 4 MARKET DYNAMICS: MARKET
           5.2.1 MARKET DRIVERS
                    5.2.1.1 Increasing investments by public and private entities
                    5.2.1.2 Growing applications of digital twins
                    5.2.1.3 Technological advancements
                    5.2.1.4 Growing funding and investments in digital twin start-ups
           5.2.2 RESTRAINTS
                    5.2.2.1 Managing data quality, privacy issues, and high implementation costs
           5.2.3 OPPORTUNITIES
                    5.2.3.1 Increasing focus on cutting-edge real-time data analytics
                    5.2.3.2 Growing importance of digital twins in emerging economies
           5.2.4 CHALLENGES
                    5.2.4.1 Lack of skilled professionals
                    5.2.4.2 Integration with existing systems and outdated digital infrastructure
 
6 INDUSTRY INSIGHTS (Page No. - 54)
    6.1 INDUSTRY TRENDS 
           6.1.1 TRANSFORMATION IN CLINICAL TRIALS
           6.1.2 REVOLUTIONIZING MEDICAL TRAINING AND DIAGNOSTICS
           6.1.3 IMPROVING OPERATIONAL EFFICIENCY IN HOSPITALS
    6.2 TECHNOLOGY ANALYSIS 
           6.2.1 TECHNOLOGY STACK
                    FIGURE 20 DIGITAL TWIN TECHNOLOGIES
                    6.2.1.1 5G networks
                    6.2.1.2 Internet of Things
                    6.2.1.3 Cloud and edge computing
                    6.2.1.4 Blockchain
                    6.2.1.5 Augmented reality, virtual reality, and mixed reality
                    6.2.1.6 Artificial intelligence and machine learning
    6.3 PORTER’S FIVE FORCES ANALYSIS 
          FIGURE 21 MARKET: PORTER’S FIVE FORCES ANALYSIS
          TABLE 5 MARKET: PORTER’S FIVE FORCES ANALYSIS
           6.3.1 INTENSITY OF COMPETITIVE RIVALRY
           6.3.2 BARGAINING POWER OF SUPPLIERS
           6.3.3 BARGAINING POWER OF BUYERS
           6.3.4 THREAT OF NEW ENTRANTS
           6.3.5 THREAT OF SUBSTITUTES
    6.4 REGULATORY LANDSCAPE 
           6.4.1 REGULATORY BODIES, GOVERNMENT AGENCIES, AND OTHER ORGANIZATIONS
                    TABLE 6 NORTH AMERICA: REGULATORY BODIES, GOVERNMENT AGENCIES, AND OTHER ORGANIZATIONS
                    TABLE 7 EUROPE: REGULATORY BODIES, GOVERNMENT AGENCIES, AND OTHER ORGANIZATIONS
                    TABLE 8 ASIA PACIFIC: REGULATORY BODIES, GOVERNMENT AGENCIES, AND OTHER ORGANIZATIONS
                    TABLE 9 REST OF THE WORLD: REGULATORY BODIES, GOVERNMENT AGENCIES, AND OTHER ORGANIZATIONS
                    TABLE 10 MARKET: REGULATORY STANDARDS
    6.5 VALUE CHAIN ANALYSIS 
          FIGURE 22 VALUE CHAIN ANALYSIS (2022)
           6.5.1 PLANNING & REVISING FUNDS
           6.5.2 RESEARCH & DEVELOPMENT
           6.5.3 SOFTWARE DESIGN, FRAMEWORK, AND DEVELOPMENT
           6.5.4 PRODUCT/SOLUTION PROVIDERS
           6.5.5 END USERS AND AFTER-SALES SERVICE PROVIDERS
    6.6 ECOSYSTEM/MARKET MAP 
          FIGURE 23 MARKET: ECOSYSTEM
    6.7 PATENT ANALYSIS 
          FIGURE 24 NUMBER OF PATENTS PUBLISHED, JANUARY 2013 TO MARCH 2023
          FIGURE 25 TOP PATENT OWNERS IN MARKET
          TABLE 11 KEY PATENTS IN MARKET
    6.8 ADJACENT MARKET ANALYSIS 
          FIGURE 26 METAVERSE IN HEALTHCARE MARKET: MARKET OVERVIEW
    6.9 CASE STUDY ANALYSIS 
    6.10 KEY STAKEHOLDERS & BUYING CRITERIA 
           6.10.1 KEY STAKEHOLDERS IN BUYING PROCESS
                     FIGURE 27 INFLUENCE OF STAKEHOLDERS ON BUYING PROCESS
                     TABLE 12 INFLUENCE OF STAKEHOLDERS ON BUYING PROCESS (%)
           6.10.2 BUYING CRITERIA
                     FIGURE 28 KEY BUYING CRITERIA FOR DIGITAL TWIN COMPONENTS
                     TABLE 13 KEY BUYING CRITERIA FOR DIGITAL TWIN COMPONENTS
    6.11 KEY CONFERENCES & EVENTS, 2023–2024 
           TABLE 14 MARKET: DETAILED LIST OF CONFERENCES & EVENTS
    6.12 TRENDS/DISRUPTIONS IMPACTING BUYERS 
           FIGURE 29 MARKET: TRENDS/DISRUPTIONS IMPACTING BUYERS
 
7 DIGITAL TWINS IN HEALTHCARE MARKET, BY COMPONENT (Page No. - 78)
    7.1 INTRODUCTION 
          TABLE 15 DIGITAL TWINS IN HEALTHCARE INDUSTRY, BY COMPONENT, 2021–2028 (USD MILLION)
    7.2 SERVICES 
           7.2.1 INTRODUCTION OF COMPLEX SOFTWARE TO DRIVE DEMAND FOR SERVICES
                    TABLE 16 DIGITAL TWINS IN HEALTHCARE SERVICES MARKET, BY COUNTRY, 2021–2028 (USD MILLION)
    7.3 SOFTWARE 
           7.3.1 SHIFT TO WEB/CLOUD-BASED MODELS TO SUPPORT GROWTH
                    TABLE 17 KEY SOFTWARE SOLUTIONS OFFERED BY MARKET PLAYERS
                    TABLE 18 DIGITAL TWINS IN HEALTHCARE SOFTWARE MARKET, BY COUNTRY, 2021–2028 (USD MILLION)
 
8 DIGITAL TWINS IN HEALTHCARE MARKET, BY APPLICATION (Page No. - 83)
    8.1 INTRODUCTION 
          TABLE 19 DIGITAL TWINS IN HEALTHCARE INDUSTRY, BY APPLICATION, 2021–2028 (USD MILLION)
    8.2 DRUG DISCOVERY & DEVELOPMENT 
           8.2.1 ABILITY OF DIGITAL TWINS TO ENHANCE DRUG DISCOVERY & DEVELOPMENT TO BOOST MARKET
                    TABLE 20 MARKET FOR DRUG DISCOVERY & DEVELOPMENT, BY COUNTRY, 2021–2028 (USD MILLION)
    8.3 PERSONALIZED MEDICINE 
           8.3.1 QUICK AND COST-EFFECTIVE DEVELOPMENT AND TESTING OF PERSONALIZED DIAGNOSTICS TO SUPPORT MARKET
                    TABLE 21 MARKET FOR PERSONALIZED MEDICINE, BY COUNTRY, 2021–2028 (USD MILLION)
    8.4 SURGICAL PLANNING & MEDICAL EDUCATION 
           8.4.1 ABILITY OF DIGITAL TWINS TO ENHANCE SURGICAL TRAINING AND SIMULATE SURGICAL PROCEDURES TO BOOST ADOPTION
                    TABLE 22 MARKET FOR SURGICAL PLANNING & MEDICAL EDUCATION, BY COUNTRY, 2021–2028 (USD MILLION)
    8.5 MEDICAL DEVICE DESIGN & TESTING 
           8.5.1 POTENTIAL OF DIGITAL TWINS TO STREAMLINE OPERATIONS, MINIMIZE RISK, AND REDUCE DOWNTIME TO PROMOTE USE
                    TABLE 23 MARKET FOR MEDICAL DEVICE DESIGN & TESTING, BY COUNTRY, 2021–2028 (USD MILLION)
    8.6 HEALTHCARE WORKFLOW OPTIMIZATION & ASSET MANAGEMENT 
           8.6.1 ADVANTAGES SUCH AS IMPROVED EFFICIENCY AND VALUABLE INSIGHTS TO SUPPORT DEMAND
                    TABLE 24 MARKET FOR HEALTHCARE WORKFLOW OPTIMIZATION & ASSET MANAGEMENT, BY COUNTRY, 2021–2028 (USD MILLION)
    8.7 OTHER APPLICATIONS 
          TABLE 25 MARKET FOR OTHER APPLICATIONS, BY COUNTRY, 2021–2028 (USD MILLION)
 
9 DIGITAL TWINS IN HEALTHCARE MARKET, BY END USER (Page No. - 92)
    9.1 INTRODUCTION 
          TABLE 26 DIGITAL TWINS IN HEALTHCARE INDUSTRY, BY END USER, 2021–2028 (USD MILLION)
    9.2 PHARMA & BIOPHARMA COMPANIES 
           9.2.1 RISING DEMAND FOR SOLUTIONS TO REDUCE TIME AND COST OF DRUG DEVELOPMENT TO BOOST ADOPTION
                    TABLE 27 MARKET FOR PHARMA & BIOPHARMA COMPANIES, BY COUNTRY, 2021–2028 (USD MILLION)
    9.3 RESEARCH & ACADEMIA 
           9.3.1 INTERACTIVE AND IMMERSIVE LEARNING EXPERIENCES OFFERED BY DIGITAL TWINS TO BOOST ADOPTION
                    TABLE 28 MARKET FOR RESEARCH & ACADEMIA, BY COUNTRY, 2021–2028 (USD MILLION)
    9.4 HEALTHCARE PROVIDERS 
           9.4.1 LOWER COSTS AND BETTER PATIENT TREATMENT TO FAVOR MARKET GROWTH
                    TABLE 29 MARKET FOR HEALTHCARE PROVIDERS, BY COUNTRY, 2021–2028 (USD MILLION)
    9.5 MEDICAL DEVICE COMPANIES 
           9.5.1 GROWING USE OF DIGITAL TWINS FOR SOFTWARE OPTIMIZATION OF MEDICAL DEVICES TO FUEL GROWTH
                    TABLE 30 MARKET FOR MEDICAL DEVICE COMPANIES, BY COUNTRY, 2021–2028 (USD MILLION)
    9.6 OTHER END USERS 
          TABLE 31 MARKET FOR OTHER END USERS, BY COUNTRY, 2021–2028 (USD MILLION)
 
10 DIGITAL TWINS IN HEALTHCARE MARKET, BY REGION (Page No. - 100)
     10.1 INTRODUCTION 
             TABLE 32 MARKET, BY REGION, 2021–2028 (USD MILLION)
     10.2 NORTH AMERICA 
             FIGURE 30 NORTH AMERICA: DIGITAL TWINS IN HEALTHCARE MARKET SNAPSHOT
             TABLE 33 NORTH AMERICA: MARKET, BY COUNTRY, 2021–2028 (USD MILLION)
             TABLE 34 NORTH AMERICA: MARKET, BY COMPONENT, 2021–2028 (USD MILLION)
             TABLE 35 NORTH AMERICA: MARKET, BY APPLICATION, 2021–2028 (USD MILLION)
             TABLE 36 NORTH AMERICA: DIGITAL TWINS IN MARKET, BY END USER, 2021–2028 (USD MILLION)
             10.2.1 US
                        10.2.1.1 Expanding applications of digital twins in healthcare to bolster market growth
                                      TABLE 37 US: DIGITAL TWINS IN HEALTHCARE MARKET, BY COMPONENT, 2021–2028 (USD MILLION)
                                      TABLE 38 US: MARKET, BY APPLICATION, 2021–2028 (USD MILLION)
                                      TABLE 39 US: MARKET, BY END USER, 2021–2028 (USD MILLION)
             10.2.2 CANADA
                        10.2.2.1 Growing investments in digital twin development to drive market
                                      TABLE 40 CANADA: DIGITAL TWINS IN HEALTHCARE MARKET, BY COMPONENT, 2021–2028 (USD MILLION)
                                      TABLE 41 CANADA: MARKET, BY APPLICATION, 2021–2028 (USD MILLION)
                                      TABLE 42 CANADA: MARKET, BY END USER, 2021–2028 (USD MILLION)
     10.3 EUROPE 
             TABLE 43 EUROPE: DIGITAL TWINS IN HEALTHCARE MARKET, BY COUNTRY, 2021–2028 (USD MILLION)
             TABLE 44 EUROPE: MARKET, BY COMPONENT, 2021–2028 (USD MILLION)
             TABLE 45 EUROPE: MARKET, BY APPLICATION, 2021–2028 (USD MILLION)
             TABLE 46 EUROPE: MARKET, BY END USER, 2021–2028 (USD MILLION)
             10.3.1 GERMANY
                        10.3.1.1 Collaborations & partnerships to drive adoption of digital twins
                                      TABLE 47 GERMANY: DIGITAL TWINS IN HEALTHCARE MARKET, BY COMPONENT, 2021–2028 (USD MILLION)
                                      TABLE 48 GERMANY: MARKET, BY APPLICATION, 2021–2028 (USD MILLION)
                                      TABLE 49 GERMANY: DIGITAL TWINS IN HEALTHCARE INDUSTRY, BY END USER, 2021–2028 (USD MILLION)
             10.3.2 UK
                        10.3.2.1 Growing applications of digital twins to support growth
                                      TABLE 50 UK: DIGITAL TWINS IN HEALTHCARE MARKET, BY COMPONENT, 2021–2028 (USD MILLION)
                                      TABLE 51 UK: MARKET, BY APPLICATION, 2021–2028 (USD MILLION)
                                      TABLE 52 UK: MARKET, BY END USER, 2021–2028 (USD MILLION)
             10.3.3 FRANCE
                        10.3.3.1 Growing government funding for digital twin development to bolster growth
                                      TABLE 53 FRANCE: DIGITAL TWINS IN HEALTHCARE MARKET, BY COMPONENT, 2021–2028 (USD MILLION)
                                      TABLE 54 FRANCE: MARKET, BY APPLICATION, 2021–2028 (USD MILLION)
                                      TABLE 55 FRANCE: MARKET, BY END USER, 2021–2028 (USD MILLION)
             10.3.4 REST OF EUROPE
                        TABLE 56 REST OF EUROPE: DIGITAL TWINS IN HEALTHCARE MARKET, BY COMPONENT, 2021–2028 (USD MILLION)
                        TABLE 57 REST OF EUROPE: MARKET, BY APPLICATION, 2021–2028 (USD MILLION)
                        TABLE 58 REST OF EUROPE: MARKET, BY END USER, 2021–2028 (USD MILLION)
     10.4 ASIA PACIFIC 
             FIGURE 31 ASIA PACIFIC: DIGITAL TWINS IN HEALTHCARE MARKET SNAPSHOT
             TABLE 59 ASIA PACIFIC: MARKET, BY COUNTRY, 2021–2028 (USD MILLION)
             TABLE 60 ASIA PACIFIC: MARKET, BY COMPONENT, 2021–2028 (USD MILLION)
             TABLE 61 ASIA PACIFIC: MARKET, BY APPLICATION, 2021–2028 (USD MILLION)
             TABLE 62 ASIA PACIFIC: DIGITAL TWINS IN HEALTHCARE INDUSTRY, BY END USER, 2021–2028 (USD MILLION)
             10.4.1 JAPAN
                        10.4.1.1 Growing penetration of digital twin technologies to support market growth
                                      TABLE 63 JAPAN: DIGITAL TWINS IN HEALTHCARE MARKET, BY COMPONENT, 2021–2028 (USD MILLION)
                                      TABLE 64 JAPAN: MARKET, BY APPLICATION, 2021–2028 (USD MILLION)
                                      TABLE 65 JAPAN: MARKET, BY END USER, 2021–2028 (USD MILLION)
             10.4.2 CHINA
                        10.4.2.1 China to register highest CAGR during forecast period
                                      TABLE 66 CHINA: DIGITAL TWINS IN HEALTHCARE MARKET, BY COMPONENT, 2021–2028 (USD MILLION)
                                      TABLE 67 CHINA: MARKET, BY APPLICATION, 2021–2028 (USD MILLION)
                                      TABLE 68 CHINA: MARKET, BY END USER, 2021–2028 (USD MILLION)
             10.4.3 REST OF ASIA PACIFIC
                        TABLE 69 REST OF ASIA PACIFIC: DIGITAL TWINS IN HEALTHCARE MARKET, BY COMPONENT, 2021–2028 (USD MILLION)
                        TABLE 70 REST OF ASIA PACIFIC: MARKET, BY APPLICATION, 2021–2028 (USD MILLION)
                        TABLE 71 REST OF ASIA PACIFIC: DIGITAL TWINS IN HEALTHCARE INDUSTRY, BY END USER, 2021–2028 (USD MILLION)
     10.5 REST OF THE WORLD 
             TABLE 72 REST OF THE WORLD: DIGITAL TWINS IN HEALTHCARE MARKET, BY COMPONENT, 2021–2028 (USD MILLION)
             TABLE 73 REST OF THE WORLD: MARKET, BY APPLICATION, 2021–2028 (USD MILLION)
             TABLE 74 REST OF THE WORLD: MARKET, BY END USER, 2021–2028 (USD MILLION)
 
11 COMPETITIVE LANDSCAPE (Page No. - 131)
     11.1 OVERVIEW 
             FIGURE 32 KEY DEVELOPMENTS OF MAJOR PLAYERS BETWEEN JANUARY 2020 AND MAY 2023
     11.2 MARKET RANKING ANALYSIS 
             FIGURE 33 DIGITAL TWINS IN HEALTHCARE MARKET RANKING ANALYSIS, BY PLAYER, 2022
     11.3 REVENUE SHARE ANALYSIS OF TOP MARKET PLAYERS 
             FIGURE 34 DIGITAL TWINS IN HEALTHCARE INDUSTRY: REVENUE ANALYSIS OF KEY PLAYERS
     11.4 DIGITAL TWINS IN HEALTHCARE INDUSTRY: R&D EXPENDITURE 
             FIGURE 35 R&D EXPENDITURE OF KEY PLAYERS (2021 VS. 2022)
     11.5 COMPETITIVE BENCHMARKING 
             TABLE 75 FOOTPRINT OF COMPANIES IN DIGITAL TWINS IN HEALTHCARE INDUSTRY
             TABLE 76 COMPANY COMPONENT FOOTPRINT (20 COMPANIES)
             TABLE 77 COMPANY APPLICATION FOOTPRINT (20 COMPANIES)
             TABLE 78 COMPANY REGIONAL FOOTPRINT (20 COMPANIES)
     11.6 COMPANY EVALUATION QUADRANT 
             11.6.1 STARS
             11.6.2 EMERGING LEADERS
             11.6.3 PERVASIVE PLAYERS
             11.6.4 PARTICIPANTS
                        FIGURE 36 DIGITAL TWINS IN HEALTHCARE INDUSTRY: COMPANY EVALUATION QUADRANT (2022)
     11.7 COMPANY EVALUATION MATRIX FOR START-UPS/SMES 
             11.7.1 PROGRESSIVE COMPANIES
             11.7.2 DYNAMIC COMPANIES
             11.7.3 RESPONSIVE COMPANIES
             11.7.4 STARTING BLOCKS
                        FIGURE 37 DIGITAL TWINS IN HEALTHCARE INDUSTRY: COMPANY EVALUATION MATRIX FOR START-UPS/SMES (2022)
     11.8 COMPETITIVE SCENARIO 
             11.8.1 PRODUCT/SERVICE LAUNCHES & APPROVALS
                        TABLE 79 PRODUCT/SERVICE LAUNCHES & APPROVALS, JANUARY 2020– MAY 2023
             11.8.2 DEALS
                        TABLE 80 DEALS, JANUARY 2020– MAY 2023
 
12 COMPANY PROFILES (Page No. - 144)
     12.1 KEY PLAYERS 
(Business Overview, Products Offered, Recent Developments, and MnM View (Key strengths/Right to Win, Strategic Choices Made, and Weaknesses and Competitive Threats))*
             12.1.1 MICROSOFT
                        TABLE 81 MICROSOFT: BUSINESS OVERVIEW
                        FIGURE 38 MICROSOFT: COMPANY SNAPSHOT (2022)
             12.1.2 SIEMENS HEALTHINEERS AG
                        TABLE 82 SIEMENS HEALTHINEERS AG: BUSINESS OVERVIEW
                        FIGURE 39 SIEMENS HEALTHINEERS AG: COMPANY SNAPSHOT (2022)
             12.1.3 KONINKLIJKE PHILIPS N.V.
                        TABLE 83 KONINKLIJKE PHILIPS N.V.: BUSINESS OVERVIEW
                        FIGURE 40 KONINKLIJKE PHILIPS N.V.: COMPANY SNAPSHOT (2022)
             12.1.4 AMAZON (AWS)
                        TABLE 84 AMAZON: BUSINESS OVERVIEW
                        FIGURE 41 AMAZON: COMPANY SNAPSHOT (2022)
             12.1.5 DASSAULT SYSTÈMES
                        TABLE 85 DASSAULT SYSTÈMES: BUSINESS OVERVIEW
                        FIGURE 42 DASSAULT SYSTÈMES: COMPANY SNAPSHOT (2022)
             12.1.6 GE HEALTHCARE
                        TABLE 86 GE HEALTHCARE: BUSINESS OVERVIEW
                        FIGURE 43 GE HEALTHCARE: COMPANY SNAPSHOT (2022)
             12.1.7 ORACLE
                        TABLE 87 ORACLE: BUSINESS OVERVIEW
                        FIGURE 44 ORACLE: COMPANY SNAPSHOT (2022)
             12.1.8 IBM
                        TABLE 88 IBM: BUSINESS OVERVIEW
                        FIGURE 45 IBM: COMPANY SNAPSHOT (2022)
             12.1.9 PTC
                        TABLE 89 PTC: BUSINESS OVERVIEW
                        FIGURE 46 PTC: COMPANY SNAPSHOT (2022)
             12.1.10 SAP
                        TABLE 90 SAP: BUSINESS OVERVIEW
                        FIGURE 47 SAP: COMPANY SNAPSHOT (2022)
             12.1.11 ATOS SE
                        TABLE 91 ATOS SE: BUSINESS OVERVIEW
                        FIGURE 48 ATOS SE: COMPANY SNAPSHOT (2022)
             12.1.12 NVIDIA CORPORATION
                        TABLE 92 NVIDIA CORPORATION: BUSINESS OVERVIEW
                        FIGURE 49 NVIDIA CORPORATION: COMPANY SNAPSHOT (2022)
             12.1.13 ANSYS INC.
                        TABLE 93 ANSYS INC.: BUSINESS OVERVIEW
                        FIGURE 50 ANSYS INC.: COMPANY SNAPSHOT (2022)
             12.1.14 FASTSTREAM TECHNOLOGIES
                        TABLE 94 FASTSTREAM TECHNOLOGIES: BUSINESS OVERVIEW
             12.1.15 RESCALE, INC.
                        TABLE 95 RESCALE, INC.: BUSINESS OVERVIEW
     12.2 OTHER PLAYERS 
             12.2.1 TWIN LTD.
                        TABLE 96 TWIN LTD.: BUSINESS OVERVIEW
             12.2.2 VERTO HEALTH
                        TABLE 97 VERTO HEALTH: BUSINESS OVERVIEW
             12.2.3 QBIO
                        TABLE 98 QBIO: BUSINESS OVERVIEW
             12.2.4 THOUGHTWIRE
                        TABLE 99 THOUGHTWIRE: BUSINESS OVERVIEW
             12.2.5 SIM AND CURE
                        TABLE 100 SIM AND CURE: BUSINESS OVERVIEW
             12.2.6 PREDICTIV
                        TABLE 101 PREDICTIV: BUSINESS OVERVIEW
             12.2.7 NUREA
                        TABLE 102 NUREA: BUSINESS OVERVIEW
             12.2.8 UNLEARN.AI
                        TABLE 103 UNLEARN.AI: BUSINESS OVERVIEW
             12.2.9 VIRTONOMY GMBH
                        TABLE 104 VIRTONOMY GMBH: BUSINESS OVERVIEW
             12.2.10 PREDISURGE
                        TABLE 105 PREDISURGE: BUSINESS OVERVIEW
 
*Details on Business Overview, Products Offered, Recent Developments, and MnM View (Key strengths/Right to Win, Strategic Choices Made, and Weaknesses and Competitive Threats) might not be captured in case of unlisted companies.
 
13 APPENDIX (Page No. - 204)
     13.1 DISCUSSION GUIDE 
     13.2 KNOWLEDGESTORE: MARKETSANDMARKETS’ SUBSCRIPTION PORTAL 
     13.3 CUSTOMIZATION OPTIONS 
     13.4 RELATED REPORTS 
     13.5 AUTHOR DETAILS 

This research study involved the extensive use of both primary and secondary sources. It involved the study of various factors affecting the industry to identify the segmentation types, industry trends, key players, the competitive landscape of market players, and key market dynamics such as drivers, opportunities, challenges, restraints, and key player strategies.

Secondary Research

This research study involved the wide use of secondary sources, directories, databases such as Dun & Bradstreet, Bloomberg Businessweek, and Factiva, white papers, annual reports, and companies’ house documents. Secondary research was undertaken to identify and collect information for this extensive, technical, market-oriented, and commercial study of the digital twins in healthcare market. It was also used to obtain important information about the top players, market classification, and segmentation according to industry trends to the bottom-most level, geographic markets, and key developments related to the market. A database of the key industry leaders was also prepared using secondary research.

Primary Research

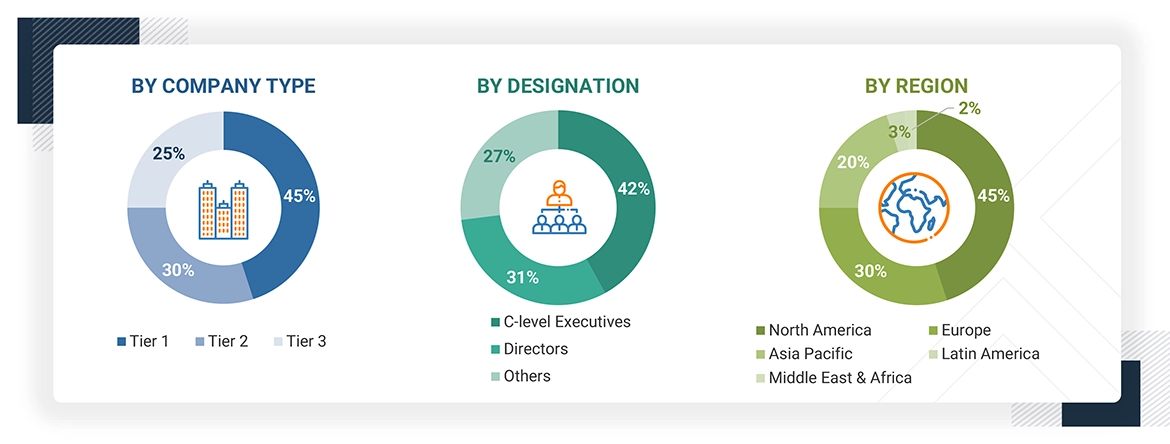
In the primary research process, various supply side and demand side sources were interviewed to obtain qualitative and quantitative information for this report. Primary sources from the supply side included industry experts such as CEOs, vice presidents, marketing and sales directors, technology & innovation directors, engineers, and related key executives from various companies and organizations operating in the digital twins in healthcare market. Primary sources from the demand side included personnel from hospitals (small, medium-sized, and large hospitals), diagnostic centers, and stakeholders in corporate & government bodies.

A breakdown of the primary respondents is provided below:

Digital Twins in Healthcare Market Size, and Share

*Others include sales managers, marketing managers, and product managers.

Note: Tiers are defined based on a company’s total revenue, as of 2020: Tier 1 = >USD 1 billion, Tier 2 = USD 500 million to USD 1 billion, and Tier 3 = <USD 500 million.

To know about the assumptions considered for the study, download the pdf brochure

Market Size Estimation

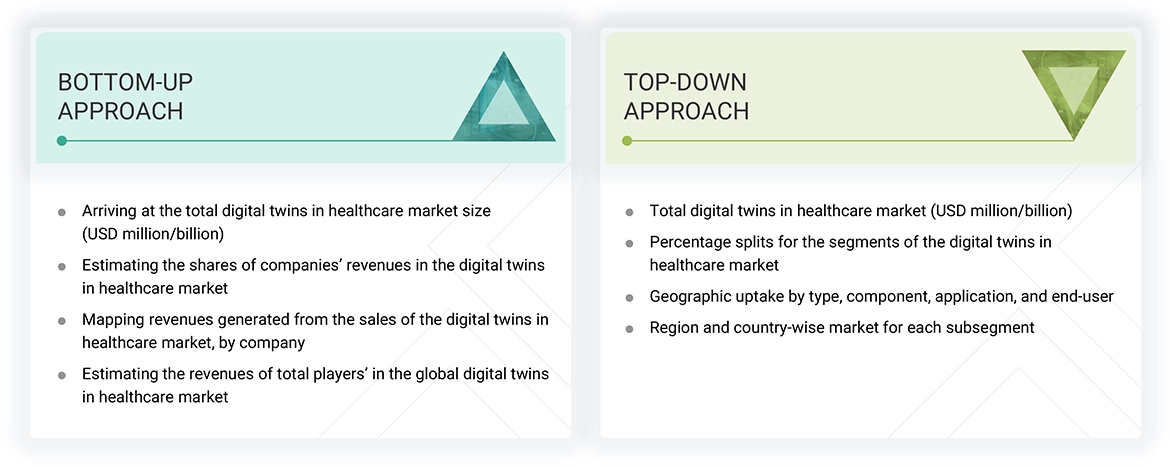
The total size of the market was arrived at after data triangulation through the two approaches mentioned below. After the completion of each approach, the weighted average of these approaches was taken based on the level of assumptions used in each approach.

Data Triangulation

The size of the market was estimated through segmental extrapolation using the bottom-up approach. The methodology used is as given below:

  • Revenues for individual companies were gathered from public sources and databases.
  • Shares of leading players in the market were gathered from secondary sources to the extent available. In some instances, shares of digital twins in healthcare businesses have been ascertained after a detailed analysis of various parameters, including product portfolios, market positioning, selling price, and geographic reach & strength.
  • Individual shares or revenue estimates were validated through interviews with experts.

The total revenue in the digital twins in healthcare market was determined by extrapolating the Market share data of major companies.

Market Definition

According to the Digital Twin Consortium, a digital twin is a virtual representation of real-world entities and processes synchronized at a specified frequency and fidelity. This allows end users to monitor what is happening inside the physical asset in real-time. By providing a holistic view of real-time behavior in a real-world environment mapped to a constantly updated virtual model, digital twins make it possible to anticipate maintenance needs, optimize performance, and avoid costly failures.

Key Stakeholders

  • Healthcare Providers
  • Healthcare Vendors
  • Technology Developers
  • Patients
  • Regulators and Policymakers
  • Insurance companies and payers
  • Academic Research Institutes
  • Imagining and Diagnostic Labs
  • Government Institutions
  • Market Research and Consulting Firms
  • Venture Capitalists and Investors

Global digital twins in healthcare market Size: Top-Down Approach

Digital Twins in Healthcare Market Size, and Share

To know about the assumptions considered for the study, Request for Free Sample Report

Objectives of the Study

  • To define, describe, and forecast the digital twins in healthcare market based on component, deployment, technology, application, end user, and region.
  • To provide detailed information regarding the major factors influencing the growth of the market (drivers, restraints, opportunities, and industry-specific challenges)
  • To strategically analyze micromarkets1 with respect to individual growth trends, prospects, and contributions to the overall market
  • To analyze opportunities in the market for stakeholders and provide details of the competitive landscape for market leaders
  • To forecast the size of the market with respect to three geographic regions—North America, Europe, Asia Pacific (APAC), and the Rest of the World (RoW), which include regions such as Latin America and Middle East & Africa.
  • To profile the key players and comprehensively analyze their core competencies and market shares
  • To track and analyze competitive developments such as agreements, partnerships, collaborations, acquisitions, product/technology/service launches, and R&D activities of leading players

Available Customizations

With the given market data, MarketsandMarkets offers customizations as per your company’s specific needs. The following customization options are available for the report:

Company Information

  • Detailed analysis and profiling of additional market players (up to 5)

Geographic Analysis

  • Further breakdown of the Rest of Europe Market into Denmark, Norway, and others
  • Further breakdown of the Rest of Asia Pacific Market into Vietnam, New Zealand, Australia, South Korea, and others
Custom Market Research Services

We will customize the research for you, in case the report listed above does not meet with your exact requirements. Our custom research will comprehensively cover the business information you require to help you arrive at strategic and profitable business decisions.

Request Customization
Report Code
HIT 8675
Published ON
Jun, 2023
Choose License Type
BUY NOW
  • SHARE
X
Request Customization
Speak to Analyst
Speak to Analyst
OR FACE-TO-FACE MEETING
PERSONALIZE THIS RESEARCH
  • Triangulate with your Own Data
  • Get Data as per your Format and Definition
  • Gain a Deeper Dive on a Specific Application, Geography, Customer or Competitor
  • Any level of Personalization
REQUEST A FREE CUSTOMIZATION
LET US HELP YOU!
  • What are the Known and Unknown Adjacencies Impacting the Digital Twins in Healthcare Market
  • What will your New Revenue Sources be?
  • Who will be your Top Customer; what will make them switch?
  • Defend your Market Share or Win Competitors
  • Get a Scorecard for Target Partners
CUSTOMIZED WORKSHOP REQUEST
+1-888-600-6441
  • Call Us
  • +1-888-600-6441 (Corporate office hours)
  • +1-888-600-6441 (US/Can toll free)
  • +44-800-368-9399 (UK office hours)
CONNECT WITH US
ABOUT TRUST ONLINE
©2024 MarketsandMarkets Research Private Ltd. All rights reserved
DMCA.com Protection Status Website Feedback