Drippers Market

Drippers Market by Type (Inline and Online), Crop Type (Field Crops (Corn, Cotton, Sugarcane, Rice), Fruits & Nuts, Vegetable Crops), and Region (North America, Europe, Asia Pacific, South America, and Rest of the world) - Global Forecast to 2027

Report Code: AGI 8540 Jan, 2023, by marketsandmarkets.com

The global drippers market is estimated to be valued at USD 288 million in 2022 and is projected to reach USD 469 million by 2027, recording a CAGR of 10.2% in terms of value. The global drippers market has realized opportunities in innovative products and patent registrations, indicating a growing demand for the latest agricultural technologies. Developing countries such as India and China are among the largest markets due to the agrarian nature of their economies and increasing levels of water scarcity that affect the regions.

Government schemes and subsidies combined with industry participation continue to bolster prospects for drippers in the Asia Pacific region. The growth in the implementation of drip irrigation systems is supporting the growth of the drippers market globally. The global drippers market is projected to be dominated by the Asia Pacific region, which held the largest share during the forecast period.

Drippers Market

To know about the assumptions considered for the study, Request for Free Sample Report

Drippers Market Dynamics

Drivers: Increase in crop productivity and, thus, profitability

Farmers usually face difficulties such as rolling topography, shifting elevations, erratic weather patterns, excessive water waste, and nutrient leaching. Up to 30–40% of operating expenses can be attributed to the fertilizers used to replenish soil nutrients. Many of the issues that farmers confront seem to have practical solutions with drip irrigation. Drip irrigation systems emit small amounts of water and nutrients directly into the soil to every plant over the entire field, in contrast to systems with a saturated water flow (such as sprinklers).

Drip irrigation thus speeds up crop maturity while increasing crop production, yield, and quality. And all of this while utilizing a lot less water than conventional irrigation techniques like sprinklers, center pivot irrigation, and lateral irrigation. Drip irrigation is now a proven technique that helps in supplying a uniform quantity of water to plants, this increases farm productivity also when facing water scarcity. The total farm productivity is estimated to increase by 40%–50% with drip irrigation systems. Drip irrigation helps reduce water and fertilizer costs through proper usage and increases crop productivity by providing plants with appropriate water and fertilizer. These factors, in turn, are forecasted to support the growth of the drippers market. 

Restraints: High setup cost of large-scale drip irrigation systems

One of the biggest drawbacks of a drip irrigation system is its initial capital requirement. A drip irrigation system consists of a filter, main line, sub-main lines, laterals, emitters & drippers, controls valves, flush valve, pressure gauge, gromate (rubber bush) and take-off, end caps, and fertilizing system, among others. The cost of each of these components usually makes drip irrigation expensive. Furthermore, the cost of installation, removal, maintenance, and requirement of regular capital to replace parts of the systems after fixed interval hinders the adoption of drip irrigation systems.

Opportunities: Increasing adoption of precision agriculture and sustainable practices

One of the most important sustainability concerns of the twenty-first century is widely acknowledged to be water. In many parts of the world, issues with water access, quality, and sanitation are impeding growth, imposing a high human cost, and endangering vital ecosystems that support life. As a result, attention has been drawn to protecting water. Similarly, due to desertification, climate change, and natural disasters, arable land is declining. Several governments and companies operating in the agriculture industry recognize the need for a new vision for agriculture to maintain global food security as well as environmental sustainability and economic opportunity.

It has shifted the focus to implementing drip irrigation systems, which help lower water usage through efficient management. The use of drip irrigation increases water productivity by supplying water to plants at a very lower rate compared to flood irrigation. Thus, it helps in reducing water evaporation and runoff. The benefits of drip irrigation in sustainable and precision agriculture are projected to support the growth of the drippers market soon.

Challenges: Clogging in drippers leads to additional maintenance cost

The clogging of the nozzles with chemically derived particles might ruin the irrigation uniformity in micro-irrigation systems, which are characterized by several emitters with small nozzles. The quality of irrigation water, which appears to depend on the number of suspended materials, chemical composition, and microorganism activity in the water, is directly related to emitter clogging. Thin substances, such as silt, clay, and organic matter suspended in an emitter outlet that has become extremely constrained due to precipitation, accelerate clogging by quickly building up. This clogging results in uneven water distribution, loss in crop productivity, the additional cost of maintenance, repair & replacement of emitters, and labor. These factors present a challenge in the growth of the drippers market.

By type, inline is anticipated to grow at the highest CAGR during the study period

The end users of inline emitters have substantial labor savings, as emitters are preinstalled. Inline emitters are molded into the dripline, which helps negate the costs for additional emitters. Preferably, inline drippers are installed where the plants are planted in close vicinity of each other and usually have less than 3 feet of space between two crops.

By crop type, field crops are forecasted to grow at the highest CAGR during the research period

The use of drip irrigation in cotton cultivation is increasing, further propelling the segment's growth. Management of soil fertility & irrigation water plays a major role in increasing cotton productivity. It is difficult to keep the cotton field's moisture levels stable. It might encourage disease and pest outbreaks. The ideal option, in this case, is drip irrigation, which keeps moisture levels constant. In addition, problems with flowering, ball growth, and ball opening exist in cotton farming. Drip irrigation is necessary for cotton farming since these characteristics necessitate balanced nutrition, a 95% germination rate, and other requirements. As cotton plantation is done in close placing, inline drippers are preferred.

Drippers Market Size, and Share

To know about the assumptions considered for the study, download the pdf brochure

The growth of the market in the Asia Pacific region is majorly driven by the large population engaged in agriculture. Most of the population in countries such as India still depends on agriculture as their major livelihood source for livelihoods. With the increasing support from governments in the form of subsidies, drip irrigation systems are becoming more affordable for farmers having mid-size farms. This is, in turn, fostering the growth of the drippers market in the region. Moreover, there is an increased focus on cash crops, further propelling the market's growth.

Key Market Players:

Key players in this market include The Toro Company (US), Rivulis Irrigation Ltd. (Israel), Hunter Industries, Inc. (US), Netafim Limited (Israel), Jain Irrigation Systems Ltd. (India), Rain Bird Corporation (US), Chinadrip Irrigation Equipment Co., Ltd. (China), Elgo Irrigation Ltd. (Israel), Metzer (Israel), and Azud Spain).

Get online access to the report on the World's First Market Intelligence Cloud

  • Easy to Download Historical Data & Forecast Numbers
  • Company Analysis Dashboard for high growth potential opportunities
  • Research Analyst Access for customization & queries
  • Competitor Analysis with Interactive dashboard
  • Latest News, Updates & Trend analysis
Request Sample

Scope of the Report

Report Metric

Details

Market size estimation

2019–2027

Base year considered

2021

Forecast period considered

2022–2027

Units considered

Value (USD)

Segments covered

Type, Crop Type, and Region

Regions covered

North America, Europe, Asia Pacific, South America, and Rest of the world

Companies studied

  • Jain Irrigation Systems Ltd. (India)
  • The Toro Company (US)
  • Rivulis Irrigation Ltd. (Israel)
  • Hunter Industries, Inc. (US)
  • Netafim Limited (Israel)
  • Rain Bird Corporation (US)
  • Chinadrip Irrigation Equipment Co., Ltd. (China)
  • Elgo Irrigation Ltd. (Israel)
  • Metzer (Israel)
  • Azud (Spain)
  • Antelco Pty Ltd. (Australia)
  • Irritec S.p.A (Italy)
  • Agrodrip S.A. (Greece)
  • Raindrip, Inc. (US)
  • DripWorks Inc. (US)
  • Metro Irrigation (India)
  • KSNM Drip (India)
  • Grupo Chamartin S.A. (Spain)
  • Mahindra EPC (India)
  • Novedades Agrícolas S.A. (Spain)

Target Audience:

  • Drip irrigation system manufacturers
  • Government and research organizations
  • Suppliers and distributors of drippers
  • Marketing directors
  • Key executives from various key companies and organizations in the drippers market

Drippers Market Report Scope:

This research report categorizes the drippers market based on type, crop type, and region.

By Type
  • Inline
  • Online
By Crop Type
  • Field crops
  • Corn
  • Cotton
  • Sugarcane
  • Rice
  • Other field crops
  • Fruits & Nuts
  • Grapes
  • Apples
  • Pear
  • Walnuts
Other fruit & nuts
  • Vegetable crops
  • Tomato
  • Capsicum
  • Chili
  • Cabbage
  • Other vegetable crops
Other Crops

Recent Developments

  • In March 2022, Hunter Industries, Inc. (US) updated the HE and HEB family of Point-Source Emitters with new colors that blend seamlessly into the surrounding environment. These would be color-coded for fast flow identification and feature coined edges for easy gripping during installation. It would help the company to strengthen its product portfolio.
  • In August 2021, Jain Irrigation Systems Ltd. (India) announced the acquisition of ETwater (US), which offered a cloud-based platform and a line of weather-adaptive smart controllers. This acquisition would help the company to expand its water management technology product offering.
  • In March 2022, The Toro Company (US) expanded its precision irrigation Toro Aqua-Traxx Azul drip tape product line. Since its introduction, the Azul line would offer growers field-proven performance by providing superior clog resistance through an innovative emitter design, with multi-stage filters resulting in greater filtration area.

Frequently Asked Questions (FAQ):

To speak to our analyst for a discussion on the above findings, click Speak to Analyst

TABLE OF CONTENTS
 
1 INTRODUCTION (Page No. - 29)
    1.1 STUDY OBJECTIVES 
    1.2 MARKET DEFINITION 
    1.3 MARKET SCOPE 
           FIGURE 1 DRIPPERS MARKET SEGMENTATION
           1.3.1 GEOGRAPHIC SCOPE
           1.3.2 YEARS CONSIDERED
    1.4 CURRENCY CONSIDERED 
    1.5 VOLUME UNIT CONSIDERED 
           TABLE 1 USD EXCHANGE RATES CONSIDERED, 2018–2021
    1.6 STAKEHOLDERS 
 
2 RESEARCH METHODOLOGY (Page No. - 33)
    2.1 RESEARCH DATA 
           FIGURE 2 DRIPPERS MARKET: RESEARCH DESIGN
           2.1.1 SECONDARY DATA
                    2.1.1.1 Key data from secondary sources
           2.1.2 PRIMARY DATA
                    2.1.2.1 Key data from primary sources
                    2.1.2.2 Insights from experts
                    2.1.2.3 Breakdown of primary interviews
                               FIGURE 3 BREAKDOWN OF PRIMARY INTERVIEWS: BY VALUE CHAIN, DESIGNATION, AND REGION
    2.2 MARKET SIZE ESTIMATION 
           FIGURE 4 DRIPPERS MARKET SIZE ESTIMATION: BOTTOM-UP APPROACH
           FIGURE 5 DRIPPERS MARKET SIZE ESTIMATION: TOP-DOWN
    2.3 GROWTH RATE FORECAST ASSUMPTION 
    2.4 DATA TRIANGULATION 
           FIGURE 6 DATA TRIANGULATION METHODOLOGY
    2.5 ASSUMPTIONS 
    2.6 LIMITATIONS 
 
3 EXECUTIVE SUMMARY (Page No. - 42)
    TABLE 2 DRIPPERS MARKET SNAPSHOT, 2022 VS. 2027 
    FIGURE 7 DRIPPERS MARKET, BY DRIPPER TYPE, 2022 VS. 2027 (USD MILLION) 
    FIGURE 8 DRIPPERS MARKET, BY CROP TYPE, 2022 VS. 2027 (USD MILLION) 
    FIGURE 9 DRIPPERS MARKET SHARE AND GROWTH RATE, BY REGION, 2021 
 
4 PREMIUM INSIGHTS (Page No. - 45)
    4.1 ATTRACTIVE OPPORTUNITIES IN DRIPPERS MARKET 
           FIGURE 10 INCREASING SUPPORT BY GOVERNMENTS TO ADOPT DRIP IRRIGATION SYSTEMS
    4.2 ASIA PACIFIC: DRIPPERS MARKET, BY CROP TYPE AND COUNTRY, 2021 
           FIGURE 11 FIELD CROPS SEGMENT AND CHINA ACCOUNTED FOR LARGEST SHARES IN ASIA PACIFIC IN 2021
    4.3 DRIPPERS MARKET, BY TYPE 
           FIGURE 12 INLINE DRIPPERS SEGMENT TO DOMINATE DURING FORECAST PERIOD
    4.4 DRIPPERS MARKET, BY CROP TYPE AND REGION 
           FIGURE 13 FIELD CROPS SEGMENT AND ASIA PACIFIC TO DOMINATE DURING FORECAST PERIOD
    4.5 DRIPPERS MARKET, BY CROP TYPE 
           FIGURE 14 FIELD CROPS SEGMENT TO DOMINATE DURING FORECAST PERIOD
    4.6 DRIPPERS MARKET SHARE, BY COUNTRY, 2021 
           FIGURE 15 CHINA TO DOMINATE DURING FORECAST PERIOD
 
5 MARKET OVERVIEW (Page No. - 49)
    5.1 INTRODUCTION 
           FIGURE 16 GLOBAL IRRIGATED AREA, BY SOCIOECONOMIC INDICATOR, 2020
    5.2 MACROECONOMIC INDICATORS 
           5.2.1 INCREASING POPULATION DENSITY
                    TABLE 3 POPULATION DENSITY, BY COUNTRY, 2019–2027 (PEOPLE PER SQUARE KILOMETER)
           5.2.2 DISTRIBUTION AND AVAILABILITY OF WATER FOR IRRIGATION
                    5.2.2.1 Rates of water withdrawal
                               TABLE 4 SECTOR-WISE WATER WITHDRAWAL, BY COUNTRY, 2018
                               TABLE 5 COUNTRIES WITH LARGEST AGRICULTURAL WATER WITHDRAWALS, 2018
                    5.2.2.2 Area under irrigation
                               TABLE 6 IRRIGATED AREA, BY KEY COUNTRY, 2018
    5.3 MARKET DYNAMICS 
           FIGURE 17 MARKET DYNAMICS: DRIVERS, RESTRAINTS, OPPORTUNITIES, AND CHALLENGES
           5.3.1 DRIVERS
                    5.3.1.1 Increase in government support to adopt drip irrigation
                    5.3.1.2 Modern features of drippers to result in efficient water usage
                               TABLE 7 DRIP IRRIGATION VS. CONVENTIONAL IRRIGATION WATER REQUIREMENT, BY CROP (LITERS/TREE/DAY)
                    5.3.1.3 Increase in crop productivity, and thus, profitability
                               TABLE 8 INCREASE IN YIELD: DRIP IRRIGATION VS. SURFACE IRRIGATION (KG/HA)
           5.3.2 RESTRAINTS
                    5.3.2.1 High setup cost of large-scale drip irrigation systems
                               TABLE 9 COST BREAKDOWN ANALYSIS FOR SUBSURFACE DRIP IRRIGATION SYSTEMS (USD)
           5.3.3 OPPORTUNITIES
                    5.3.3.1 Higher adoption of precision agriculture and sustainable practices
           5.3.4 CHALLENGES
                    5.3.4.1 Additional maintenance costs from clogging in drippers
 
6 INDUSTRY TRENDS (Page No. - 60)
    6.1 INTRODUCTION 
    6.2 VALUE CHAIN ANALYSIS 
           FIGURE 18 VALUE CHAIN ANALYSIS
           6.2.1 RESEARCH & DEVELOPMENT
           6.2.2 RAW MATERIAL SOURCING & MANUFACTURING
           6.2.3 MARKETING & DISTRIBUTION
           6.2.4 ASSEMBLY & INSTALLATION
           6.2.5 MAINTENANCE
    6.3 PRICING ANALYSIS 
           TABLE 10 GLOBAL ASP: PRICING ANALYSIS OF DRIPPERS (USD/1,000 UNITS)
    6.4 ECOSYSTEM MAP 
           6.4.1 DEMAND SIDE
           6.4.2 SUPPLY SIDE
                    FIGURE 19 DRIPPERS MARKET MAP
                    TABLE 11 DRIPPERS MARKET ECOSYSTEM
    6.5 TRENDS/DISRUPTIONS IMPACTING BUYERS IN DRIPPERS MARKET 
           FIGURE 20 REVENUE SHIFT FOR DRIPPERS MARKET
    6.6 TECHNOLOGY ANALYSIS 
    6.7 PRESSURE-COMPENSATING DRIPPERS 
    6.8 SELF-FLUSHING DRIPPERS 
    6.9 PATENT ANALYSIS 
           FIGURE 21 PATENTS GRANTED FOR DRIPPERS MARKET, 2011–2021
           FIGURE 22 REGIONAL ANALYSIS OF PATENT GRANTED FOR DRIPPERS MARKET, 2011–2021
           TABLE 12 KEY PATENTS PERTAINING TO DRIPPERS MARKET, 2020–2021
    6.10 PORTER’S FIVE FORCES ANALYSIS 
           TABLE 13 DRIPPERS MARKET: PORTER’S FIVE FORCES ANALYSIS
           6.10.1 DEGREE OF COMPETITION
           6.10.2 BARGAINING POWER OF SUPPLIERS
           6.10.3 BARGAINING POWER OF BUYERS
           6.10.4 THREAT OF SUBSTITUTES
           6.10.5 THREAT OF NEW ENTRANTS
    6.11 CASE STUDIES 
           6.11.1 NETAFIM’S ARIES TO PROVIDE SOLUTION FOR CLOGGING PROBLEM
           6.11.2 N-DRIP, ALONG WITH PEPSICO, OFFERS EFFICIENT IRRIGATION SYSTEM
    6.12 RECESSION IMPACT ON DRIPPERS MARKET 
           6.12.1 MACRO INDICATORS OF RECESSION
                    FIGURE 23 INDICATORS OF RECESSION
                    FIGURE 24 GLOBAL INFLATION RATE, 2011–2021
                    FIGURE 25 GLOBAL GDP, 2011–2021 (USD TRILLION)
    6.13 KEY CONFERENCES & EVENTS IN 2022–2023 
                    TABLE 14 DRIPPERS MARKET: CONFERENCES & EVENTS, 2022–2023
    6.14 KEY STAKEHOLDERS AND BUYING CRITERIA 
           6.14.1 KEY STAKEHOLDERS IN BUYING PROCESS
                    TABLE 15 INFLUENCE OF STAKEHOLDERS ON BUYING DIFFERENT TYPES
           6.14.2 BUYING CRITERIA
                    FIGURE 26 KEY BUYING CRITERIA FOR DRIPPERS
                    TABLE 16 KEY BUYING CRITERIA FOR DRIPPERS
 
7 KEY REGULATIONS FOR DRIPPERS (Page No. - 78)
    7.1 NORTH AMERICA 
           7.1.1 US
           7.1.2 CANADA
    7.2 EUROPE 
    7.3 ASIA PACIFIC 
           7.3.1 INDIA
           7.3.2 CHINA
           7.3.3 AUSTRALIA
    7.4 REST OF THE WORLD 
           7.4.1 SOUTH AFRICA
           7.4.2 MOROCCO
           7.4.3 ISRAEL
    7.5 TARIFF AND REGULATORY LANDSCAPE 
           7.5.1 REGULATORY BODIES, GOVERNMENT AGENCIES, AND OTHER ORGANIZATIONS
                    TABLE 17 NORTH AMERICA: LIST OF REGULATORY BODIES, GOVERNMENT AGENCIES, AND OTHER ORGANIZATIONS
                    TABLE 18 EUROPE: LIST OF REGULATORY BODIES, GOVERNMENT AGENCIES, AND OTHER ORGANIZATIONS
                    TABLE 19 ASIA PACIFIC: LIST OF REGULATORY BODIES, GOVERNMENT AGENCIES, AND OTHER ORGANIZATIONS
 
8 DRIPPERS MARKET, BY DRIPPER TYPE (Page No. - 88)
    8.1 INTRODUCTION 
           FIGURE 27 INLINE SEGMENT TO DOMINATE DRIPPERS MARKET DURING FORECAST PERIOD
           TABLE 20 DRIPPERS MARKET, BY DRIPPER TYPE, 2019–2021 (USD MILLION)
           TABLE 21 DRIPPERS MARKET, BY DRIPPER TYPE, 2022–2027 (USD MILLION)
           TABLE 22 DRIPPERS MARKET, BY DRIPPER TYPE, 2019–2021 (MILLION UNITS)
           TABLE 23 DRIPPERS MARKET, BY DRIPPER TYPE, 2022–2027 (MILLION UNITS)
    8.2 INLINE DRIPPERS 
           8.2.1 IMPROVED EFFICIENCY AND FERTIGATION COMPATIBILITY DRIVE DEMAND FOR INLINE DRIPPERS
                    TABLE 24 INLINE DRIPPERS MARKET, BY REGION, 2019–2021 (USD MILLION)
                    TABLE 25 INLINE DRIPPERS MARKET, BY REGION, 2022–2027 (USD MILLION)
                    TABLE 26 INLINE DRIPPERS MARKET, BY REGION, 2019–2021 (MILLION UNITS)
                    TABLE 27 INLINE DRIPPERS MARKET, BY REGION, 2022–2027 (MILLION UNITS)
    8.3 ONLINE DRIPPERS 
           8.3.1 ONLINE DRIPPERS TO BE PREFERRED BY SMALL FARMERS SEEKING COST-EFFECTIVE IRRIGATION SOLUTIONS
                    TABLE 28 ONLINE EMITTERS MARKET, BY REGION, 2019–2021 (USD MILLION)
                    TABLE 29 ONLINE EMITTERS MARKET, BY REGION, 2022–2027 (USD MILLION)
                    TABLE 30 ONLINE EMITTERS MARKET, BY REGION, 2019–2021 (MILLION UNITS)
                    TABLE 31 ONLINE EMITTERS MARKET, BY REGION, 2022–2027 (MILLION UNITS)
 
9 DRIPPERS MARKET, BY CROP TYPE (Page No. - 94)
    9.1 INTRODUCTION 
           FIGURE 28 FIELD CROPS SEGMENT TO DOMINATE DRIPPERS MARKET DURING FORECAST PERIOD
           TABLE 32 DRIPPERS MARKET, BY CROP TYPE, 2019–2021 (USD MILLION)
           TABLE 33 DRIPPERS MARKET, BY CROP TYPE, 2022–2027 (USD MILLION)
           TABLE 34 DRIPPERS MARKET, BY CROP TYPE, 2019–2021 (MILLION UNITS)
           TABLE 35 DRIPPERS MARKET, BY CROP TYPE, 2022–2027 (MILLION UNITS)
    9.2 FIELD CROPS 
           9.2.1 INCREASING CONCERNS OVER WATER SCARCITY FUEL DEMAND FOR EFFICIENT DRIPPERS
           9.2.2 CORN
           9.2.3 COTTON
           9.2.4 SUGARCANE
           9.2.5 RICE
           9.2.6 OTHER FIELD CROPS
                    TABLE 36 FIELD CROPS: DRIPPERS MARKET, BY REGION, 2019–2021 (USD MILLION)
                    TABLE 37 FIELD CROPS: DRIPPERS MARKET, BY REGION, 2022–2027 (USD MILLION)
                    TABLE 38 FIELD CROPS: DRIPPERS MARKET, BY REGION, 2019–2021 (MILLION UNITS)
                    TABLE 39 FIELD CROPS: DRIPPERS MARKET, BY REGION, 2022–2027 (MILLION UNITS)
    9.3 FRUITS & NUTS 
           9.3.1 ADOPTION OF DRIPPER FOR PRECISION SUPPLY OF WATER AND FERTILIZER
           9.3.2 GRAPES
           9.3.3 APPLES
           9.3.4 PEAR
           9.3.5 WALNUTS
           9.3.6 OTHER FRUITS & NUTS
                    TABLE 40 FRUITS & NUTS: DRIPPERS MARKET, BY REGION, 2019–2021 (USD MILLION)
                    TABLE 41 FRUITS & NUTS: DRIPPERS MARKET, BY REGION, 2022–2027 (USD MILLION)
                    TABLE 42 FRUITS & NUTS: DRIPPERS MARKET, BY REGION, 2019–2021 (MILLION UNITS)
                    TABLE 43 FRUITS & NUTS: DRIPPERS MARKET, BY REGION, 2022–2027 (MILLION UNITS)
    9.4 VEGETABLE CROPS 
           9.4.1 IMPROVED YIELDS AND HIGH EFFICIENCY TO DRIVE DEMAND FOR DRIP IRRIGATION OF VEGETABLE CROPS
           9.4.2 TOMATO
           9.4.3 CAPSICUM
           9.4.4 CHILI
           9.4.5 CABBAGE
           9.4.6 OTHER VEGETABLE CROPS
                    TABLE 44 VEGETABLE CROPS: DRIPPERS MARKET, BY REGION, 2019–2021 (USD MILLION)
                    TABLE 45 VEGETABLE CROPS: MARKET, BY REGION, 2022–2027 (USD MILLION)
                    TABLE 46 VEGETABLE CROPS: MARKET, BY REGION, 2019–2021 (MILLION UNITS)
                    TABLE 47 VEGETABLE CROPS: MARKET, BY REGION, 2022–2027 (MILLION UNITS)
    9.5 OTHER CROPS 
           TABLE 48 OTHER CROPS: DRIPPERS MARKET, BY REGION, 2019–2021 (USD MILLION)
           TABLE 49 OTHER CROPS: MARKET, BY REGION, 2022–2027 (USD MILLION)
           TABLE 50 OTHER CROPS: MARKET, BY REGION, 2019–2021 (MILLION UNITS)
           TABLE 51 OTHER CROPS: MARKET, BY REGION, 2022–2027 (MILLION UNITS)
 
10 DRIPPERS MARKET, BY REGION (Page No. - 107)
     10.1 INTRODUCTION 
               TABLE 52 DRIPPERS MARKET, BY REGION, 2019–2021 (USD MILLION)
               TABLE 53 MARKET, BY REGION, 2022–2027 (USD MILLION)
               TABLE 54 MARKET, BY REGION, 2019–2021 (MILLION UNITS)
               TABLE 55 MARKET, BY REGION, 2022–2027 (MILLION UNITS)
               FIGURE 29 SOUTH AFRICA TO BE FASTEST-GROWING MARKET FOR DRIPPERS DURING FORECAST PERIOD
     10.2 NORTH AMERICA 
               FIGURE 30 NORTH AMERICA: DRIPPERS MARKET SNAPSHOT
               TABLE 56 NORTH AMERICA: MARKET, BY COUNTRY, 2019–2021 (USD MILLION)
               TABLE 57 NORTH AMERICA: MARKET, BY COUNTRY, 2022–2027 (USD MILLION)
               TABLE 58 NORTH AMERICA: MARKET, BY COUNTRY, 2019–2021 (MILLION UNITS)
               TABLE 59 NORTH AMERICA: MARKET, BY COUNTRY, 2022–2027 (MILLION UNITS)
               TABLE 60 NORTH AMERICA: MARKET, BY CROP TYPE, 2019–2021 (USD MILLION)
               TABLE 61 NORTH AMERICA: MARKET, BY CROP TYPE, 2022–2027 (USD MILLION)
               TABLE 62 NORTH AMERICA: MARKET, BY CROP TYPE, 2019–2021 (MILLION UNITS)
               TABLE 63 NORTH AMERICA: MARKET, BY CROP TYPE, 2022–2027 (MILLION UNITS)
               TABLE 64 NORTH AMERICA: MARKET, BY DRIPPER TYPE, 2019–2021 (USD MILLION)
               TABLE 65 NORTH AMERICA: MARKET, BY DRIPPER TYPE, 2022–2027 (USD MILLION)
               TABLE 66 NORTH AMERICA: MARKET, BY DRIPPER TYPE, 2019–2021 (MILLION UNITS)
               TABLE 67 NORTH AMERICA: MARKET, BY DRIPPER TYPE, 2022–2027 (MILLION UNITS)
             10.2.1 RECESSION IMPACT ON NORTH AMERICAN DRIPPERS MARKET
             10.2.2 US
                       10.2.2.1 Federal subsidies with increasing innovation around drippers to drive market
                                   TABLE 68 US: DRIPPERS MARKET, BY CROP TYPE, 2019–2021 (USD MILLION)
                                   TABLE 69 US: MARKET, BY CROP TYPE, 2022–2027 (USD MILLION)
                                   TABLE 70 US: MARKET, BY DRIPPER TYPE, 2019–2021 (USD MILLION)
                                   TABLE 71 US: MARKET, BY DRIPPER TYPE, 2022–2027 (USD MILLION)
             10.2.3 CANADA
                       10.2.3.1 Increasing adoption of drip irrigation for horticultural crops to drive market
                                   TABLE 72 CANADA: DRIPPERS MARKET, BY CROP TYPE, 2019–2021 (USD MILLION)
                                   TABLE 73 CANADA: MARKET, BY CROP TYPE, 2022–2027 (USD MILLION)
                                   TABLE 74 CANADA: MARKET, BY DRIPPER TYPE, 2019–2021 (USD MILLION)
                                   TABLE 75 CANADA: MARKET, BY DRIPPER TYPE, 2022–2027 (USD MILLION)
             10.2.4 MEXICO
                       10.2.4.1 Government policies and high water tariffs encourage farmers to adopt drip irrigation systems
                                   TABLE 76 MEXICO: DRIPPERS MARKET, BY CROP TYPE, 2019–2021 (USD MILLION)
                                   TABLE 77 MEXICO: MARKET, BY CROP TYPE, 2022–2027 (USD MILLION)
                                   TABLE 78 MEXICO: MARKET, BY DRIPPER TYPE, 2019–2021 (USD MILLION)
                                   TABLE 79 MEXICO: MARKET, BY DRIPPER TYPE, 2022–2027 (USD MILLION)
     10.3 EUROPE 
               TABLE 80 EUROPE: DRIPPERS MARKET, BY COUNTRY, 2019–2021 (USD MILLION)
               TABLE 81 EUROPE: MARKET, BY COUNTRY, 2022–2027 (USD MILLION)
               TABLE 82 EUROPE: MARKET, BY COUNTRY, 2019–2021 (MILLION UNITS)
               TABLE 83 EUROPE: MARKET, BY COUNTRY, 2022–2027 (MILLION UNITS)
               TABLE 84 EUROPE: MARKET, BY CROP TYPE, 2019–2021 (USD MILLION)
               TABLE 85 EUROPE: MARKET, BY CROP TYPE, 2022–2027 (USD MILLION)
               TABLE 86 EUROPE: MARKET, BY CROP TYPE, 2019–2021 (MILLION UNITS)
               TABLE 87 EUROPE: MARKET, BY CROP TYPE, 2022–2027 (MILLION UNITS)
               TABLE 88 EUROPE: MARKET, BY DRIPPER TYPE, 2019–2021 (USD MILLION)
               TABLE 89 EUROPE: MARKET, BY DRIPPER TYPE, 2022–2027 (USD MILLION)
               TABLE 90 EUROPE: MARKET, BY DRIPPER TYPE, 2019–2021 (MILLION UNITS)
               TABLE 91 EUROPE: MARKET, BY DRIPPER TYPE, 2022–2027 (MILLION UNITS)
             10.3.1 RECESSION IMPACT ON EUROPEAN DRIPPERS MARKET
             10.3.2 SPAIN
                       10.3.2.1 Exports of fruits and nuts to drive market
                                   TABLE 92 SPAIN: DRIPPERS MARKET, BY CROP TYPE, 2019–2021 (USD MILLION)
                                   TABLE 93 SPAIN: DRIPPERS MARKET, BY CROP TYPE, 2022–2027 (USD MILLION)
                                   TABLE 94 SPAIN: DRIPPERS MARKET, BY DRIPPER TYPE, 2019–2021 (USD MILLION)
                                   TABLE 95 SPAIN: DRIPPERS MARKET, BY DRIPPER TYPE, 2022–2027 (USD MILLION)
             10.3.3 ITALY
                       10.3.3.1 Growing use of drip irrigation systems in potato, maize farms, and vineyards to fuel demand for drippers
                                   TABLE 96 ITALY: DRIPPERS MARKET, BY CROP TYPE, 2019–2021 (USD MILLION)
                                   TABLE 97 ITALY: DRIPPERS MARKET, BY CROP TYPE, 2022–2027 (USD MILLION)
                                   TABLE 98 ITALY: DRIPPERS MARKET, BY DRIPPER TYPE, 2019–2021 (USD MILLION)
                                   TABLE 99 ITALY: DRIPPERS MARKET, BY DRIPPER TYPE, 2022–2027 (USD MILLION)
             10.3.4 FRANCE
                       10.3.4.1 Increasing need for modernization of irrigation systems to supplement new drippers deployment
                                   TABLE 100 FRANCE: DRIPPERS MARKET, BY CROP TYPE, 2019–2021 (USD MILLION)
                                   TABLE 101 FRANCE: MARKET, BY CROP TYPE, 2022–2027 (USD MILLION)
                                   TABLE 102 FRANCE: MARKET, BY DRIPPER TYPE, 2019–2021 (USD MILLION)
                                   TABLE 103 FRANCE: MARKET, BY DRIPPER TYPE, 2022–2027 (USD MILLION)
             10.3.5 RUSSIA
                       10.3.5.1 Increasing adoption of drip irrigation systems to drive demand for drippers
                                   TABLE 104 RUSSIA: DRIPPERS MARKET, BY CROP TYPE, 2019–2021 (USD MILLION)
                                   TABLE 105 RUSSIA: MARKET, BY CROP TYPE, 2022–2027 (USD MILLION)
                                   TABLE 106 RUSSIA: MARKET, BY DRIPPER TYPE, 2019–2021 (USD MILLION)
                                   TABLE 107 RUSSIA: MARKET, BY DRIPPER TYPE, 2022–2027 (USD MILLION)
             10.3.6 GREECE
                       10.3.6.1 Consistent efforts by government to fuel deployment of microirrigation systems
                                   TABLE 108 GREECE: DRIPPERS MARKET, BY CROP TYPE, 2019–2021 (USD MILLION)
                                   TABLE 109 GREECE: MARKET, BY CROP TYPE, 2022–2027 (USD MILLION)
                                   TABLE 110 GREECE: MARKET, BY DRIPPER TYPE, 2019–2021 (USD MILLION)
                                   TABLE 111 GREECE: MARKET, BY DRIPPER TYPE, 2022–2027 (USD MILLION)
             10.3.7 REST OF EUROPE
                       TABLE 112 REST OF EUROPE: DRIPPERS MARKET, BY CROP TYPE, 2019–2021 (USD MILLION)
                       TABLE 113 REST OF EUROPE: MARKET, BY CROP TYPE, 2022–2027 (USD MILLION)
                       TABLE 114 REST OF EUROPE: MARKET, BY DRIPPER TYPE, 2019–2021 (USD MILLION)
                       TABLE 115 REST OF EUROPE: MARKET, BY DRIPPER TYPE, 2022–2027 (USD MILLION)
     10.4 ASIA PACIFIC 
               FIGURE 31 ASIA PACIFIC: DRIPPERS MARKET SNAPSHOT
               TABLE 116 ASIA PACIFIC: DRIPPERS MARKET, BY COUNTRY, 2019–2021 (USD MILLION)
               TABLE 117 ASIA PACIFIC: MARKET, BY COUNTRY, 2022–2027 (USD MILLION)
               TABLE 118 ASIA PACIFIC: MARKET, BY COUNTRY, 2019–2021 (MILLION UNITS)
               TABLE 119 ASIA PACIFIC: MARKET, BY COUNTRY, 2022–2027 (MILLION UNITS)
               TABLE 120 ASIA PACIFIC: MARKET, BY CROP TYPE, 2019–2021 (USD MILLION)
               TABLE 121 ASIA PACIFIC: MARKET, BY CROP TYPE, 2022–2027 (USD MILLION)
               TABLE 122 ASIA PACIFIC: MARKET, BY CROP TYPE, 2019–2021 (MILLION UNITS)
               TABLE 123 ASIA PACIFIC: MARKET, BY CROP TYPE, 2022–2027 (MILLION UNITS)
               TABLE 124 ASIA PACIFIC: MARKET, BY DRIPPER TYPE, 2019–2021 (USD MILLION)
               TABLE 125 ASIA PACIFIC: MARKET, BY DRIPPER TYPE, 2022–2027 (USD MILLION)
               TABLE 126 ASIA PACIFIC: MARKET, BY DRIPPER TYPE, 2019–2021 (MILLION UNITS)
               TABLE 127 ASIA PACIFIC: MARKET, BY DRIPPER TYPE, 2022–2027 (MILLION UNITS)
             10.4.1 RECESSION IMPACT ON ASIA PACIFIC DRIPPERS MARKET
             10.4.2 CHINA
                       10.4.2.1 Growing concerns about water usage and initiatives by government to drive market
                                   TABLE 128 CHINA: DRIPPERS MARKET, BY CROP TYPE, 2019–2021 (USD MILLION)
                                   TABLE 129 CHINA: MARKET, BY CROP TYPE, 2022–2027 (USD MILLION)
                                   TABLE 130 CHINA: MARKET, BY DRIPPER TYPE, 2019–2021 (USD MILLION)
                                   TABLE 131 CHINA: MARKET, BY DRIPPER TYPE, 2022–2027 (USD MILLION)
             10.4.3 INDIA
                       10.4.3.1 Rising concerns over water scarcity and favorable agricultural environment to fuel market
                                   TABLE 132 INDIA: DRIPPERS MARKET, BY CROP TYPE, 2019–2021 (USD MILLION)
                                   TABLE 133 INDIA: MARKET, BY CROP TYPE, 2022–2027 (USD MILLION)
                                   TABLE 134 INDIA: MARKET, BY DRIPPER TYPE, 2019–2021 (USD MILLION)
                                   TABLE 135 INDIA: MARKET, BY DRIPPER TYPE, 2022–2027 (USD MILLION)
             10.4.4 AUSTRALIA
                       10.4.4.1 Increasing water tariffs and government incentives for water conservation to support market growth
                                   TABLE 136 AUSTRALIA: DRIPPERS MARKET, BY CROP TYPE, 2019–2021 (USD MILLION)
                                   TABLE 137 AUSTRALIA: MARKET, BY CROP TYPE, 2022–2027 (USD MILLION)
                                   TABLE 138 AUSTRALIA: MARKET, BY DRIPPER TYPE, 2019–2021 (USD MILLION)
                                   TABLE 139 AUSTRALIA: MARKET, BY DRIPPER TYPE, 2022–2027 (USD MILLION)
             10.4.5 JAPAN
                       10.4.5.1 Increased scope of protected agriculture to attract investments in agricultural sector
                                   TABLE 140 JAPAN: DRIPPERS MARKET, BY CROP TYPE, 2019–2021 (USD MILLION)
                                   TABLE 141 JAPAN: MARKET, BY CROP TYPE, 2022–2027 (USD MILLION)
                                   TABLE 142 JAPAN: MARKET, BY DRIPPER TYPE, 2019–2021 (USD MILLION)
                                   TABLE 143 JAPAN: MARKET, BY DRIPPER TYPE, 2022–2027 (USD MILLION)
             10.4.6 INDONESIA
                       10.4.6.1 Minimal cropland and water scarcity drive market
                                   TABLE 144 INDONESIA: DRIPPERS MARKET, BY CROP TYPE, 2019–2021 (USD MILLION)
                                   TABLE 145 INDONESIA: MARKET, BY CROP TYPE, 2022–2027 (USD MILLION)
                                   TABLE 146 INDONESIA: MARKET, BY DRIPPER TYPE, 2019–2021 (USD MILLION)
                                   TABLE 147 INDONESIA: MARKET, BY DRIPPER TYPE, 2022–2027 (USD MILLION)
             10.4.7 THAILAND
                       10.4.7.1 Government initiatives to encourage adoption of drippers for fruits & nuts cultivation
                                   TABLE 148 THAILAND: DRIPPERS MARKET, BY CROP TYPE, 2019–2021 (USD MILLION)
                                   TABLE 149 THAILAND: MARKET, BY CROP TYPE, 2022–2027 (USD MILLION)
                                   TABLE 150 THAILAND: MARKET, BY DRIPPER TYPE, 2019–2021 (USD MILLION)
                                   TABLE 151 THAILAND: MARKET, BY DRIPPER TYPE, 2022–2027 (USD MILLION)
             10.4.8 REST OF ASIA PACIFIC
                       TABLE 152 REST OF ASIA PACIFIC: DRIPPERS MARKET, BY CROP TYPE, 2019–2021 (USD MILLION)
                       TABLE 153 REST OF ASIA PACIFIC: MARKET, BY CROP TYPE, 2022–2027 (USD MILLION)
                       TABLE 154 REST OF ASIA PACIFIC: MARKET, BY DRIPPER TYPE, 2019–2021 (USD MILLION)
                       TABLE 155 REST OF ASIA PACIFIC: MARKET, BY DRIPPER TYPE, 2022–2027 (USD MILLION)
     10.5 SOUTH AMERICA 
               TABLE 156 SOUTH AMERICA: DRIPPERS MARKET, BY COUNTRY, 2019–2021 (USD MILLION)
               TABLE 157 SOUTH AMERICA: MARKET, BY COUNTRY, 2022–2027 (USD MILLION)
               TABLE 158 SOUTH AMERICA: MARKET, BY COUNTRY, 2019–2021 (MILLION UNITS)
               TABLE 159 SOUTH AMERICA: MARKET, BY COUNTRY, 2022–2027 (MILLION UNITS)
               TABLE 160 SOUTH AMERICA: MARKET, BY CROP TYPE, 2019–2021 (USD MILLION)
               TABLE 161 SOUTH AMERICA: MARKET, BY CROP TYPE, 2022–2027 (USD MILLION)
               TABLE 162 SOUTH AMERICA: MARKET, BY CROP TYPE, 2019–2021 (MILLION UNITS)
               TABLE 163 SOUTH AMERICA: MARKET, BY CROP TYPE, 2022–2027 (MILLION UNITS)
               TABLE 164 SOUTH AMERICA: MARKET, BY DRIPPER TYPE, 2019–2021 (USD MILLION)
               TABLE 165 SOUTH AMERICA: MARKET, BY DRIPPER TYPE, 2022–2027 (USD MILLION)
               TABLE 166 SOUTH AMERICA: MARKET, BY DRIPPER TYPE, 2019–2021 (MILLION UNITS)
               TABLE 167 SOUTH AMERICA: MARKET, BY DRIPPER TYPE, 2022–2027 (MILLION UNITS)
             10.5.1 RECESSION IMPACT ON SOUTH AMERICAN DRIPPERS MARKET
             10.5.2 BRAZIL
                       10.5.2.1 Changing government regulations on water use to drive usage of drippers for irrigation
                                   TABLE 168 BRAZIL: DRIPPERS MARKET, BY CROP TYPE, 2019–2021 (USD MILLION)
                                   TABLE 169 BRAZIL: MARKET, BY CROP TYPE, 2022–2027 (USD MILLION)
                                   TABLE 170 BRAZIL: MARKET, BY DRIPPER TYPE, 2019–2021 (USD MILLION)
                                   TABLE 171 BRAZIL: MARKET, BY DRIPPER TYPE, 2022–2027 (USD MILLION)
             10.5.3 ARGENTINA
                       10.5.3.1 Favorable government regulation to support demand for drippers
                                   TABLE 172 ARGENTINA: DRIPPERS MARKET, BY CROP TYPE, 2019–2021 (USD MILLION)
                                   TABLE 173 ARGENTINA: MARKET, BY CROP TYPE, 2022–2027 (USD MILLION)
                                   TABLE 174 ARGENTINA: MARKET, BY DRIPPER TYPE, 2019–2021 (USD MILLION)
                                   TABLE 175 ARGENTINA: MARKET, BY DRIPPER TYPE, 2022–2027 (USD MILLION)
             10.5.4 REST OF SOUTH AMERICA
                       TABLE 176 REST OF SOUTH AMERICA: DRIPPERS MARKET, BY CROP TYPE, 2019–2021 (USD MILLION)
                       TABLE 177 REST OF SOUTH AMERICA: MARKET, BY CROP TYPE, 2022–2027 (USD MILLION)
                       TABLE 178 REST OF SOUTH AMERICA: MARKET, BY DRIPPER TYPE, 2019–2021 (USD MILLION)
                       TABLE 179 REST OF SOUTH AMERICA: MARKET, BY DRIPPER TYPE, 2022–2027 (USD MILLION)
     10.6 REST OF THE WORLD 
               TABLE 180 ROW: DRIPPERS MARKET, BY COUNTRY, 2019–2021 (USD MILLION)
               TABLE 181 ROW: MARKET, BY COUNTRY, 2022–2027 (USD MILLION)
               TABLE 182 ROW: MARKET, BY COUNTRY, 2019–2021 (MILLION UNITS)
               TABLE 183 ROW: MARKET, BY COUNTRY, 2022–2027 (MILLION UNITS)
               TABLE 184 ROW: MARKET, BY CROP TYPE, 2019–2021 (USD MILLION)
               TABLE 185 ROW: MARKET, BY CROP TYPE, 2022–2027 (USD MILLION)
               TABLE 186 ROW: MARKET, BY CROP TYPE, 2019–2021 (MILLION UNITS)
               TABLE 187 ROW: MARKET, BY CROP TYPE, 2022–2027 (MILLION UNITS)
               TABLE 188 ROW: MARKET, BY DRIPPER TYPE, 2019–2021 (USD MILLION)
               TABLE 189 ROW: MARKET, BY DRIPPER TYPE, 2022–2027 (USD MILLION)
               TABLE 190 ROW: MARKET, BY DRIPPER TYPE, 2019–2021 (MILLION UNITS)
               TABLE 191 ROW: MARKET, BY DRIPPER TYPE, 2022–2027 (MILLION UNITS)
             10.6.1 RECESSION IMPACT ON REST OF THE WORLD
             10.6.2 EGYPT
                       10.6.2.1 Adoption of irrigation technologies to drive usage of drippers
                                   TABLE 192 EGYPT: DRIPPERS MARKET, BY CROP TYPE, 2019–2021 (USD MILLION)
                                   TABLE 193 EGYPT: MARKET, BY CROP TYPE, 2022–2027 (USD MILLION)
                                   TABLE 194 EGYPT: MARKET, BY DRIPPER TYPE, 2019–2021 (USD MILLION)
                                   TABLE 195 EGYPT: MARKET, BY DRIPPER TYPE, 2022–2027 (USD MILLION)
             10.6.3 SOUTH AFRICA
                       10.6.3.1 Increasing adoption of low-pressure emitters and inline drippers among farmers to drive market
                                   TABLE 196 SOUTH AFRICA: DRIPPERS MARKET, BY CROP TYPE, 2019–2021 (USD MILLION)
                                   TABLE 197 SOUTH AFRICA: MARKET, BY CROP TYPE, 2022–2027 (USD MILLION)
                                   TABLE 198 SOUTH AFRICA: MARKET, BY DRIPPER TYPE, 2019–2021 (USD MILLION)
                                   TABLE 199 SOUTH AFRICA: MARKET, BY DRIPPER TYPE, 2022–2027 (USD MILLION)
             10.6.4 SAUDI ARABIA
                       10.6.4.1 Fruits & nuts segment to be fastest-growing crop types for drippers
                                   TABLE 200 SAUDI ARABIA: DRIPPERS MARKET, BY CROP TYPE, 2019–2021 (USD MILLION)
                                   TABLE 201 SAUDI ARABIA: MARKET, BY CROP TYPE, 2022–2027 (USD MILLION)
                                   TABLE 202 SAUDI ARABIA: MARKET, BY DRIPPER TYPE, 2019–2021 (USD MILLION)
                                   TABLE 203 SAUDI ARABIA: MARKET, BY DRIPPER TYPE, 2022–2027 (USD MILLION)
             10.6.5 OTHERS IN ROW
                       TABLE 204 OTHERS IN ROW: DRIPPERS MARKET, BY CROP TYPE, 2019–2021 (USD MILLION)
                       TABLE 205 OTHERS IN ROW: MARKET, BY CROP TYPE, 2022–2027 (USD MILLION)
                       TABLE 206 OTHERS IN ROW: MARKET, BY DRIPPER TYPE, 2019–2021 (USD MILLION)
                       TABLE 207 OTHERS IN ROW: MARKET, BY DRIPPER TYPE, 2022–2027 (USD MILLION)
 
11 COMPETITIVE LANDSCAPE (Page No. - 167)
     11.1 OVERVIEW 
     11.2 MARKET SHARE ANALYSIS: DRIPPERS MARKET, 2021 
               TABLE 208 DRIPPERS MARKET: DEGREE OF COMPETITION
     11.3 STRATEGIES ADOPTED BY KEY PLAYERS 
     11.4 REVENUE SHARE ANALYSIS OF KEY PLAYERS 
               FIGURE 32 TOTAL REVENUE ANALYSIS OF KEY PLAYERS, 2019–2022 (USD BILLION)
     11.5 COMPANY EVALUATION QUADRANT (KEY PLAYERS) 
             11.5.1 STARS
             11.5.2 EMERGING LEADERS
             11.5.3 PERVASIVE PLAYERS
             11.5.4 PARTICIPANTS
                       FIGURE 33 DRIPPERS MARKET: COMPANY EVALUATION QUADRANT, 2020 (KEY PLAYERS)
     11.6 PRODUCT FOOTPRINT 
               TABLE 209 COMPANY’S PRODUCT FOOTPRINT, BY DRIPPER TYPE
               TABLE 210 COMPANY’S PRODUCT FOOTPRINT, BY CROP TYPE
               TABLE 211 COMPANY’S PRODUCT FOOTPRINT, BY REGION
               TABLE 212 COMPANY’S OVERALL PRODUCT FOOTPRINT
     11.7 STARTUP/SME EVALUATION QUADRANT (OTHER PLAYERS) 
             11.7.1 PROGRESSIVE COMPANIES
             11.7.2 STARTING BLOCKS
             11.7.3 RESPONSIVE COMPANIES
             11.7.4 DYNAMIC COMPANIES
                       TABLE 213 DRIPPERS MARKET: COMPETITIVE BENCHMARKING OF KEY STARTUPS/SMES
                       FIGURE 34 DRIPPERS MARKET: COMPANY EVALUATION QUADRANT, 2020 (KEY STARTUPS/SMES)
     11.8 PRODUCT FOOTPRINT OF SMES/STARTUPS 
               TABLE 214 SMES/STARTUPS: COMPANY’S PRODUCT FOOTPRINT, BY DRIPPER TYPE
               TABLE 215 SMES/STARTUPS: COMPANY’S PRODUCT FOOTPRINT, BY CROP TYPE
               TABLE 216 SMES/STARTUPS: COMPANY’S PRODUCT FOOTPRINT, BY REGION
               TABLE 217 SMES/STARTUPS: COMPANY’S OVERALL PRODUCT FOOTPRINT
     11.9 COMPETITIVE SCENARIO 
             11.9.1 PRODUCT LAUNCHES
                       TABLE 218 DRIPPERS MARKET: PRODUCT LAUNCHES, 2019–2022
             11.9.2 DEALS
                       TABLE 219 DRIPPERS MARKET: DEALS, 2019–2022
             11.9.3 OTHERS
                       TABLE 220 DRIPPERS MARKET: EXPANSIONS, 2019–2022
 
12 COMPANY PROFILES (Page No. - 182)
     12.1 KEY PLAYERS 
             12.1.1 JAIN IRRIGATION SYSTEMS LTD.
                       12.1.1.1 Business overview
                                   TABLE 221 JAIN IRRIGATION SYSTEMS LTD.: COMPANY OVERVIEW
                                   FIGURE 35 JAIN IRRIGATION SYSTEMS LTD.: COMPANY SNAPSHOT
                       12.1.1.2 Products/Solutions/Services offered
                                   TABLE 222 JAIN IRRIGATION SYSTEMS LTD.: PRODUCTS/SOLUTIONS/SERVICES OFFERED
                       12.1.1.3 Recent developments
                                   TABLE 223 JAIN IRRIGATION SYSTEMS LTD.: DEALS
                                   TABLE 224 JAIN IRRIGATION SYSTEMS LTD.: OTHERS
                       12.1.1.4 MnM view
                                   12.1.1.4.1 Right to win
                                   12.1.1.4.2 Strategic choices
                                   12.1.1.4.3 Weaknesses and competitive threats
             12.1.2 THE TORO COMPANY
                       12.1.2.1 Business overview
                                   TABLE 225 THE TORO COMPANY: COMPANY OVERVIEW
                                   FIGURE 36 THE TORO COMPANY: COMPANY SNAPSHOT
                       12.1.2.2 Products/Solutions/Services offered
                                   TABLE 226 THE TORO COMPANY: PRODUCTS/SOLUTIONS/SERVICES OFFERED
                       12.1.2.3 Recent developments
                                   TABLE 227 THE TORO COMPANY: DEALS
                                   TABLE 228 THE TORO COMPANY: OTHERS
                       12.1.2.4 MnM view
                                   12.1.2.4.1 Right to win
                                   12.1.2.4.2 Strategic choices
                                   12.1.2.4.3 Weaknesses and competitive threats
             12.1.3 RIVULIS
                       12.1.3.1 Business overview
                                   TABLE 229 RIVULIS: COMPANY OVERVIEW
                       12.1.3.2 Products/Solutions/Services offered
                                   TABLE 230 RIVULIS: PRODUCTS/SOLUTIONS/SERVICES OFFERED
                       12.1.3.3 MnM View
                                   12.1.3.3.1 Right to win
                                   12.1.3.3.2 Strategic choices
                                   12.1.3.3.3 Weaknesses and competitive threats
             12.1.4 HUNTER INDUSTRIES, INC.
                       12.1.4.1 Business overview
                                   TABLE 231 HUNTER INDUSTRIES, INC.: COMPANY OVERVIEW
                       12.1.4.2 Products/Solutions/Services offered
                                   TABLE 232 HUNTER INDUSTRIES, INC.: PRODUCTS/SOLUTIONS/SERVICES OFFERED
                       12.1.4.3 Recent developments
                                   TABLE 233 HUNTER INDUSTRIES, INC.: NEW PRODUCT LAUNCH
                       12.1.4.4 MnM view
                                   12.1.4.4.1 Right to win
                                   12.1.4.4.2 Strategic choices
                                   12.1.4.4.3 Weaknesses and competitive threats
             12.1.5 NETAFIM
                       12.1.5.1 Business overview
                                   TABLE 234 NETAFIM: COMPANY OVERVIEW
                                   FIGURE 37 NETAFIM: COMPANY SNAPSHOT
                       12.1.5.2 Products/Solutions/Services offered
                                   TABLE 235 NETAFIM: PRODUCTS/SOLUTIONS/SERVICES OFFERED
                       12.1.5.3 Recent developments
                                   TABLE 236 NETAFIM: NEW PRODUCT LAUNCH
                                   TABLE 237 NETAFIM: DEALS
                       12.1.5.4 MnM view
                                   12.1.5.4.1 Right to win
                                   12.1.5.4.2 Strategic choices
                                   12.1.5.4.3 Weaknesses and competitive threats
             12.1.6 RAIN BIRD CORPORATION
                       12.1.6.1 Business overview
                                   TABLE 238 RAIN BIRD CORPORATION: COMPANY OVERVIEW
                       12.1.6.2 Products/Solutions/Services offered
                                   TABLE 239 RAIN BIRD CORPORATION: PRODUCTS/SOLUTIONS/SERVICES OFFERED
                       12.1.6.3 Recent developments
                                   TABLE 240 RAIN BIRD CORPORATION: DEALS
                       12.1.6.4 MnM view
             12.1.7 CHINADRIP IRRIGATION EQUIPMENT CO. LTD.
                       12.1.7.1 Business overview
                                   TABLE 241 CHINADRIP IRRIGATION EQUIPMENT CO. LTD.: COMPANY OVERVIEW
                       12.1.7.2 Products/Solutions/Services offered
                                   TABLE 242 CHINADRIP IRRIGATION EQUIPMENT CO. LTD.: PRODUCTS/SOLUTIONS/SERVICES OFFERED
                       12.1.7.3 Recent developments
                                   TABLE 243 CHINADRIP IRRIGATION EQUIPMENT CO. LTD.: NEW PRODUCT LAUNCHES
                       12.1.7.4 MnM view
             12.1.8 ELGO IRRIGATION LTD.
                       12.1.8.1 Business overview
                                   TABLE 244 ELGO IRRIGATION LTD.: COMPANY OVERVIEW
                       12.1.8.2 Products/Solutions/Services offered
                                   TABLE 245 ELGO IRRIGATION LTD.: PRODUCTS/SOLUTIONS/SERVICES OFFERED
                       12.1.8.3 MnM view
             12.1.9 METZER
                       12.1.9.1 Business overview
                                   TABLE 246 METZER GROUP: COMPANY OVERVIEW
                       12.1.9.2 Products/Solutions/Services offered
                                   TABLE 247 METZER GROUP: PRODUCTS/SOLUTIONS/SERVICES OFFERED
                       12.1.9.3 Recent developments
                                   TABLE 248 METZER GROUP: NEW PRODUCT LAUNCHES
                                   TABLE 249 METZER GROUP: DEALS
                       12.1.9.4 MnM view
             12.1.10 AZUD
                       12.1.10.1 Business overview
                                   TABLE 250 AZUD: COMPANY OVERVIEW
                       12.1.10.2 Products/Solutions/Services offered
                                   TABLE 251 AZUD: PRODUCTS/SOLUTIONS/SERVICES OFFERED
                       12.1.10.3 MnM view
     12.2 OTHER PLAYERS 
             12.2.1 ANTELCO PTY LTD.
                       12.2.1.1 Business overview
                                   TABLE 252 ANTELCO PTY LTD.: COMPANY OVERVIEW
                       12.2.1.2 Products/Solutions/Services offered
                                   TABLE 253 ANTELCO PTY LTD.: PRODUCTS/SOLUTIONS/SERVICES OFFERED
                       12.2.1.3 Recent developments
                                   TABLE 254 ANTELCO PTY LTD.: NEW PRODUCT LAUNCH
             12.2.2 IRRITEC S.P.A
                       12.2.2.1 Business overview
                                   TABLE 255 IRRITEC S.P.A: COMPANY OVERVIEW
                       12.2.2.2 Products/Solutions/Services offered
                                   TABLE 256 IRRITEC S.P.A: PRODUCTS/SOLUTIONS/SERVICES OFFERED
                       12.2.2.3 Recent developments
                                   TABLE 257 IRRITEC S.P.A: OTHERS
             12.2.3 AGRODRIP S.A.
                       12.2.3.1 Business overview
                                   TABLE 258 AGRODRIP S.A.: COMPANY OVERVIEW
                       12.2.3.2 Products/Solutions/Services offered
                                   TABLE 259 AGRODRIP S.A.: PRODUCTS/SOLUTIONS/SERVICES OFFERED
             12.2.4 RAINDRIP, INC.
                       12.2.4.1 Business overview
                                   TABLE 260 RAINDRIP, INC.: COMPANY OVERVIEW
                       12.2.4.2 Products/Solutions/Services offered
                                   TABLE 261 RAINDRIP, INC.: PRODUCTS/SOLUTIONS/SERVICES OFFERED
             12.2.5 DRIPWORKS
                       12.2.5.1 Business overview
                                   TABLE 262 DRIPWORKS: COMPANY OVERVIEW
                       12.2.5.2 Products/Solutions/Services offered
                                   TABLE 263 DRIPWORKS: PRODUCTS/SOLUTIONS/SERVICES OFFERED
             12.2.6 METRO IRRIGATION
             12.2.7 KSNM DRIP
             12.2.8 GRUPO CHAMARTIN S.A.
             12.2.9 MAHINDRA EPC
             12.2.10 NOVEDADES AGRÍCOLAS S.A.
 
13 ADJACENT AND RELATED MARKETS (Page No. - 219)
     13.1 INTRODUCTION 
               TABLE 264 ADJACENT MARKETS
     13.2 LIMITATIONS 
     13.3 SPRINKLER IRRIGATION SYSTEMS MARKET 
             13.3.1 MARKET DEFINITION
             13.3.2 MARKET OVERVIEW
                       TABLE 265 SPRINKLER IRRIGATION SYSTEMS MARKET, BY TYPE, 2017–2025 (USD MILLION)
     13.4 IRRIGATION AUTOMATION MARKET 
             13.4.1 MARKET DEFINITION
             13.4.2 MARKET OVERVIEW
                       TABLE 266 IRRIGATION AUTOMATION MARKET, BY SYSTEM, 2019–2021 (USD MILLION)
                       TABLE 267 IRRIGATION AUTOMATION MARKET, BY SYSTEM, 2022–2027 (USD MILLION)
     13.5 MICROIRRIGATION SYSTEMS MARKET 
             13.5.1 MARKET DEFINITION
             13.5.2 MARKET OVERVIEW
                       TABLE 268 MICROIRRIGATION SYSTEMS MARKET, BY TYPE, 2017–2020 (000’ HECTARES)
                       TABLE 269 MICROIRRIGATION SYSTEMS MARKET, BY TYPE, 2021–2026 (000’ HECTARES)
 
14 APPENDIX (Page No. - 223)
     14.1 DISCUSSION GUIDE 
     14.2 KNOWLEDGESTORE: MARKETSANDMARKETS’ SUBSCRIPTION PORTAL 
     14.3 CUSTOMIZATION OPTIONS 
     14.4 RELATED REPORTS 
     14.5 AUTHOR DETAILS 

The study involved four major activities in estimating the drippers market size. Exhaustive secondary research was conducted to collect information on the market, peer market, and parent market. The next step was to validate these findings, assumptions, and sizing with industry experts across the value chain through primary research. Both the top-down and bottom-up approaches were employed to estimate the complete market size. Thereafter, market breakdown and data triangulation were used to estimate the market size of segments and sub-segments.

Secondary Research

In the secondary research process, various secondary sources, such as Hoovers, Bloomberg BusinessWeek, and Dun & Bradstreet, were referred to identify and collect information for this study. These secondary sources included annual reports, press releases & investor presentations of companies, white papers, certified publications, articles by recognized authors, gold & silver standard websites, regulatory bodies, trade directories, and databases.

Primary Research

The market comprises several stakeholders in the supply chain, including drip irrigation/dripper system manufacturers, suppliers, farmers/growers, importers and exporters, and intermediary suppliers such as traders and distributors of dripper products. Various primary sources from both the supply and demand sides of the market were interviewed to obtain qualitative and quantitative information. The primary interviewees from the supply side include drip irrigation system manufacturers, suppliers, importers, and exporters. The primary sources from the demand side include farmers/growers, intermediary suppliers such as traders, and distributors of drippers products.
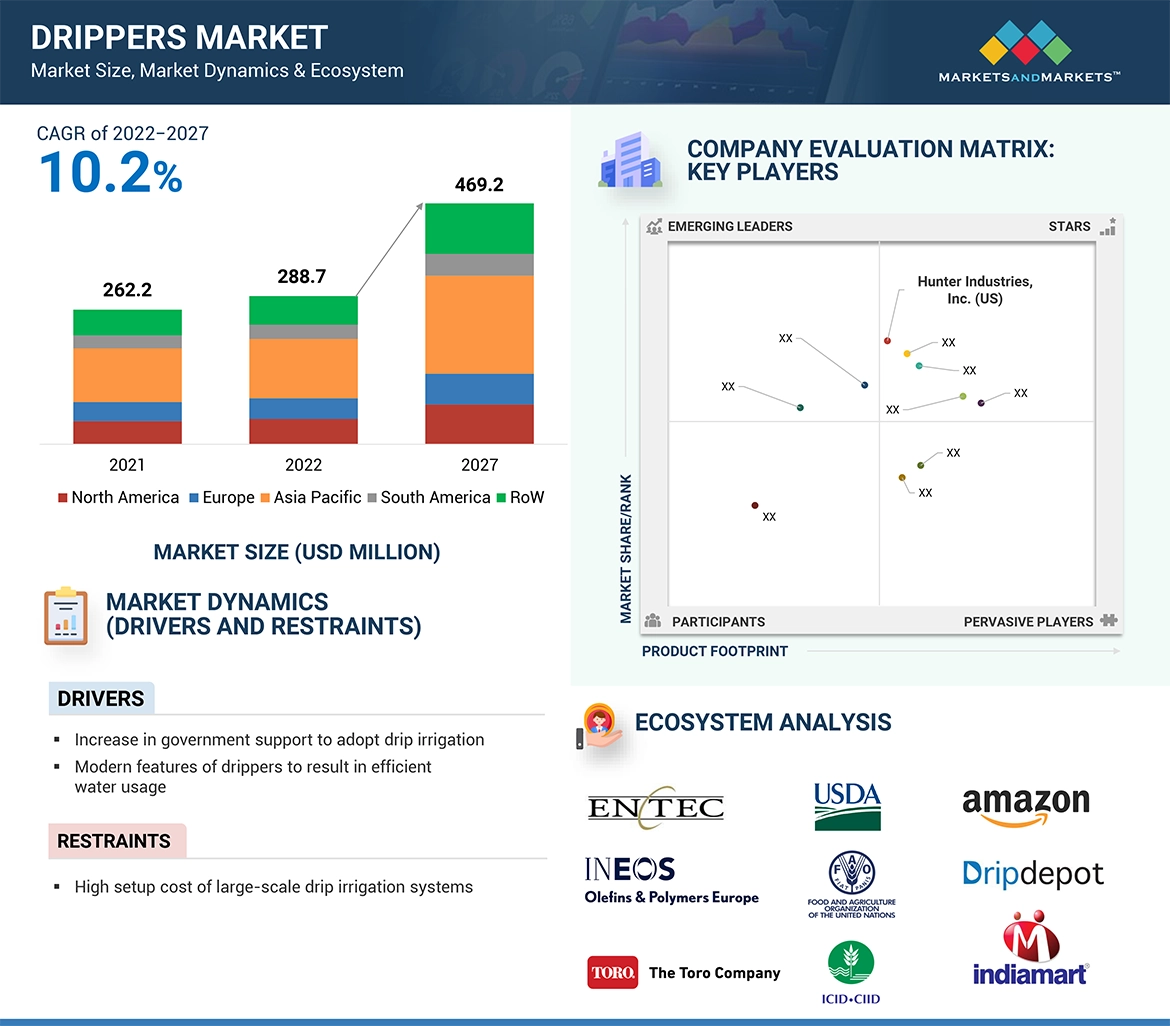
Given below is the breakdown of the primary respondents.

Drippers Market Size, and Share

To know about the assumptions considered for the study, download the pdf brochure

Market Size Estimation

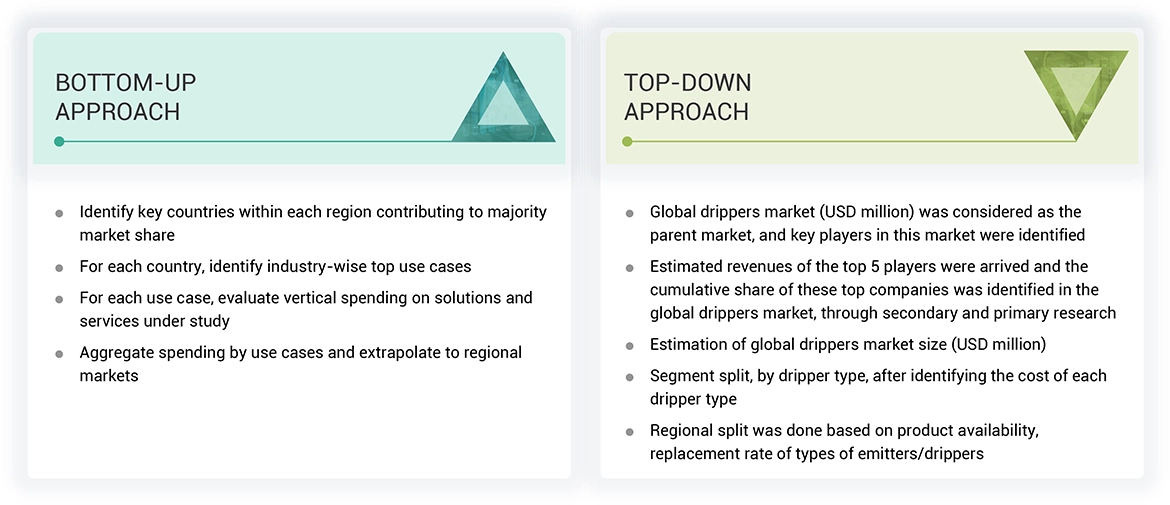
Both the top-down and bottom-up approaches were used to estimate and validate the total size of the drippers market. These methods were also used extensively to estimate the size of various subsegments in the market. The research methodology used to estimate the market size includes the following:

  • The key players were identified through extensive primary and secondary research.
  • The value chain and market size of the drippers market, in terms of value, were determined through primary and secondary research.
  • All percentage shares splits, and breakdowns were determined using secondary sources and verified through primary sources.
  • All possible parameters that affect the market covered in this research study were accounted for, viewed in extensive detail, verified through primary research, and analyzed to obtain the final quantitative and qualitative data.
  • The research included the study of reports, reviews, and newsletters of top market players, along with extensive interviews for opinions from key leaders, such as CEOs, directors, and marketing executives.

Data Triangulation

After arriving at the overall market size from the estimation process described above, the total market was split into several segments. Data triangulation and market breakdown procedures were employed, wherever applicable to complete the overall market engineering process and arrive at the exact statistics for all segments. The data was triangulated by studying various factors and trends from both the demand and supply sides. In addition, the market size was validated using both top-down and bottom-up approaches. It was then verified through primary interviews. Hence, three approaches were adopted—the top-down approach, the bottom-up approach, and the one involving expert interviews. Only when the values arrived at from the three points matches, the data is assumed to be correct.

Report Objectives

  • To describe and forecast the drippers market in terms of type, crop type, and region
  • To describe and forecast the drippers market, in terms of value, by region–North America, Europe, Asia Pacific, South America, and the rest of the world—along with their respective countries
  • To provide detailed information regarding the major factors influencing the market growth (drivers, restraints, opportunities, and challenges)
  • To strategically analyze micro-markets with respect to individual growth trends, prospects, and contributions to the overall market
  • To study the complete value chain of the drippers market
  • To analyze opportunities in the market for stakeholders by identifying the high-growth segments of the drippers market
  • To strategically profile the key players and comprehensively analyze their market positions, in terms of ranking and core competencies, along with details on the competitive landscape of market leaders
  • To analyze strategic approaches, such as expansions & investments, product launches & approvals, mergers & acquisitions, and partnerships in the drippers market

Available Customizations:

Based on the given market data, MarketsandMarkets offers customizations in the reports according to client-specific requirements. The available customization options are as follows:

Product Analysis

  • Product Matrix, which gives a detailed comparison of the product portfolio of each company

Geographic Analysis

  • Further breakdown of the Rest of Europe drippers market into Germany and Eastern European countries
  • Further breakdown of the Rest of Asia Pacific drippers market into the Philippines, Singapore, and Papua New Guinea.
  • Further breakdown of other countries in the Rest of the World drippers market by key countries

Company Information

  • Detailed analyses and profiling of additional market players (up to five)
Custom Market Research Services

We will customize the research for you, in case the report listed above does not meet with your exact requirements. Our custom research will comprehensively cover the business information you require to help you arrive at strategic and profitable business decisions.

Request Customization

Instant Answers with GPT - Ask Now!

Ask real questions. Get complete answers !
Report Code
AGI 8540
Published ON
Jan, 2023
Choose License Type
BUY NOW
  • SHARE
X
Request Customization
Speak to Analyst
Speak to Analyst
OR FACE-TO-FACE MEETING
PERSONALIZE THIS RESEARCH
  • Triangulate with your Own Data
  • Get Data as per your Format and Definition
  • Gain a Deeper Dive on a Specific Application, Geography, Customer or Competitor
  • Any level of Personalization
REQUEST A FREE CUSTOMIZATION
LET US HELP YOU!
  • What are the Known and Unknown Adjacencies Impacting the Drippers Market
  • What will your New Revenue Sources be?
  • Who will be your Top Customer; what will make them switch?
  • Defend your Market Share or Win Competitors
  • Get a Scorecard for Target Partners
CUSTOMIZED WORKSHOP REQUEST
+1-888-600-6441
  • Call Us
  • +1-888-600-6441 (Corporate office hours)
  • +1-888-600-6441 (US/Can toll free)
  • +44-800-368-9399 (UK office hours)
CONNECT WITH US
ABOUT TRUST ONLINE
©2024 MarketsandMarkets Research Private Ltd. All rights reserved
DMCA.com Protection Status Website Feedback