
Electronic Lab Notebook Market: Growth, Size, Share, and Trends

Electronic Lab Notebook Market by Deployment (Cloud (SaaS, PaaS, IaaS)), License (Proprietary, Open source), Component (Software, Services), Organization Size (SME, Large), End User (Pharma & Biotech, NGS, Biobank, Academia) - Global Forecast to 2030


OVERVIEW
Source: Secondary Research, Interviews with Experts, MarketsandMarkets Analysis
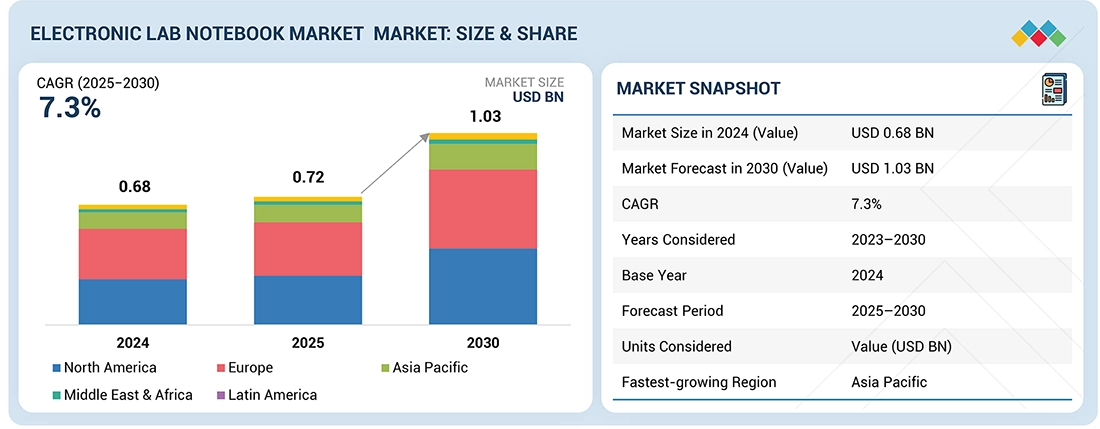
The global electronic lab notebook market is projected to reach USD 1.03 billion by 2030 from USD 0.72 billion in 2025, at a CAGR of 7.3% during the forecast period . The adoption of electronic lab notebooks (ELNs) is being driven by the growing emphasis on laboratory digitization, the rising need for efficient data management, and integrated compatibility with advanced technologies. Additionally, the growing use of ELNs within the life sciences sector is expected to fuel their adoption in the life sciences sector. The expanding role of biobanks is also contributing to this trend, as ELNs offer high efficiency in the storing & management of biobank data. As laboratories continue to automate, ELNs are increasingly replacing traditional paper-based notebooks .
KEY TAKEAWAYS
- The North Americ ELN Market accounted for a 40% revenue share in 2025.
- By product type, the specific ELN is expected to register the highest CAGR of 8.0%.
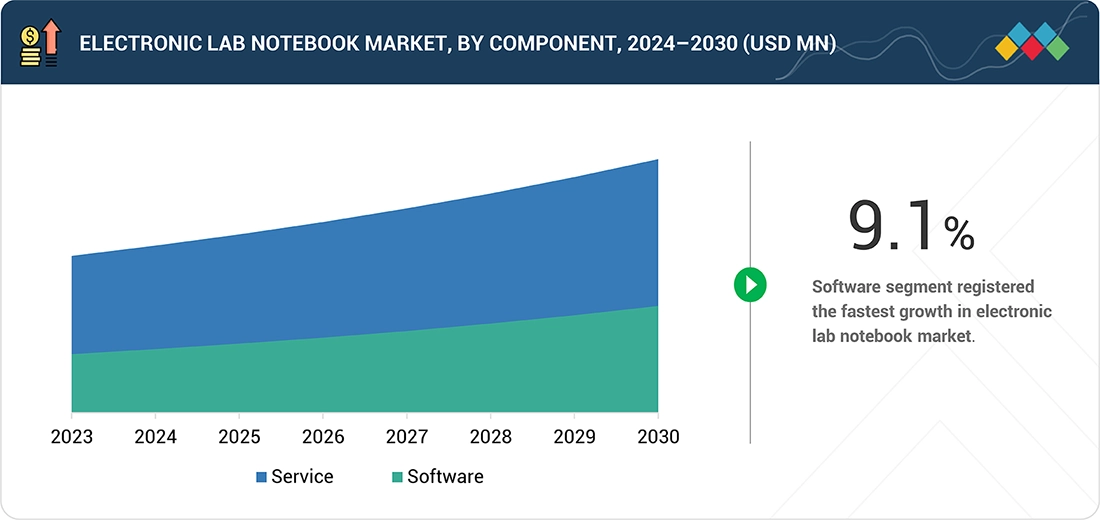
- By component, the software segment registered the fastest CAGR of 9.1% for the forecast period.
- By deployment, Cloud based model held the largest market share in 2024
- Based on license, the proprietary segment accounted for the largest share of the electronic lab notebook market.
- By organization size, the large organization segment accounted for the largest share of the electronic lab notebook market.
- By end user, the life sciences accounted for the largest share of the electronic lab notebook market in 2024.
- Major market players have adopted both organic and inorganic growth strategies, including partnerships and strategic investments, to strengthen their market presence. For instance, companies such as Benchling (US), Dassault Systèmes (France), and Thermo Fisher Scientific, Inc. (US) have entered into multiple collaborations and technology integrations to enhance their ELN offerings and address the growing demand for digital solutions in research and development. These initiatives aim to improve data management, support compliance, and accelerate innovation across pharmaceutical, biopharmaceutical, and academic research environments.
- Labtrack, Agaram Technologies, and Elabnext among others, have distinguished themselves among startups and SMEs by securing strong footholds in specialized niche areas, underscoring their potential as emerging market leaders
The electronic lab notebook (ELN) market is witnessing steady growth, driven by the increasing focus on laboratory digitization, rising technological advancements, and the superior advantages of ELNs over conventional paper-based notebooks. The growing R&D expenditure by pharmaceutical and biopharmaceutical companies is further accelerating adoption, as organizations seek to enhance data accuracy, streamline workflows, and ensure regulatory compliance. New partnerships between software providers and research institutions, investments in cloud-based platforms, and innovations in data security and AI-driven data management are reshaping the industry landscape.
TRENDS & DISRUPTIONS IMPACTING CUSTOMERS' CUSTOMERS
The impact on consumers' business emerges from customer trends or disruptions. Hotbets are clients of Electronic Lab Notebook providers, and target applications are clients of a Electronic Lab Notebook providers. Shifts, which are changing trends or disruptions, will impact the revenues of end users. The revenue impact on end users will affect the revenue of hotbets, which will further affect the revenues of Electronic Lab Notebook providers.
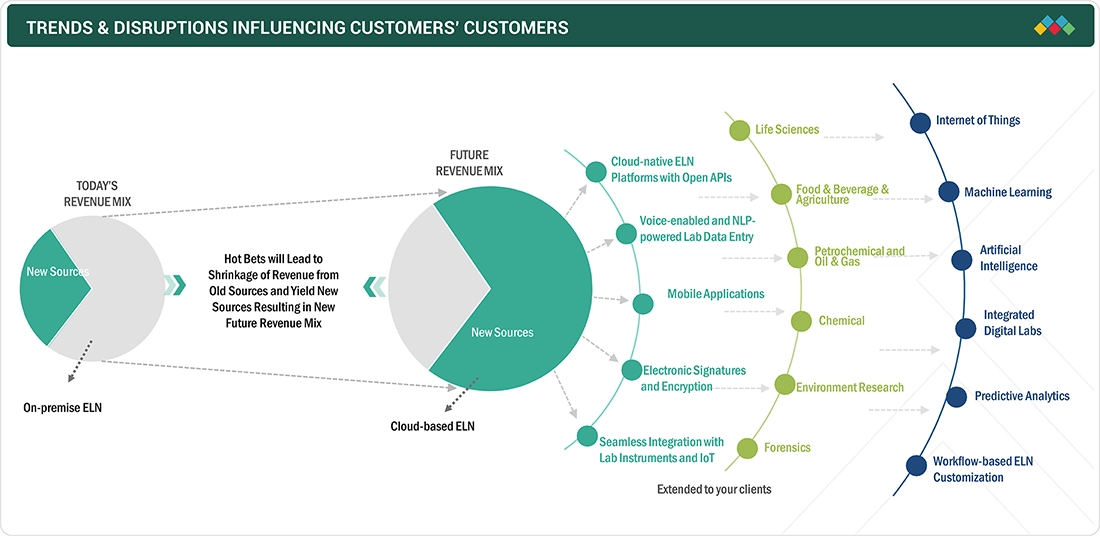
Source: Secondary Research, Interviews with Experts, MarketsandMarkets Analysis
MARKET DYNAMICS
Level
-
Increasing focus on laboratory digitization

-
Growing R&D expenditure in pharmaceutical & biotechnology industries

Level
-
Data security & privacy concerns

-
High initial installation cost of electronic lab notebooks

Level
-
High growth potential of emerging economies

-
Rising adoption of cloud-based solutions

Level
-
Integration with existing systems

-
Dearth of trained professionals

Source: Secondary Research, Interviews with Experts, MarketsandMarkets Analysis
Driver:Increasing focus on laboratory digitization
The electronic lab notebook (ELN) market is experiencing rapid growth, primarily driven by the ongoing digital transformation in the healthcare sector. Organizations are increasingly focusing on efficiency, accuracy, and collaboration in their research and development efforts, which is boosting the demand for ELNs. These digital tools allow researchers and clinicians to share information in real time, providing immediate access to critical data—an essential feature for effective multidisciplinary collaboration. In addition to enhancing compliance with regulatory standards, ELNs facilitate faster insights and informed decision-making, offering significant advantages over traditional paper-based systems.
Restraint: Data security & privacy concerns
Data security and privacy concerns are significant barriers to the widespread adoption of Electronic Lab Notebooks (ELNs), particularly in research-intensive sectors such as pharmaceuticals, biotechnology, and academia. Laboratory environments often handle highly sensitive information, including proprietary research, clinical trial data, and personal health records. Breaches in data security can result in financial losses, damage to reputation, and, in severe cases, legal consequences. As cloud-based ELNs become more common, users have raised concerns about the safety of their data during transmission and once it is stored on third-party servers. Despite advancements in encryption and cybersecurity technologies, risks related to unauthorized access, data theft, and maintaining data integrity continue to pose challenges. These concerns are especially pronounced in regions with strict data protection regulations, such as the EU's General Data Protection Regulation (GDPR) and the US Health Insurance Portability and Accountability Act (HIPAA).
Opportunity:High growth potential of emerging economies
The electronic lab notebooks market has substantial growth potential, particularly owing to the increasing adoption in emerging markets. The ongoing industrialization and development in regions such as the Asia Pacific, Latin America, and the Middle East can accelerate the need for modern laboratory solutions. To enhance their global competitiveness, these regions are prioritizing digitization and direct investments in science. For instance, electronic lab notebooks are well-suited for projects focused on building smart laboratories and research centers.
Challenge: Integration with existing systems
A primary challenge of the ELN market is the integration of existing systems into technologically advanced ELN solutions. Several laboratories prefer and utilize legacy data management systems or outdated software that cannot support modern ELNs. As part of their research workflows, labs use Laboratory Information Management Systems (LIMS), data analysis software, and instrument management systems. Integrating ELNs with these existing systems is essential to avoid creating isolated data islands and to ensure that workflows are harmonized. However, the diversity in technology configurations and their ability to interconnect often leads to disruptions in laboratory functions, which can result in additional costs during the transition process.
Electronic Lab Notebook Market: COMMERCIAL USE CASES ACROSS INDUSTRIES
| COMPANY | USE CASE DESCRIPTION | BENEFITS |
|---|---|---|
 |
Implemented ELNs integrated with laboratory instruments and LIMS to automate data capture and streamline experimental workflows in life sciences research. | Reduced manual data entry errors, accelerated research timelines, and improved traceability and compliance with regulatory standards. |
 |
Deployed a unified ELN and scientific data management platform to support modeling, simulation, and collaborative research across global R&D teams. | Enhanced collaboration, enabled scalable digital lab infrastructure, and improved reproducibility and innovation across scientific disciplines. |
 |
Integrated ELNs with analytical instruments and sample tracking systems to support regulated environments such as pharmaceutical and biotech labs. | Allowed real-time data capture, simplified regulatory compliance, and increased laboratory productivity and operational efficiency. |
 |
Tailored ELN solutions for analytical chemistry workflows, integrating data from chromatography and mass spectrometry instruments. | Centralized complex analytical data, improved data integrity, and facilitated faster decision-making in both quality control and research settings. |
 |
Offered a web-based ELN integrated with LIMS and SDMS to manage multidisciplinary research and quality assurance processes. | Enabled seamless data flow across laboratory systems, improved experiment documentation, and supported both R&D and QA/QC operations with enhanced efficiency. |
Logos and trademarks shown above are the property of their respective owners. Their use here is for informational and illustrative purposes only.
MARKET ECOSYSTEM
The electronic lab notebook (ELN) market ecosystem comprises cloud infrastructure providers, software developers, and a broad base of end users across multiple industries. Leading players such as Benchling, Dassault Systèmes, and Thermo Fisher Scientific, Inc. offer advanced platforms that enable secure, compliant, and collaborative data management. Supported by IT and cloud service vendors, these solutions serve pharmaceutical and biotechnology companies, CROs, academic and clinical research labs, as well as petrochemical, oil & gas, chemical, food & beverage, agriculture, and environmental sectors. Collaboration across this value chain is crucial to drive digital transformation and enhance R&D efficiency.
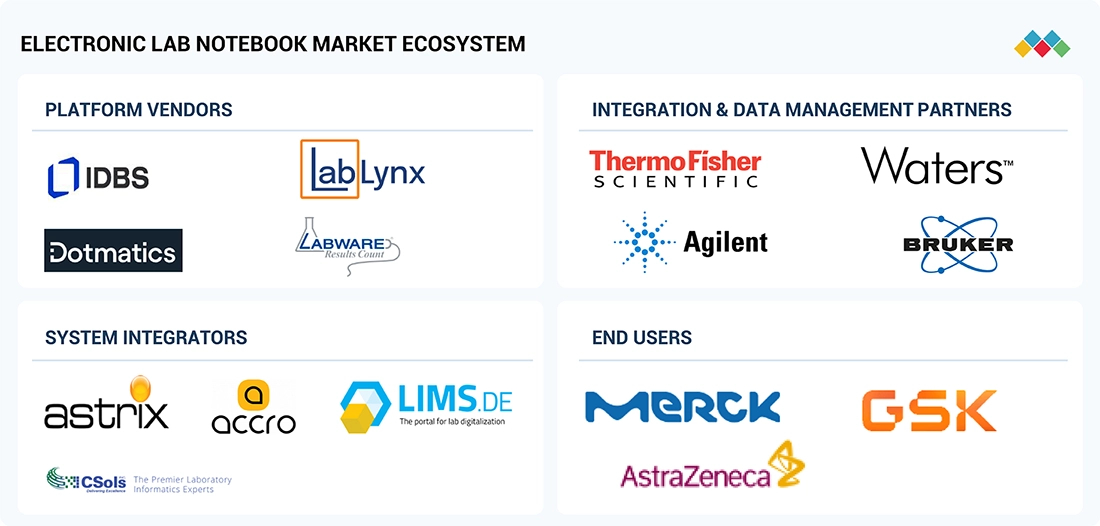
Logos and trademarks shown above are the property of their respective owners. Their use here is for informational and illustrative purposes only.
MARKET SEGMENTS
Source: Secondary Research, Interviews with Experts, MarketsandMarkets Analysis
ELECTRONIC LAB NOTEBOOK MARKET BY PRODUCT TYPE
By product type, the electronic lab notebook market is divided into cross-disciplinary and specific ELN. Specific ELNs registered fastest growth for the forecast period, driven by the rising demand for tailored solutions that address the unique workflows and compliance requirements of specialized research areas. Specific ELNs offer customized functionalities, enhanced data structuring, and integration capabilities for domains such as pharmaceutical development, biotechnology, and clinical research, enabling higher operational efficiency and accuracy. The increasing focus on regulatory adherence, reproducibility of experiments, and domain-specific data management further fuels the adoption of specific ELN solutions across research-intensive organizations.
ELECTRONIC LAB NOTEBOOK MARKET BY PRODUCT TYPE BY COMPONENET
By component ELN maket is divided into software and services. The service segment held the largest market share in 2024, driven by the growing demand for implementation, training, and support services associated with electronic lab notebook (ELN) deployment. Organizations increasingly rely on professional services to ensure seamless integration with existing laboratory systems, optimize workflow efficiency, and maintain regulatory compliance. Additionally, ongoing maintenance, customization, and technical support requirements across diverse industries further reinforce the prominence of the service segment in the ELN market.
ELECTRONIC LAB NOTEBOOK MARKET BY PRODUCT TYPE BY DEPLOYMENT MODE
By deployment model ELN market includes cloud based model, cloud based model & hybrid model. In 2024 Cloud based model held the largest market share as well as the fastest growth for the forecast period, driven by its scalability, cost-effectiveness, and ease of implementation. Cloud-based ELNs enable real-time data access, seamless collaboration across distributed teams, and automatic software updates, reducing the need for on-premises IT infrastructure. Additionally, increasing adoption of digital transformation initiatives in research-intensive industries and the growing emphasis on data security and regulatory compliance further reinforce the preference for cloud-based solutions.
ELECTRONIC LAB NOTEBOOK MARKET BY PRODUCT TYPE BY LICENSE
Based on license, electronic lab notebook is segmented into proprietary and open-source ELN. In 2024, the proprietary segment accounted for the largest share as well as the fastest growth for the forecast period of the electronic lab notebook market. Proprietary software licenses offer advanced customization and integration capabilities tailored to specific organizational workflows and regulatory demands. These features provide a competitive advantage by supporting strong data security and compliance. The source code in proprietary systems is controlled by the software owner and often includes exclusive features, making it generally more secure than open-source alternatives—an aspect that continues to drive demand for proprietary solutions.
ELECTRONIC LAB NOTEBOOK MARKET BY PRODUCT TYPE BY ORGANIZATION SIZE
By organization size, the electronic lab notebook market has been segmented into small & medium and large organizations. The small & medium organizations registered the fastest growth for the forecast period, driven by the increasing adoption of digital solutions to enhance research efficiency, collaboration, and data management without the need for extensive IT infrastructure. Cloud-based ELN offerings, cost-effective subscription models, and scalable deployment options make these solutions particularly attractive to small and medium enterprises. Additionally, rising R&D investments and the need to comply with regulatory standards are encouraging these organizations to transition from traditional paper-based systems to digital lab notebooks.
ELECTRONIC LAB NOTEBOOK MARKET BY PRODUCT TYPE BY END USER
By end user, the ELN market is segmented into life sciences, food & beverage and agriculture, petrochemicals and oil & gas, chemical industry, environmental research, and other end users. In 2024 Life Science segment held the largest market share as well as registered the highest growth for the forecast period,driven by increasing R&D activities in pharmaceutical and biotechnology companies. The segment benefits from the need for efficient data management, regulatory compliance, and collaborative research across geographically distributed teams. Additionally, the adoption of ELNs facilitates streamlined workflows, improved data integrity, and enhanced reproducibility of experiments, making them indispensable for life sciences organizations engaged in drug discovery, clinical research, and biopharmaceutical development.
ELECTRONIC LAB NOTEBOOK MARKET BY PRODUCT TYPE BY REGION
The electronic lab notebook market is studied for the five major regions: North America, Europe, the Asia Pacific, Latin America, and the Middle East & Africa. In 2024, North America accounted for the largest share of the global electronic lab notebook (ELN) market. Factors such as the rising demand for laboratory automation, the increasing need for technologically advanced platforms, and various strategic initiatives by key industry players are anticipated to drive market growth throughout the forecast period.
REGION
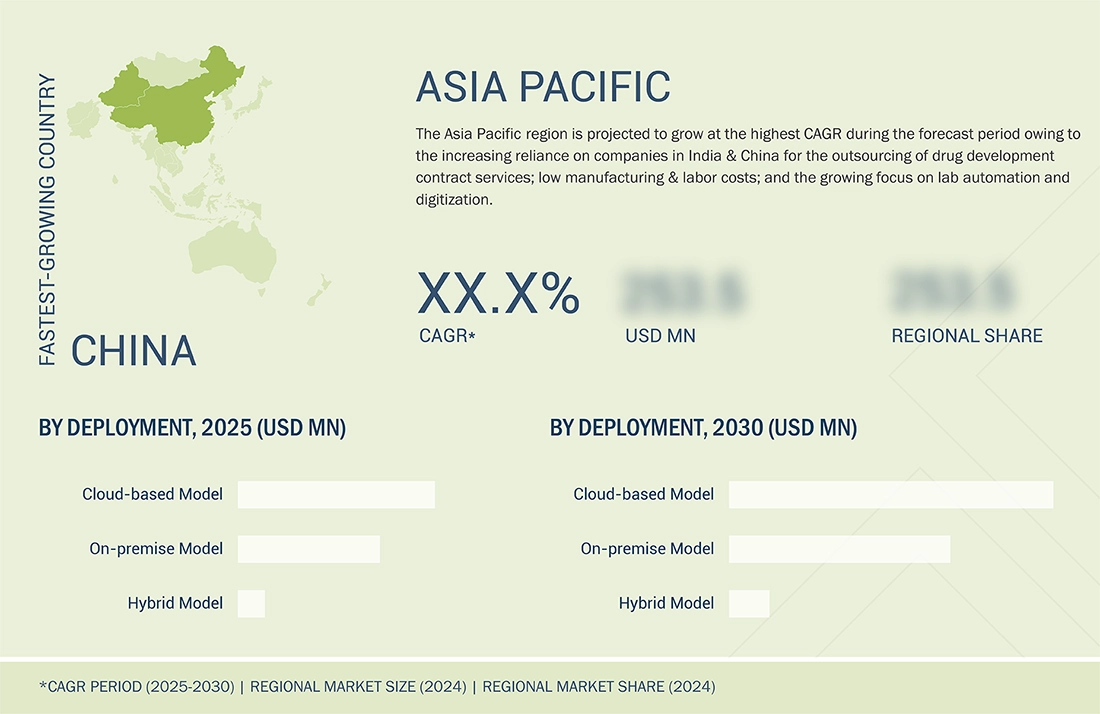
Asia Pacific to be fastest-growing region in global aerospace materials market during forecast period
The Asia Pacific electronic lab notebook market is projected to grow at the highest CAGR during the forecast period owing to the increasing reliance on companies in India & China for the outsourcing of drug development contract services; low manufacturing & labor costs; and the growing focus on lab automation and digitization. Supportive initiatives by the government & other private players in the market for the expansion of healthcare infrastructure are expected to also provide an impetus for the adoption of electronic lab notebooks during the forecast period.
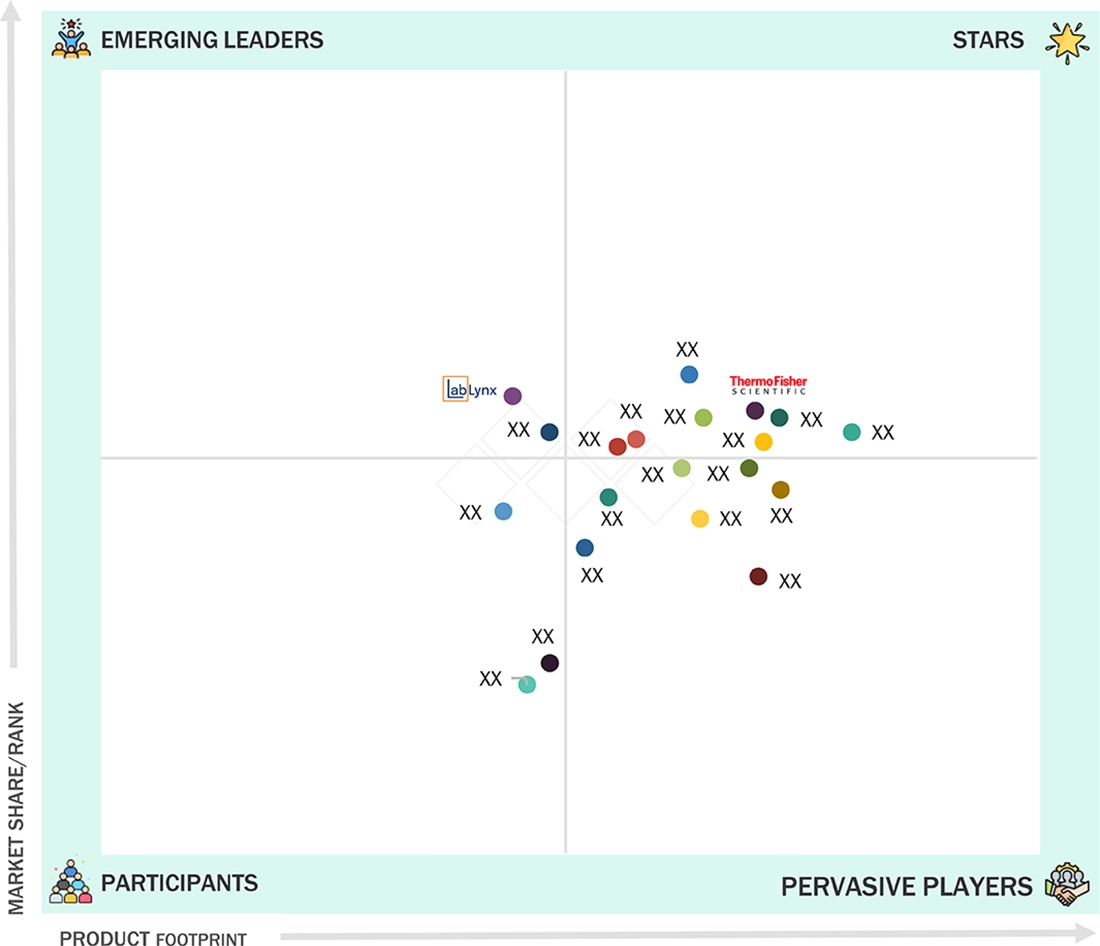
Electronic Lab Notebook Market: COMPANY EVALUATION MATRIX
In the electronic lab notebook (ELN) market matrix, Thermo Fisher Scientific, Inc. (Star) leads with a strong market share and a comprehensive product portfolio, driven by its robust ELN solutions widely adopted across pharmaceutical, biotechnology, and academic research organizations. LabLynx, Inc. (Emerging Player) is gaining traction with its flexible, cloud-based ELN offerings and tailored solutions for niche laboratory workflows, strengthening its presence through innovation and customer-centric services. While Thermo Fisher dominates through scale, extensive integrations, and brand recognition, LabLynx demonstrates significant potential to advance toward the leaders’ quadrant as demand for customizable, efficient, and compliant digital lab solutions continues to grow.
Source: Secondary Research, Interviews with Experts, MarketsandMarkets Analysis
KEY MARKET PLAYERS
MARKET SCOPE
| REPORT METRIC | DETAILS |
|---|---|
| Market Size in 2024 (Value) | USD 0.68 Billion |
| Market Forecast in 2030 (Value) | USD 1.03 Billion |
| Growth Rate | CAGR of 7.3% from 2025-2030 |
| Years Considered | 2023-2030 |
| Base Year | 2024 |
| Forecast Period | 2025-2030 |
| Units Considered | Value (USD Million/Billion) |
| Report Coverage | Revenue forecast, company ranking, competitive landscape, growth factors, and trends |
| Segments Covered |
|
| Regions Covered | North America, Asia Pacific, Europe, Latin America, Middle East & Africa |
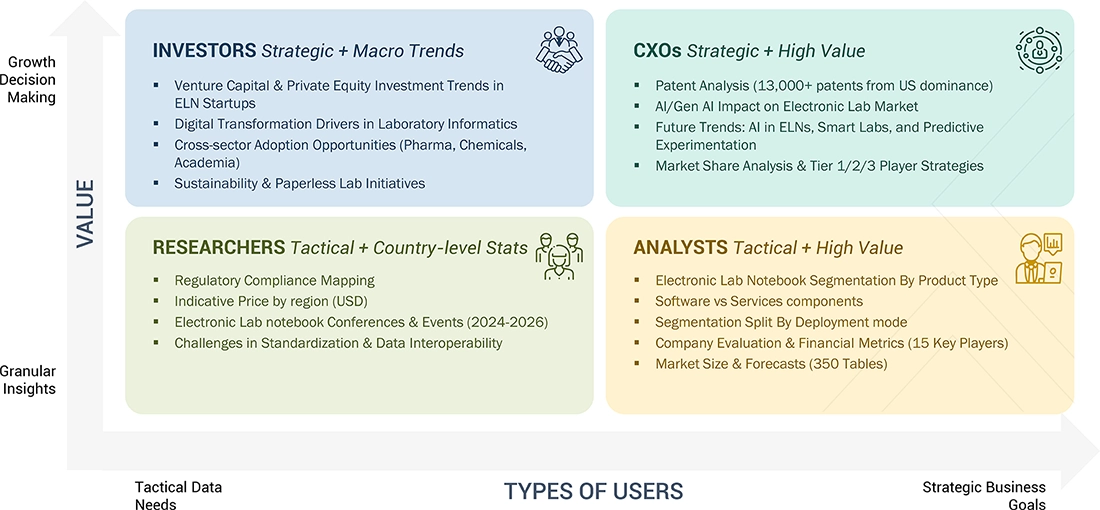
WHAT IS IN IT FOR YOU: Electronic Lab Notebook Market REPORT CONTENT GUIDE
RECENT DEVELOPMENTS
- June 2024 : Labguru (BioData) (US) entered into an agreement with Thermo Fisher Scientific (US) to enable the distribution of its state-of-the-art Labguru Electronic Lab Notebook (ELN) module alongside Thermo Fisher’s suite of Laboratory Information Management System (LIMS) and lab operations software solutions.
- March 2024 : Revvity, Inc. (US) launched the ChemDraw, a premier chemistry communication tool that can be integrated into Revvity Signals Research platform, thus enhancing research productivity and innovation across chemical, pharmaceutical, and biotechnology industries.
- November 2023 : Körber AG (Germany) collaborated with LabWare (US) to integrate PAS-X MES with LabWare’s LIMS following the launch of Körber's "PAS-X LIMS Integration" program. This program, part of the Körber Ecosystem, simplifies LIMS integration with Körber's PAS-X MES, reducing effort and risk. It employs a standardized interface, allowing PAS-X MES and LIMS to efficiently exchange sample requests, data, and results, streamlining processes and minimizing errors in the pharma and biopharma industry.
- August 2023 : STARLIMS Corporation (US) expanded its solution suite by acquiring Labstep (UK), an R&D ELN company. This strategic move combines STARLIMS’ LIMS with Labstep's user-friendly ELN platform, streamlining data management from R&D to market surveillance in a progressive, connected system. The acquisition addresses the demand for intuitive technology in the research sector to enhance operational efficiencies, data management, and compliance.
Table of Contents
 Exclusive indicates content/data unique to MarketsandMarkets and not available with any competitors.
Methodology
The study involved comprehensive efforts to estimate the current size of the electronic lab notebook (ELN) market. Extensive secondary research was conducted to gather information about the market. The next step was to validate these findings, assumptions, and estimations by consulting industry experts throughout the value chain through primary research. Various methods were employed to calculate the overall market size, including top-down and bottom-up approaches. Subsequently, market segmentation and data triangulation processes were utilized to determine the sizes of the segments and subsegments within the electronic lab notebook market.
Secondary Research
This research study extensively utilized secondary sources, including directories and databases such as Dun & Bradstreet, Bloomberg Businessweek, and Factiva. It also incorporated white papers, annual reports, company documents, investor presentations, and SEC filings. The market analysis for companies providing electronic lab notebook solutions was conducted using both paid & unpaid secondary data. This involved examining the product portfolios of major companies in the sector and evaluating their performance and quality. Various sources were consulted throughout the secondary research process to gather relevant information. These included annual reports, press releases, investor presentations, white papers, academic journals, certified publications, articles by recognized authors, directories, and databases.
The secondary research process referred to various secondary sources to identify & collect information related to the study. These sources included annual reports, press releases, investor presentations of electronic lab notebook vendors, forums, certified publications, and whitepapers. The secondary research was used to obtain critical information on the industry’s value chain, the total pool of key players, market classification, and segmentation from the market & technology-oriented perspectives.
Primary Research
In the primary research process, various sources from both the supply & demand sides were interviewed to obtain qualitative & quantitative information for this report. Primary sources are mainly industry experts from the core and related industries and preferred suppliers, manufacturers, distributors, technology developers, researchers, and organizations related to all segments of this industry’s value chain. In-depth interviews were conducted with various primary respondents, including key industry participants, subject-matter experts (SMEs), C-level executives of key market players, and industry consultants, among other experts, to obtain and verify the critical qualitative and quantitative information and assess prospects.
Primary research was conducted to identify segmentation types; industry trends; key players; and key market dynamics such as drivers, restraints, opportunities, challenges, industry trends, and strategies adopted by key players.
After the complete market engineering (calculations for market statistics, market breakdown, market size estimations, market forecasting, and data triangulation), extensive primary research was conducted to gather information and verify & validate the critical numbers arrived at.
In the complete market engineering process, the top-down and bottom-up approaches and several data triangulation methods were extensively used to perform the market estimation and market forecasting for the overall market segments and subsegments listed in this report. Extensive qualitative and quantitative analysis was performed on the complete market engineering process to list the key information/insights throughout the report.
Breakdown of the Primary Respondents:

*Others include sales managers, marketing managers, and product managers.
Note: Tiers are defined based on a company’s total revenue. As of 2024: Tier 1 = >USD 1 billion, Tier 2 = USD 500 million to USD 1 billion, and Tier 3 = < USD 500 million.
To know about the assumptions considered for the study, download the pdf brochure
Market Size Estimation
The market size estimates, and forecasts provided in this study are derived through the bottom-up approach (revenue share analysis of leading players) and the top-down approach (assessment of utilization/adoption/penetration trends by component, product, deployment mode, end user, and region).

Data Triangulation
The market was split into several segments and subsegments after arriving at the overall market size—using the market size estimation processes. Data triangulation and market breakdown procedures were employed to complete the overall market engineering process and arrive at the exact statistics of each market segment and sub-segment. The data was triangulated by studying various factors and trends from the demand and supply sides in the electronic lab notebook (ELN) market.
Market Definition
An Electronic Lab Notebook (ELN) designs, executes, and documents research, experiments, and assays. Scientists and lab technicians frequently utilize ELNs in the life sciences industry. Molecular biology, genetics, biochemistry, pharmacology, and microbiology are life science fields that extensively utilize ELNs. Researchers in these areas use ELNs to document observations, manage experimental data, collaborate with colleagues, and record experimental protocols.
Stakeholders
- Electronic Lab Notebook Software Vendors
- Electronic Lab Notebook Service Providers
- Independent Software Vendors (ISVs)
- Platform Providers
- Forums, Alliances, and Associations
- Government Organizations
- Institutional Investors and Investment Banks
- Investors/Shareholders
- Venture Capitalists
- Research & Consulting Firms
Report Objectives
- To define, describe, and forecast the global electronic lab notebook market based on product, component, deployment mode, license, organization size, and end user
- To provide detailed information regarding the factors influencing the growth of the market (such as the drivers, restraints, opportunities, and challenges)
- To strategically analyze micromarkets with respect to individual growth trends, prospects, and contributions to the overall electronic lab notebook market
- To analyze market opportunities for stakeholders and provide details of the competitive landscape for market leaders
- To forecast the size of the electronic lab notebook in five regions with country-level segmentation: North America, Europe, the Asia Pacific, Latin America, and the Middle East & Africa
- To profile key players and comprehensively analyze their product portfolios, market positions, and core competencies in the market
- To track and analyze competitive developments such as product launches; expansions; partnerships, agreements, collaborations, and acquisitions in the electronic notebook market
- To benchmark players within the electronic lab notebook market using the Company Evaluation Matrix framework, which analyzes market players on parameters within the broad categories of business strategy, market share, and product offering
Frequently Asked Questions(FAQ)
Who are the top industry players in the global electronic lab notebook market?
The top market players in the global electronic lab notebook market include Revvity, Inc. (US), Dassault Systèmes (France), Benchling (US), Thermo Fisher Scientific, Inc. (US), and Waters Corporation (US), among others.
Which components have been included in the electronic lab notebook market report?
This report contains the following components:
- Software
- Services
Which region will dominate the global electronic lab notebook market during the forecast period?
The global electronic lab notebook market is segmented into North America, Europe, the Asia Pacific, Latin America, and the Middle East & Africa. The Asia Pacific region is expected to grow at the highest CAGR during the forecast period.
What are the end users profiled in the electronic lab notebook market?
The report contains the following end-user segments:
- Life Sciences
- Agriculture and Food & Beverage
- Petrochemicals and Oil & Gas
- Chemical Industry
- Environmental Research
- Other End Users
What is the total CAGR projected for the electronic lab notebook market from 2025 to 2030?
The electronic lab notebook market is projected to reach a CAGR of 7.3% during the forecast period (2025−2030).
Need a Tailored Report?
Customize this report to your needs
Get 10% FREE Customization
Customize This ReportPersonalize This Research
- Triangulate with your Own Data
- Get Data as per your Format and Definition
- Gain a Deeper Dive on a Specific Application, Geography, Customer or Competitor
- Any level of Personalization
Let Us Help You
- What are the Known and Unknown Adjacencies Impacting the Electronic Lab Notebook Market
- What will your New Revenue Sources be?
- Who will be your Top Customer; what will make them switch?
- Defend your Market Share or Win Competitors
- Get a Scorecard for Target Partners

Custom Market Research Services
We Will Customise The Research For You, In Case The Report Listed Above Does Not Meet With Your Requirements
Get 10% Free CustomisationTESTIMONIALS

JAYANT RAJPUROHIT
Director of Market Insights, Data and Analytics
SFI Health,
Leading Pharmaceutical Companywww.sfihealth.com/

We at SFI Health approached MarketsandMarkets for an Opportunity Assessment on "Incidence and Prevalence of Focus Indications" as we wanted to know the most attractive HCPs like Physician, Functional MD, Naturopath and Pharmacist. The project was critical for us to ensure our focus on the right target which would enable sustainable growth and profitability for SFI Health. The business insights provided exceeded our expectations and we were extremely impressed. The team at MarketsandMarkets is highly professional and detail oriented and very well understood our business needs. MarketsandMarkets offers a unique combination of expertise and dedicated engagement model. We identified 2 new products to be launched in coming months, based on the research findings provided by MarketsandMarkets. We are happy with the services and would strongly recommend MarketsandMarkets to my peers in the industry.

BEATRIZ DE LA CALLE
Head of Commercial Analytics
Qualicaps,
Leading Pharmaceutical Companywww.qualicaps.com/

We partnered with MarketsandMarkets for an assessment study on hard empty capsules. The team was extremely professional in understanding our business requirements and we received timely responses to all our queries. The market intelligence and the recommendations has met our business requirements. We were extremely impressed to see the final study results; it really exceeded our expectations. The market intelligence offered by MarketsandMarkets, and clarity on next steps will help us achieve our business objective for the Year 2021. We are happy with the services and would strongly recommend MarketsandMarkets to my peers in the industry.

Bob Williams,
Senior Director Business Development & Innovation
Bracco Diagnostics Inc.,
Italian Multinational in life sciences sector and a World Leader in imaging diagnosticsimaging.bracco.com/us-en
We were pleased with targeted insights that MarketsandMarkets identified from a custom study on the 'Radiation Dose Management Solutions Market'. Your team identified and characterized the market participants as well as underlying trends accurately. This study was useful to Bracco in formulating business strategies for our dose monitoring product lines and we thank MarketsandMarkets for the job well done.
Cody Coonradt,
Market Development and Strategy Manager
3M Health Information Systems,
Leader in Health care Coding, Payment & Analytics Solutions.www.3m.com/3M/en_US/health-information-systems-us
The value for our organization comes from three things: depth of research, specificity of segments and being easy to work with. As important as the first two are, the third can't be underestimated. MarketsandMarkets, maybe more than any other research vendor, wants to know what is top of mind for our team and what big questions we are grappling to answer.
Their customer first approach and high value engagement model, have given us great analysis and excellent value for money


Growth opportunities and latent adjacency in Electronic Lab Notebook Market