
Emollient Market

Emollient Market by Type (Esters, Fatty Alcohols, Fatty Acids, Ethers, Silicones, and Other Types), Form (Solid, Liquid), Application (Skin Care, Hair Care, Deodorants, Oral Care, and Other Applications), and Region - Global Forecast to 2030


OVERVIEW
Source: Secondary Research, Interviews with Experts, MarketsandMarkets Analysis
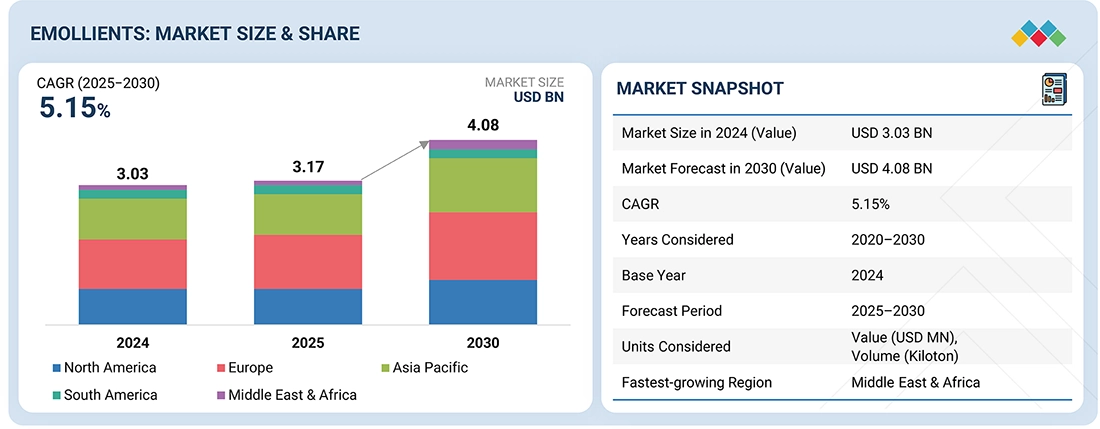
The emollients market is expected to reach USD 4.08 billion by 2030, up from USD 3.17 billion in 2025, at a CAGR of 5.15% from 2025 to 2030. Emollients are essential ingredients in personal care and cosmetic products, working by softening and smoothing the skin or hair while minimizing transepidermal water loss. They serve as conditioning agents that enhance spreadability, texture, and product stability, making them crucial components in moisturizers, body lotions, sunscreens, deodorants, and hair care items. The market growth is mainly driven by increasing consumer demand for multifunctional and premium products, the rising influence of wellness and grooming trends, and the growing adoption of bio-based, sustainable ingredients supported by regulatory encouragement in key regions.
KEY TAKEAWAYS
-
BY TYPEThe emollients market encompasses esters, fatty alcohols, fatty acids, ethers, silicones, and other categories. Esters predominate due to their favorable attributes, including a lightweight texture, non-greasy sensation, and excellent spreadability, rendering them particularly popular in skincare formulations such as lotions, creams, and serums. Their compatibility with a broad spectrum of active ingredients and formulation systems enables manufacturers to develop both mass-market and premium products that offer superior consumer experiences. Moreover, their increased production from bio-based sources aligns with the growing demand for sustainable and natural components within the cosmetics and personal care industries.
-
BY FORMThe emollients market by form includes liquid and solid types. Liquids predominate because of their ease of formulation, smooth application, and high compatibility with lotions, serums, and creams. Their ability to provide lightweight textures and quick absorption matches the rising consumer demand for non-greasy, everyday skincare.
-
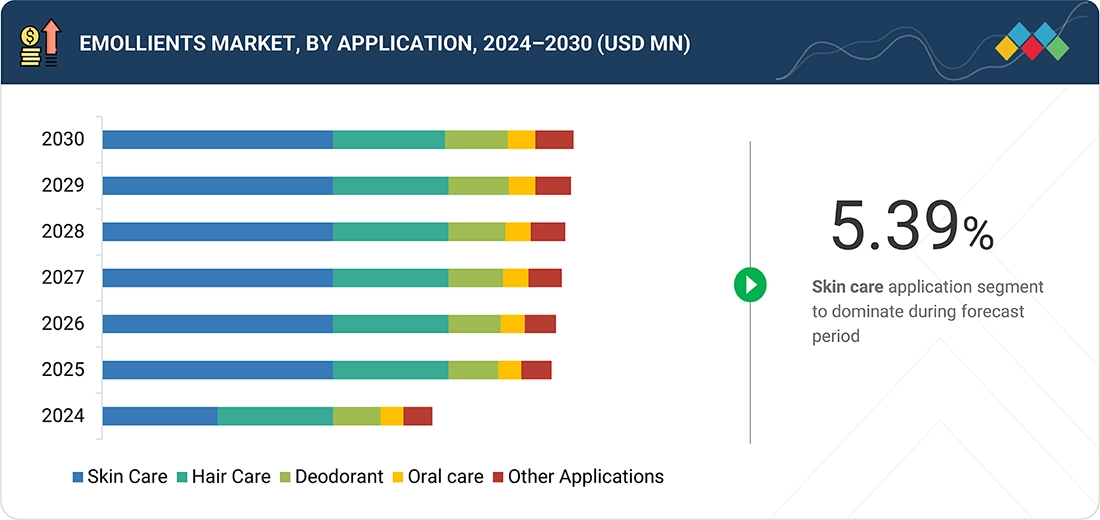
BY APPLICATIONThe emollients market, categorized by application, encompasses skincare, hair care, deodorants, oral care, and other sectors. Skincare leads the market, indicative of increasing consumer interest in hydration, anti-aging properties, and sun protection solutions. Emollients play a fundamental role in moisturizers, lotions, and creams by providing softness, enhanced spreadability, and barrier repair. The escalating consumer preference for high-performance and multifunctional skincare products further propels market demand.
-
BY REGIONEurope led the emollients market due to the strong consumer preference for high-quality and safe personal care products, supported by stringent regulations like REACH. These rules ensure ingredient safety, transparency, and sustainability, driving manufacturers to innovate with bio-based and compliant emollients, strengthening Europe’s position as a hub for premium personal care formulations.
-
COMPETITIVE LANDSCAPEKey industry players are adopting both organic and inorganic growth strategies, including new product launches, partnerships, and acquisitions, to strengthen their portfolios and global presence. Companies like BASF SE, Croda International Plc, Evonik Industries AG, Clariant AG, and The Lubrizol Corporation are investing heavily in bio-based and multifunctional emollient technologies. Several players are also focusing on partnerships with cosmetic manufacturers to provide tailored solutions that balance performance, sustainability, and cost efficiency.
The emollients market is expected to grow steadily over the next decade, driven by rising demand for sustainable personal care options, increasing consumer awareness of wellness and skin health, and the move toward multifunctional, high-quality formulations. As innovation progresses, emollients will continue to be a key element in product development within the beauty and personal care sectors, providing comfort, performance, and enhanced sensory experiences for users worldwide.
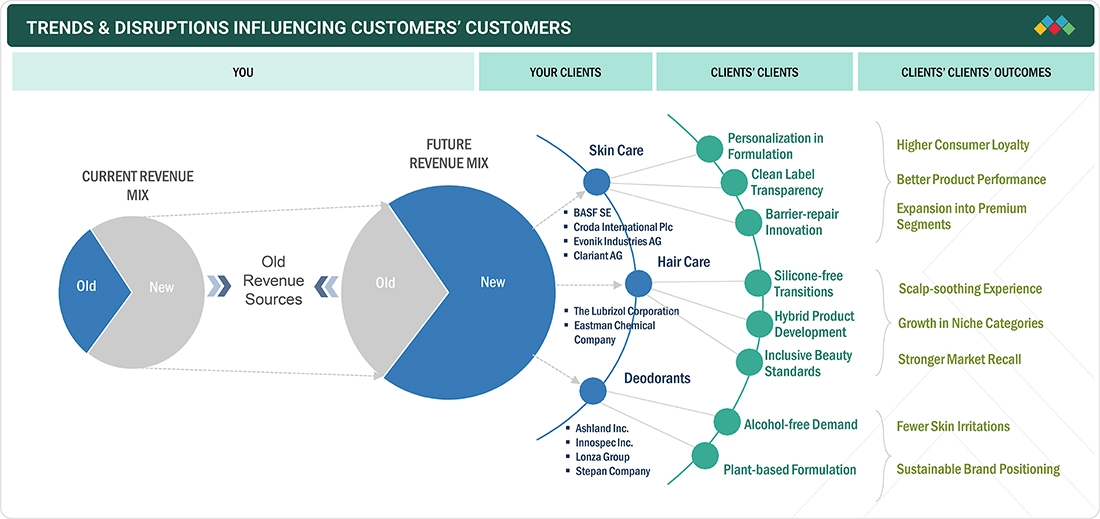
TRENDS & DISRUPTIONS IMPACTING CUSTOMERS' CUSTOMERS
The influence on consumers’ enterprises arises from emerging trends and disruptions. Personal care brands in skincare, hair care, and deodorants serve as immediate clients for emollient suppliers, with their particular product formulations representing the end-use applications. Innovations concerning textures, sensory experiences, and product performance drive consumer acceptance, thereby directly impacting revenues at the end-user level. These developments, in turn, influence the demand and strategic priorities of emollient manufacturers, affecting their overall market expansion and competitive stance.
Source: Secondary Research, Interviews with Experts, MarketsandMarkets Analysis
MARKET DYNAMICS
Level
-
Growing consumer focus on skin care

-
Increasing demand for natural and sustainable ingredients

Level
-
Raw material price volatility

-
Regulatory complexities and compliance costs

Level
-
Expansion in emerging markets

-
Advanced functional benefits

Level
-
Balancing performance and sustainability

-
Formulation complexity and compatibility issues

Source: Secondary Research, Interviews with Experts, MarketsandMarkets Analysis
Driver: Increasing demand for natural and sustainable ingredients
Growing consumer awareness about wellness and environmental impact is increasing the demand for natural and sustainable emollients. Plant-based, renewable, and non-toxic ingredients are becoming more popular in skincare, hair care, and deodorants. Manufacturers need to develop bio-based solutions that maintain performance and sensory quality. Brands that adopt natural emollients stand out and build customer loyalty. Aligning R&D with sustainability offers a competitive edge and market relevance, benefiting both premium and mass-market personal care segments worldwide.
Restraint: Raw material price volatility
Emollient manufacturers experience fluctuations in the price of key raw materials, including natural oils, esters, and synthetics, driven by weather, geopolitical events, and trade conditions. This volatility impacts formulation costs, profit margins, and supply chain stability. Companies need to use diversified sourcing, long-term contracts, and risk management strategies. Managing raw material challenges effectively without compromising quality or performance is vital for maintaining growth, especially as demand for high-quality, bio-based emollients rises in personal care markets worldwide.
Opportunity: Expansion in emerging markets
Rising disposable incomes, urbanization, and increasing awareness of personal care in Asia Pacific, South America, and the Middle East are creating significant growth opportunities for emollients. Consumers are increasingly seeking skincare, hair care, and deodorant products that offer hydration, nourishment, and comfort. Manufacturers can take advantage of this trend by forming local partnerships, implementing targeted marketing, and developing innovative formulations. Expanding distribution channels and launching multifunctional or premium emollients help attract new consumers and generate additional revenue in these rapidly growing markets.
Challenge: Balancing performance and sustainability
Emollient manufacturers face the challenge of creating formulations that provide desirable texture, quick absorption, and a pleasing sensory experience while achieving sustainability goals. Products must meet regulations, stay stable across different uses, and satisfy consumer expectations for effectiveness and luxury. Finding this balance helps brands stand out, builds consumer trust, and keeps them competitive in the market. Innovations in bio-based and non-toxic emollients allow companies to combine performance with environmental responsibility, supporting growth in a personal care market that is becoming more focused on sustainability.
Emollient Market: COMMERCIAL USE CASES ACROSS INDUSTRIES
| COMPANY | USE CASE DESCRIPTION | BENEFITS |
|---|---|---|
 |
Advanced skin creams and serums formulated with emollients for hydration and smooth texture | Enhanced skin softness, improved product sensory appeal, better consumer satisfaction, and premium positioning |
 |
Hair conditioners and shampoos enriched with emollients for scalp nourishment and shine | Improved hair manageability, reduced frizz, long-lasting softness, and higher brand loyalty in mass markets |
 |
Daily-use body lotions and moisturizers integrating emollients for fast absorption | Non-greasy feel, effective hydration, better skin barrier function, and strong customer trust in skincare |
 |
Deodorants and antiperspirants with emollients to provide smooth application and skin comfort | Reduced skin irritation, improved glide, long-lasting freshness, and stronger consumer retention |
Logos and trademarks shown above are the property of their respective owners. Their use here is for informational and illustrative purposes only.
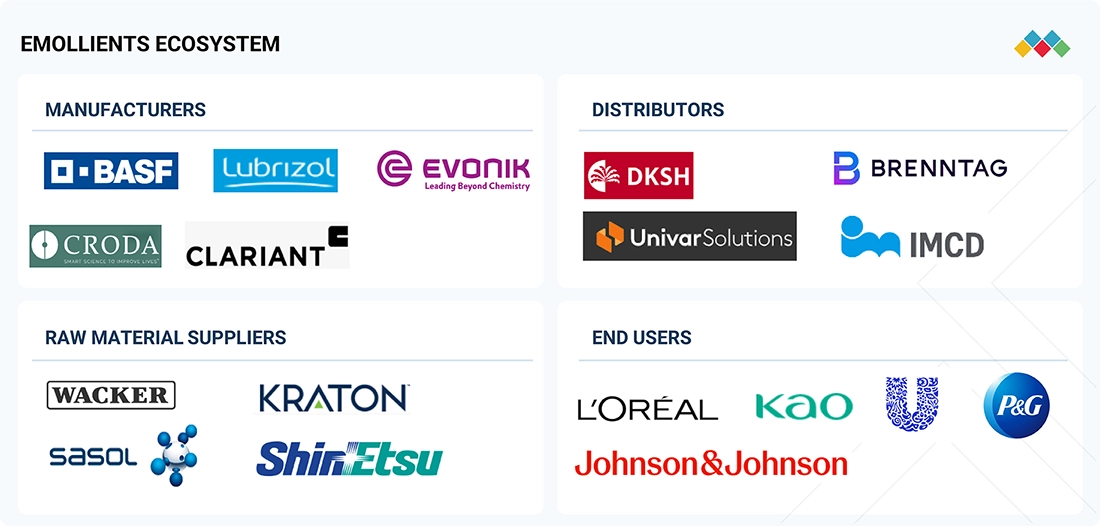
MARKET ECOSYSTEM
The emollients ecosystem involves identifying and analyzing interconnected relationships among various stakeholders, including raw material suppliers, emollient manufacturers, distributors, cosmetic formulators, and end users. Raw material suppliers provide essential inputs such as plant oils, esters, and synthetic intermediates to emollient producers. These manufacturers process the materials into functional emollients for personal care products. Distributors and suppliers connect emollient makers with cosmetic and personal care brands, streamlining the supply chain, enhancing operational efficiency, and ensuring the timely delivery of high-quality emollients for end-use applications.
Logos and trademarks shown above are the property of their respective owners. Their use here is for informational and illustrative purposes only.
MARKET SEGMENTS
Source: Secondary Research, Interviews with Experts, MarketsandMarkets Analysis
Emollients Market, By Type
The esters segment held the largest market share in 2024. Esters are highly versatile and compatible with a wide range of personal care formulations, including creams, lotions, and serums. They offer a light, non-greasy feel and excellent spreadability, making them the preferred choice for manufacturers targeting both mass-market and premium skincare products. Their performance, sensory appeal, and ease of integration into formulations position esters as the leading type driving growth in the emollients market.
Emollients Market, By Form
The liquid emollients segment led the market in 2024. Liquid forms are easy to mix into creams, lotions, and serums, providing smooth application, quick absorption, and formulation flexibility. Unlike solid or semi-solid types, liquids offer consistent texture and stability, making them ideal for daily skincare products. Their versatility across different formulations and compatibility with bio-based or multifunctional ingredients have made liquid emollients the most popular choice in personal care.
Emollients Market, By Application
The skincare segment accounted for the largest share in 2024. Emollients are essential in moisturizers, anti-aging creams, and sunscreens, offering hydration, softness, and enhanced skin barrier function. Increasing consumer interest in skin wellness and premium personal care products drives adoption. Skincare brands utilize emollients to improve product performance, sensory feel, and overall consumer experience, making this application the main driver of market growth across both mass-market and high-end segments.
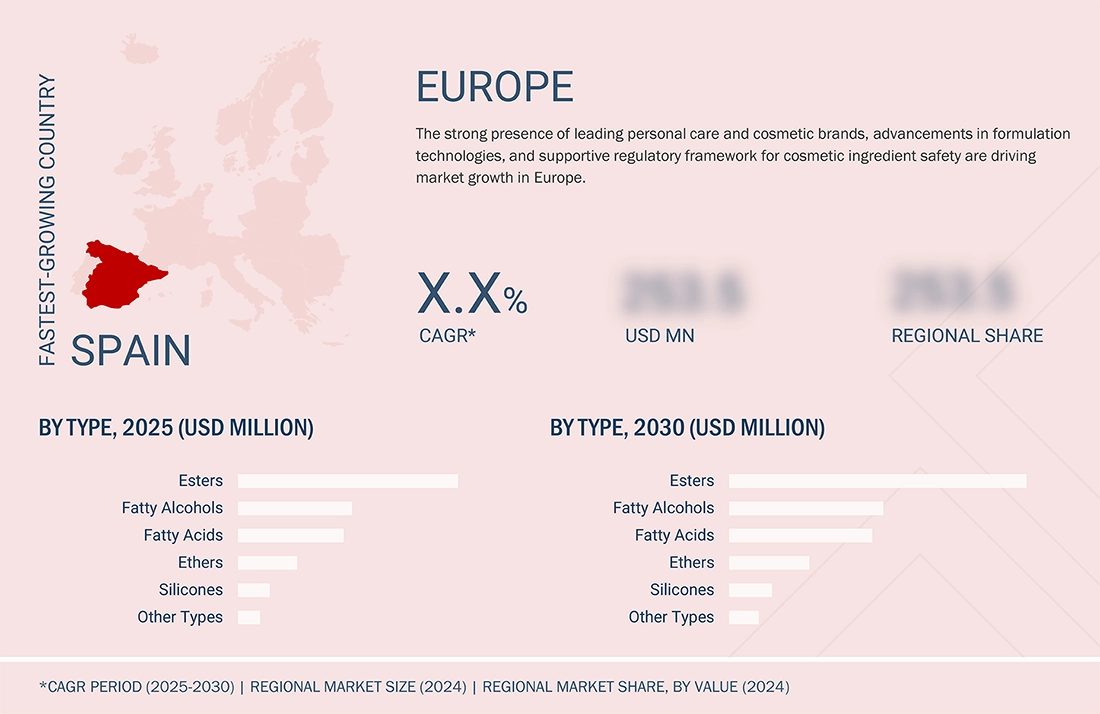
REGION
Europe held largest share in global emollients market in 2024
Europe held the largest market share in 2024. Its well-established personal care and cosmetics industries, along with strong regulatory frameworks and consumer demand for high-quality, sustainable ingredients, boost demand. European manufacturers are investing in bio-based and multifunctional emollients to meet regulatory standards and changing consumer expectations. These factors make Europe a center for advanced product development and adoption, maintaining its leadership in the global emollients market.
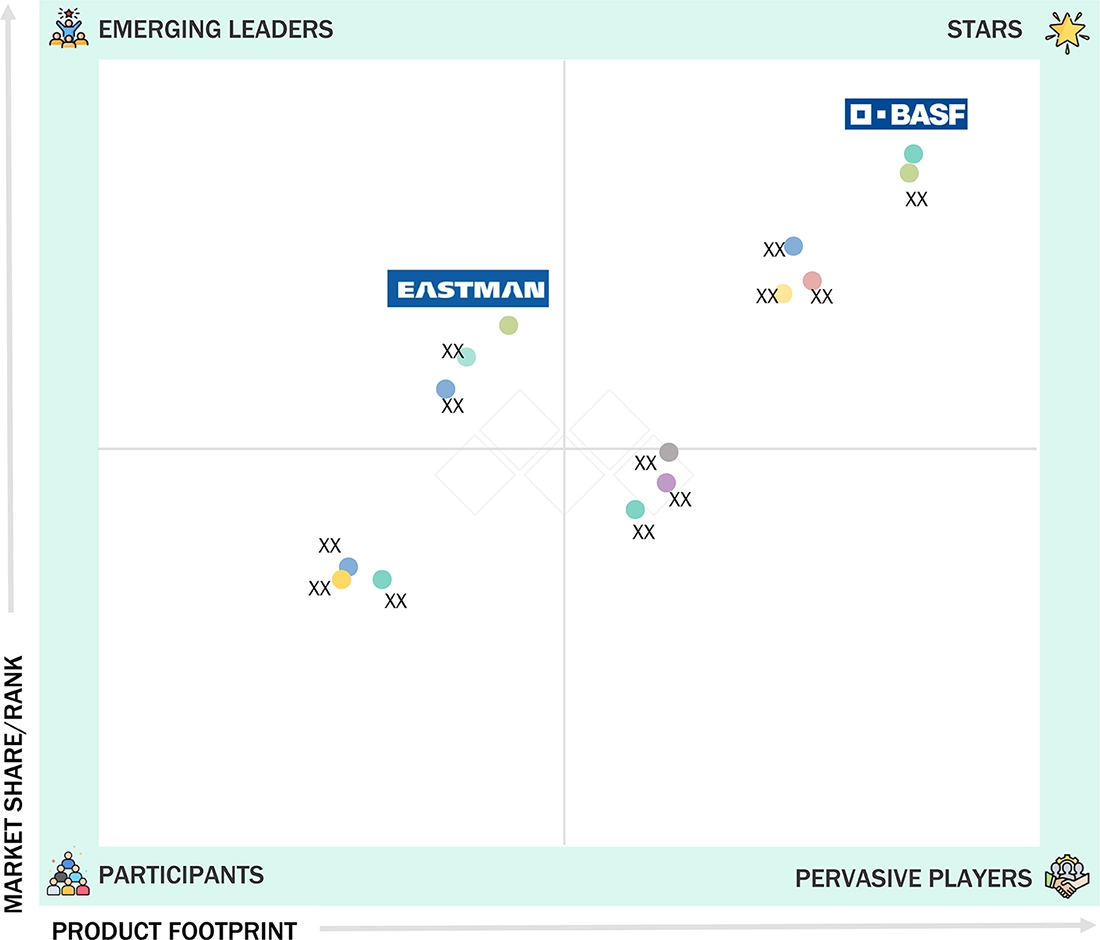
Emollient Market: COMPANY EVALUATION MATRIX
In the emollients market landscape, BASF SE leads with a strong global reach and a diverse portfolio of high-performance, sustainable emollients, promoting widespread use across applications like skincare, hair care, and deodorants. The company’s focus on bio-based, multifunctional, and regulation-compliant ingredients reinforces its position. With its scale, innovation abilities, and partnerships with major personal care brands, BASF SE continues to dominate the market and set standards in product performance and sustainability.
Source: Secondary Research, Interviews with Experts, MarketsandMarkets Analysis
KEY MARKET PLAYERS
MARKET SCOPE
| REPORT METRIC | DETAILS |
|---|---|
| Market Size Value in 2024 | USD 3.03 Billion |
| Revenue Forecast in 2030 | USD 4.08 Billion |
| Growth Rate | CAGR of 5.15% from 2025-2030 |
| Year Considered | 2020-2030 |
| Base Year | 2024 |
| Forecast Period | 2025-2030 |
| Units Considered | Value (USD Million) |
| Report Coverage | Revenue forecast, company ranking, competitive landscape, growth factors, and trends |
| Segments Covered |
|
| Regional Scope | Europe, Asia Pacific, North America, Middle East & Africa, South America |
WHAT IS IN IT FOR YOU: Emollient Market REPORT CONTENT GUIDE
DELIVERED CUSTOMIZATIONS
We have successfully delivered the following deep-dive customizations:
| CLIENT REQUEST | CUSTOMIZATION DELIVERED | VALUE ADDS |
|---|---|---|
| Europe-based Emollients Manufacturer |
|
|
| Asia Pacific-based Emollients Manufacturer |
|
|
RECENT DEVELOPMENTS
- March 2025 : BASF SE launched a new generation renewable lipid functional emollient with improved sustainability profile and enhanced sensorial properties.
- September 2024 : Eastman Chemical Company invested in new manufacturing facility to support growing demand for specialty emollients in Asia.
- May 2024 : Evonik Industries AG expanded its distribution agreement for Evonik's personal care ingredients, including emollients, in the Asia Pacific region.
- January 2024 : Croda International Plc made a partnership with Aqia to expand distribution of Croda's emollient portfolio in Latin American markets.
- June 2023 : Lubrizol Corporation launched a naturally derived emollient with enhanced stability in formulations for premium skin care.
Table of Contents
 Exclusive indicates content/data unique to MarketsandMarkets and not available with any competitors.
Methodology
The study involved four major activities in estimating the size of the emollient market. Exhaustive secondary research was done to collect information on the market, the peer market, and the parent market. The next step was to validate these findings, assumptions, and sizing with industry experts across the value chain through primary research. Both top-down and bottom-up approaches were employed to estimate the complete market size. After that, the market breakdown and data triangulation procedures were used to estimate the market size of the segments and subsegments.
Secondary Research
Secondary sources used in this study included annual reports, press releases, and investor presentations of companies; white papers; certified publications; articles from recognized authors; and gold standard & silver standard websites such as Factiva, ICIS, Bloomberg, and others. The findings of this study were verified through primary research by conducting extensive interviews with key officials such as CEOs, VPs, directors, and other executives. The breakdown of the profiles of the primary interviewees is illustrated in the figure below.
Primary Research
The emollient market comprises several stakeholders, such as raw material suppliers, end-product manufacturers, and regulatory organizations in the supply chain. The demand side of this market is characterized by key opinion leaders in various applications for the emollient market. The supply side is characterized by advancements in technology and diverse application industries. Various primary sources from both the supply and demand sides of the market were interviewed to obtain qualitative and quantitative information.
Breakdown of Primary Participants

Note: Tier 1, Tier 2, and Tier 3 companies are classified based on their market revenue in 2023/2024, available in the public domain, product portfolios, and geographical presence.
Other designations include consultants and sales, marketing, and procurement managers.
To know about the assumptions considered for the study, download the pdf brochure
| COMPANY NAME | DESIGNATION | |
|---|---|---|
| BASF SE | Senior Manager | |
| Croda International plc | Innovation Manager | |
| Evonik Industries AG | Vice President | |
| Lubrizol Corporation | Production Supervisor | |
| Clariant AG | Sales Manager | |
Market Size Estimation
Both top-down and bottom-up approaches were used to estimate and validate the total size of the emollient market. These methods were also used extensively to estimate the size of various subsegments in the market. The research methodology used to estimate the market size includes the following:
- The key players in the industry have been identified through extensive secondary research.
- The supply chain of the industry has been determined through primary and secondary research.
- All percentage shares, splits, and breakdowns have been determined using secondary sources and verified through primary sources.
- All possible parameters that affect the markets covered in this research study have been accounted for, viewed in extensive detail, verified through primary research, and analyzed to obtain the final quantitative and qualitative data.

Data Triangulation
After arriving at the overall market size—using the market size estimation processes as explained above—the market was split into several segments and subsegments. To complete the overall market engineering process and arrive at the exact statistics of each market segment and subsegment, data triangulation and market breakdown procedures were employed, wherever applicable. The data was triangulated by studying various factors and trends from both the demand and supply sides in the emollient industry.
Market Definition
Emollients are one of the largest categories of highly functional specialty ingredients effectively used in cosmetic and personal care formulations to impart soft, smooth, hydrated skin. Emollients work by forming an oily water-repellent layer on the skin’s surface, helping to seal up moisture close to the skin’s surface, improving the skin’s texture and appearance. Emollients are a key ingredient in numerous specialty chemicals used in thousands of skincare, hair care, and personal care products, from pharmaceuticals to consumer-produced goods, in industries ranging from beauty, fashion, and entertainment.
Stakeholders
- Emollient Manufacturers
- Emollient Distributors
- Raw Material Suppliers
- Service Providers
- Government and Research Organizations
Report Objectives
- To define, describe, and forecast the market size for emollients in terms of value
- To provide detailed information about drivers, restraints, opportunities, and challenges influencing the market growth
- To analyze and forecast the emollient market by type, form, and application
- To forecast the market based on key regions, namely, North America, Europe, Asia Pacific, the Middle East & Africa, and South America
- To strategically analyze the micromarkets with respect to individual growth trends, prospects, and their contribution to the overall market
- To track and analyze recent developments, such as product launches, deals, expansions, and other developments, in the market
- To analyze the opportunities for stakeholders in the market and provide a competitive landscape for market leaders
- To strategically profile the key players and comprehensively analyze their market shares and core competencies
Key Questions Addressed by the Report
Who are the key competitive players in the emollient industry?
BASF SE (Germany), Croda International plc (UK), Evonik Industries AG (Germany), Lubrizol Corporation (US), Clariant AG (Switzerland), Eastman Chemical Company (US), Ashland Inc. (US), Innospec Inc. (US), Lonza Group (Switzerland), and Stepan Company (US).
What are the key drivers and opportunities for the emollient market?
Key drivers include growing consumer focus on skincare, rising demand for natural and sustainable ingredients, and growth in premium personal care products. Opportunities lie in expanding into emerging markets and offering advanced functional benefits.
How big is the current emollient market and what is its growth forecast?
The emollient market is projected to grow from USD 3.03 billion in 2024 to USD 4.08 billion by 2030, at a CAGR of 5.15%.
Which strategies are the key players focusing upon in the emollient market?
Companies are adopting strategies such as product launches, partnerships, collaborations, joint ventures, acquisitions, agreements, and expansions to strengthen their market presence.
What is the future outlook for the emollient market?
The emollient market is projected to grow at a CAGR of 5.15% from 2025 to 2030.
What are the major emollient market challenges?
Volatility in raw material prices and challenges related to regulatory compliance and complexity are expected to hinder market growth.
Need a Tailored Report?
Customize this report to your needs
Get 10% FREE Customization
Customize This ReportPersonalize This Research
- Triangulate with your Own Data
- Get Data as per your Format and Definition
- Gain a Deeper Dive on a Specific Application, Geography, Customer or Competitor
- Any level of Personalization
Let Us Help You
- What are the Known and Unknown Adjacencies Impacting the Emollient Market
- What will your New Revenue Sources be?
- Who will be your Top Customer; what will make them switch?
- Defend your Market Share or Win Competitors
- Get a Scorecard for Target Partners

Custom Market Research Services
We Will Customise The Research For You, In Case The Report Listed Above Does Not Meet With Your Requirements
Get 10% Free CustomisationTESTIMONIALS

We at Nissan Chemicals Corporation have been clients of MarketsandMarkets for more than a year now. We recently consulted MarketsandMarkets for a study, the team at MarketsandMarkets was extremely professional and organized. The business insights were very detailed and aligned well with our expectations that really helped us formulate the Business Plans and device new strategies for development themes. MarketsandMarkets offers a unique combination of expertise and dedicated engagement model. Their research findings have helped us in designing our Pricing Strategy which will make it easier for us to predict the future sales and profits for the next ten years. We look forward to working with MarketsandMarkets in the future.
VP of Strategy & New Business Development
Leading Specialty Chemical Company
The MarketsandMarkets Engagement Model, composed of both the Knowledge Store and advisory custom research, has greatly helped us in understanding our markets and making strategic decisions. The Knowledge Store is a fast way to allow everyone in our organization to understand more about most any market they are interested in. The ability to then get custom research done and get answers to specific strategic questions and market insight has been spectacular. The Markets and Markets team feel more like colleagues than vendors and their services have helped us change our culture where statements of things like growth opportunities and competitive position are always backed by industry research.

Rich Gibson,
Director, Corporate Strategy
Milliken & Company,
Leading Industrial Manufacturer of specialty chemical, floor covering, performance and protective textile materials, and healthcaremilliken.com
MarketsandMarkets is a trusted resource that helps us to better understand markets that are near-adjacencies-whether its technology, value chain or geography. Their Knowledge Store platform provides a dashboard of markets and their characteristics which is easy to use and saves us time.
Adam Shaw,
Market Development and Strategy Manager
AdvanSix Inc. USA,
An American Leader in Chemicalswww.advansix.com
The Knowledge Store from MarketsandMarkets is a valuable tool which has helped my team acquire greater insight in to the end markets that our business serves. This has enabled us to help our company build stronger strategies throughout our planning process.
TOSHIO KINOSHITA
Senior Chif Consultion Research & Consulting Division
Mitsubishi Chemical Research Corporation,
Leading Manufacturer of Chemical Productswww.mitsubishichem-res.co.jp/en/

We recently engaged with MarketsandMarkets for a study, the team not only clearly understood our business objectives but was also extremely professional in the way they handled the entire project. The study was efficiently conducted in a phase-wise manner, and the engagement model furnished us with high-quality business insights that far exceeded our expectations at each phase. We were especially happy that MarketsandMarkets could provide us with both, an English as well as a Japanese version of the study. A special thanks to the Analyst Team and Client Services Team, whose fluency in Japanese enhanced our comfort level, as we could converse with them in our preferred language.
Independent entrepreneurs
Arrow Precision
We approached MarketsandMarkets for study on Proppants Market, and their work exceeded our expectations. The study conducted was comprehensive and enabled us to view the market through the various dimensions. In addition, the team was extraordinarily responsive throughout the process and resolved our queries on time. I strongly recommend MarketsandMarkets and will certainly consider them for additional market assessments we will need in the future.
Global engineering company, Japan
Deputy Manager,
Strategic Planning OfficeThe high-quality insights shared by the MarketsandMarkets team helped us understand the pharmaceutical plant designers in a specific geography. It also captured the risks that we may likely face in communicating with our potential partners. The study would enable us identify partners, which would impact our future growth.


Growth opportunities and latent adjacency in Emollient Market