This study encompassed significant efforts in determining the present size of the energy management systems market. It commenced with a thorough secondary research process to gather data related to the market, similar markets, and the overarching industry. Subsequently, these findings, assumptions, and market size calculations were rigorously validated by consulting industry experts across the entire supply chain through primary research. The total market size was assessed by conducting an analysis specific to each country. Following that, the market was further dissected, and the data was cross-referenced to estimate the size of various segments and sub-segments within the market.
Secondary Research
In this research study, a wide range of secondary sources were utilized, including directories, databases, and reputable references such as Hoover's, Bloomberg BusinessWeek, Factiva, World Bank, International Monetary Fund (IMF), the US Department of Energy (DOE), and the International Energy Agency (IEA). These sources played a crucial role in gathering valuable data for a comprehensive analysis of the global energy management system market, covering technical, market-oriented, and commercial aspects. Additional secondary sources included annual reports, press releases, investor presentations, whitepapers, authoritative publications, articles authored by well-respected experts, information from industry associations, trade directories, and various database resources.
Primary Research
The EMS market involves a range of stakeholders, including IT service providers, support infrastructure equipment providers, component providers, software providers, system integrators, network service providers, financial organizations, and energy efficiency consultants within the supply chain. To gather qualitative and quantitative insights, various primary sources from both the supply and demand sides of the market were interviewed. The following breakdown presents the primary respondents involved in the research study.

To know about the assumptions considered for the study, download the pdf brochure
Market Size Estimation
The estimation and validation of the global energy management systems market size have been conducted using a bottom-up approach. This approach was rigorously employed to ascertain the dimensions of multiple subsegments within the market. The research process comprises the following key stages.
-
In this method, the statistics for each offering of energy management systems have been examined at both the country and regional levels.
-
Thorough secondary and primary research has been conducted to gain a comprehensive understanding of the global market landscape for various segments of market.
-
When calculating and forecasting the market size, qualitative factors such as market drivers, limitations, opportunities, and challenges have been taken into account.
Global Energy Management Systems Market Size: Bottom-Up Approach

To know about the assumptions considered for the study, Request for Free Sample Report
Data Triangulation
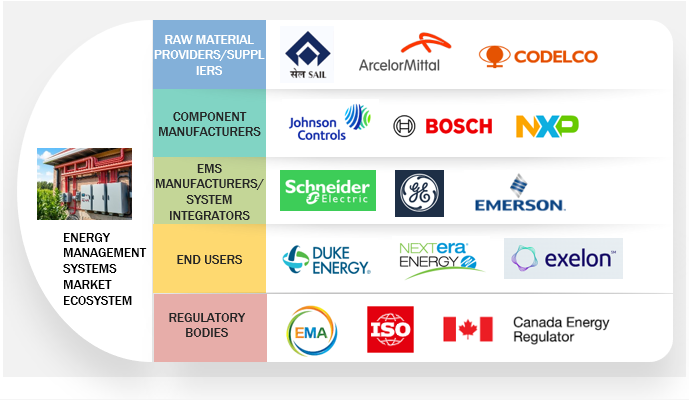
The process of determining the overall market size involved the methodologies described earlier, followed by segmenting the market into multiple segments and subsegments. To finalize the comprehensive market analysis and obtain precise statistics for each market segment and subsegment, data triangulation and market segmentation techniques were applied, as appropriate. Data triangulation was accomplished by examining various factors and trends from both the demand and supply perspectives within the ecosystem of the EMS market.
Market Definition
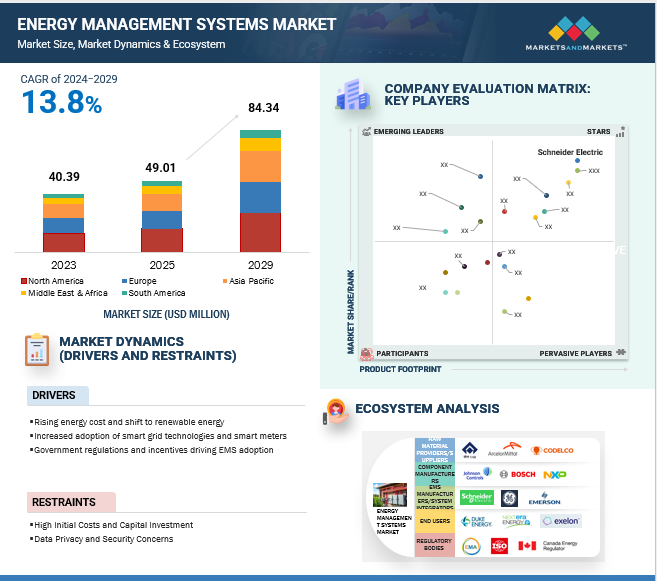
Energy Management Systems (EMS) refer to a set of integrated technologies and solutions designed to monitor, control, and optimize the production, consumption, and distribution of energy in various environments, including residential, commercial, industrial, and utility sectors. EMS encompasses a combination of hardware, software, and services that enable organizations and individuals to manage energy use efficiently, reduce energy costs, improve energy performance, and contribute to environmental sustainability.
Key Stakeholders
-
EMS vendors
-
Energy service providers (private/government)
-
Utility platform and analytics vendors
-
System design and development vendors
-
System integrators/migration service providers
-
Consultants/consultancies/advisory firms
-
Environmental research institutes
-
Private or investor-owned utilities
-
Government & research organizations
-
State and national regulatory authorities
-
Investors/Shareholders
-
Investment banks
Objectives of the Study
-
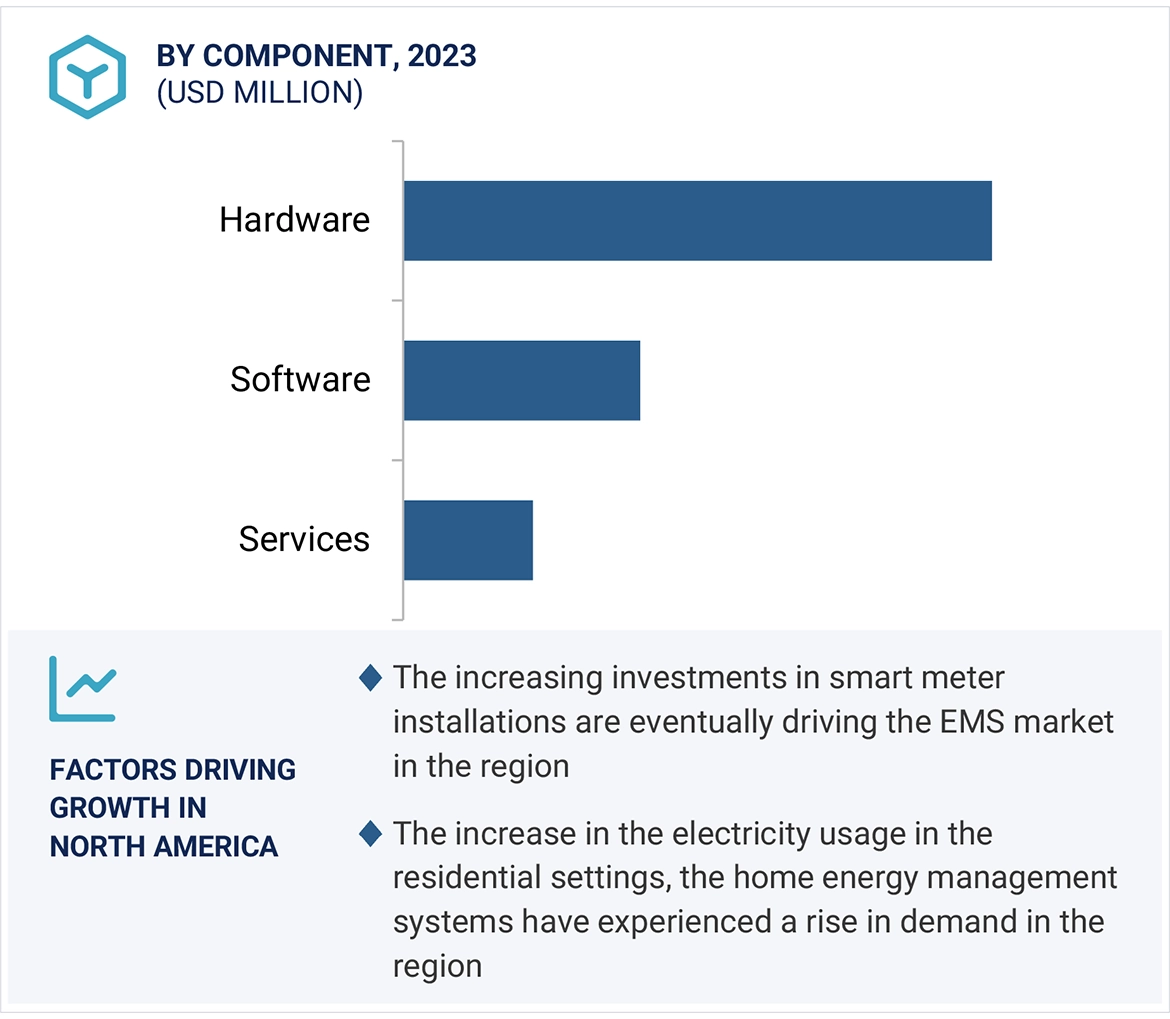
To define, describe, segment, and forecast the energy management systems market, by value, based on component, type, deployment, and end-use industry.
-
To forecast the market size, by value, for five key regions: North America, South America, Europe, Asia Pacific, and the Middle East & Africa, along with their key countries
-
To provide detailed information about the key factors, such as drivers, restraints, opportunities, and challenges influencing the growth of the market
-
To strategically analyze the subsegments concerning individual growth trends, prospects, and contributions of each segment to the overall market size
-
To analyze market opportunities for stakeholders and details of the competitive landscape for market leaders
-
To strategically profile the key players and comprehensively analyze their market shares and core competencies.
-
To track and analyze competitive developments, such as product launches, mergers, acquisitions, expansions, and supply contracts in the market.
Available Customization
With the given market data, MarketsandMarkets offers customizations based on the company’s specific needs. The following customization options are available for the report:
PRODUCT ANALYSIS
-
Product Matrix, which provides a detailed comparison of the product portfolio of each company
COMPANY INFORMATION
-
Detailed analyses and profiling of additional market players (up to 5)


Myra
Jun, 2022
How emerging markets offering revenue expansion opportunities in Energy Management Systems Market?.
Robin
Jun, 2022
Which end user industry is expected to hold major share of the global Energy Management Systems Market for 2022 to 2027?.
Alina
Jul, 2022
During the global Energy Management System (EMS) Market study, we did a separate exercise of deriving revenues for each major vendors for the specific segment and for the specific geographies, for example, IBM�s revenue for big data analytics, energy & utility industry, and UK/Europe/EMEA region. This exercise was done for all public companies and few private companies (which helped us with the specific information). This helped us to derive a portion of the overall market and the overall market was derived based on other data points collected using secondary and primary research..
Alina
Jul, 2022
MnM analyzed analytics vendors� offerings for Energy Management System (EMS) industry verticals in the energy and utility space. MnM have collected various data points related to the company information from company websites, annual reports, investor presentations, press releases, and news publications. We also have an access to various paid databases including Factiva, OneSource, Hoovers, and Bloomberg, from where we have also collected few relevant data points for each analytics vendor. This helps us understand the revenue breakdown by business segments and geographies.We have collected various data points for the entire industry ecosystem and analyzed various parameters including economic condition, regulations, industry use cases, etc. to understand the adoption trend for this market. Apart from some industry related articles, we have also referred to some government publications and industry journals for collecting data points. After collecting data points for both sides, the industry trend was estimated based on various parameters including IT spending (for some cases, Big Data spending) government regulations, M&A initiatives, recent developments pertaining to the market, R&D expenses, start-up ecosystem/funding, and technology maturity. After analyzing each of these factors, we have applied our statistical market engineering model on these factors to estimate the market size and forecast them. We have also verified our assumptions and estimated through primary research..