The study involved four major activities in estimating the current size of the energy recovery ventilator core market—exhaustive secondary research collected information on the market, peer markets, and parent markets. The next step was to validate these findings, assumptions, and sizing with the industry experts across the energy recovery ventilator core value chain through primary research. Both top-down and bottom-up approaches were employed to estimate the complete market size. After that, market breakdown and data triangulation were used to estimate the market size of segments and subsegments.
Secondary Research
Secondary sources for this study include annual reports, press releases, and investor presentations of companies; white papers; certified publications; and articles by recognized authors; gold- and silver-standard websites; energy recovery ventilator core manufacturing companies, regulatory bodies, trade directories, and databases. The secondary research was mainly used to obtain critical information about the industry’s supply chain, the pool of key players, market classification, and segmentation according to industry trends to the bottom-most level and regional markets. It has also been used to obtain information about key developments from a market-oriented perspective.
Primary Research
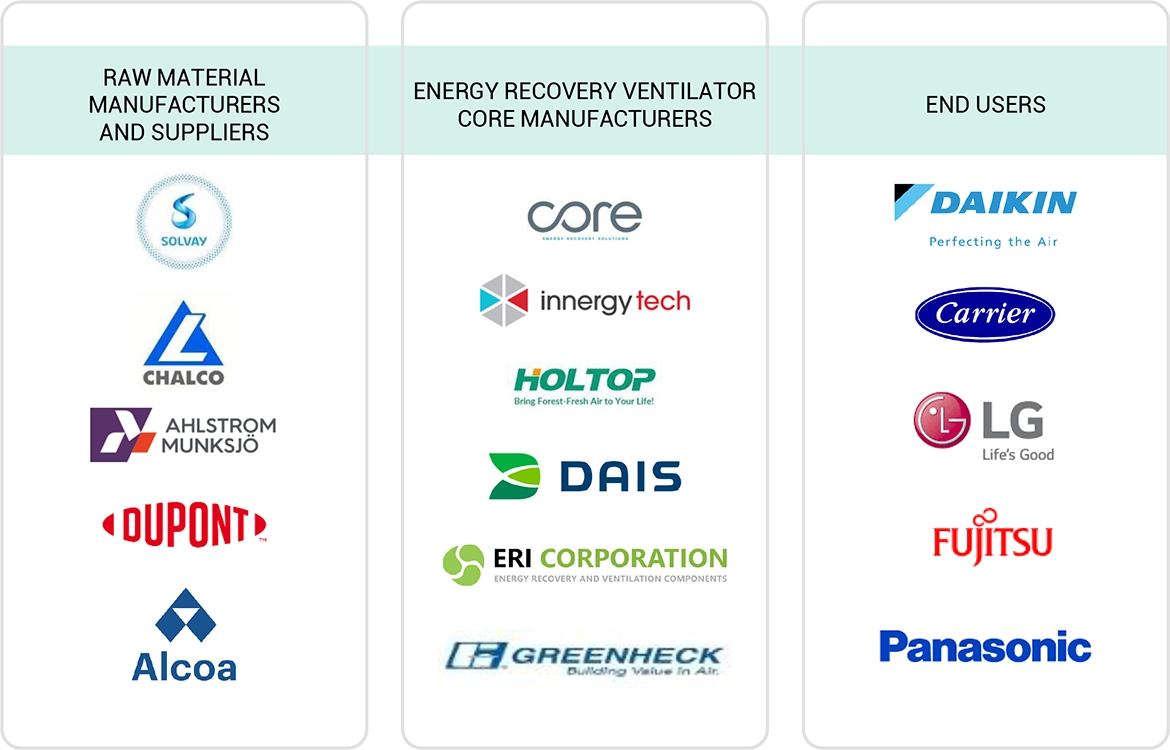
The energy recovery ventilator core market comprises several stakeholders, such as raw material manufacturers and suppliers, manufacturers, traders, distributors, suppliers, contract manufacturing organizations, institutions, and regulatory organizations in the supply chain.
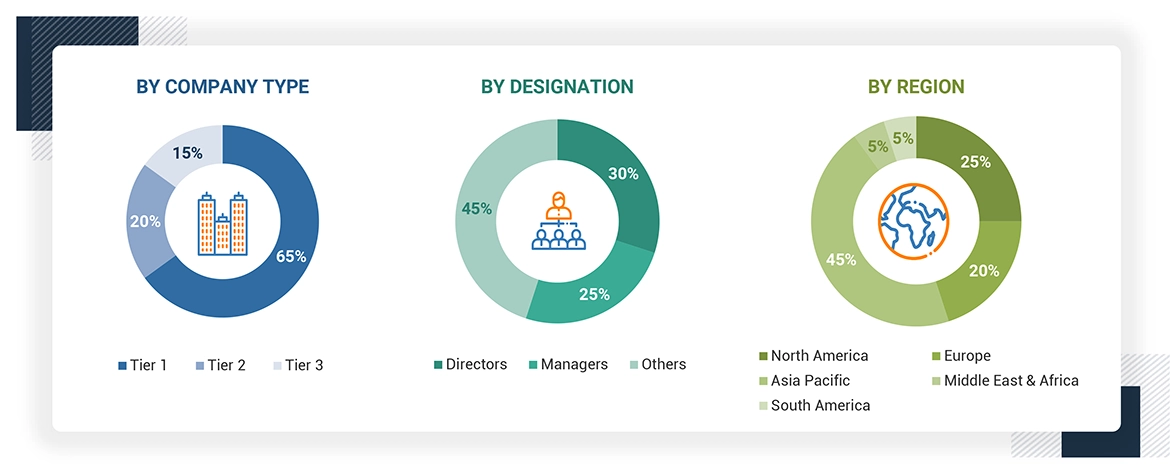
As part of the primary research process, various primary sources from both the supply and demand sides were interviewed to obtain qualitative and quantitative information for this report on the energy recovery ventilator core market. Primary sources from the supply side included industry experts such as Chief Executive Officers (CEOs), vice presidents, marketing directors, and related key executives from various companies and organizations operating in the energy recovery ventilator core market. Primary sources from the demand side included directors, marketing heads, and purchase managers from multiple end-use industries.
Breakdown of the Primary Interviews
To know about the assumptions considered for the study, download the pdf brochure
Market Size Estimation
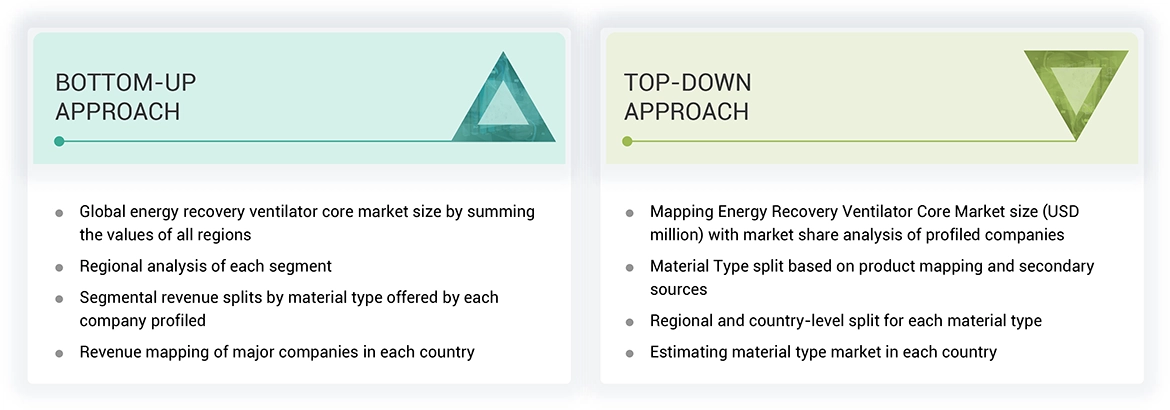
The top-down and bottom-up approaches have been used to estimate and validate the total size of the energy recovery ventilator core market. These approaches have also been used extensively to estimate the size of various dependent market subsegments. The research methodology used to estimate the market size included the following:
-
The following segments provide details about the overall market size estimation process employed in this study
-
The key players in the market were identified through secondary research.
-
The market shares in the respective regions were identified through primary and secondary research.
-
The value chain and market size of the energy recovery ventilator core market, in terms of value, were determined through primary and secondary research.
-
All percentage shares, splits, and breakdowns were determined using secondary sources and verified through primary sources.
-
All possible parameters that affect the market covered in this research study were accounted for, viewed in extensive detail, verified through primary research, and analyzed to obtain the final quantitative and qualitative data.
-
The research included studying the annual and financial reports of the top market players and interviewing industry experts, such as CEOs, VPs, directors, sales managers, and marketing executives, for key insights, both quantitative and qualitative.
Data Triangulation
After arriving at the overall market size, using the market size estimation processes explained above, the market was split into several segments and subsegments. Data triangulation and market breakdown procedures were employed to complete the overall market engineering process and arrive at the exact statistics of each market segment and subsegment. The data was triangulated by studying various factors and trends from both the demand and supply sides. In addition to this, the market size was validated using both top-down and bottom-up approaches.
Report Objectives
-
To define, describe, and forecast the energy recovery ventilator core market size based on material type, shape, flow type, and region.
-
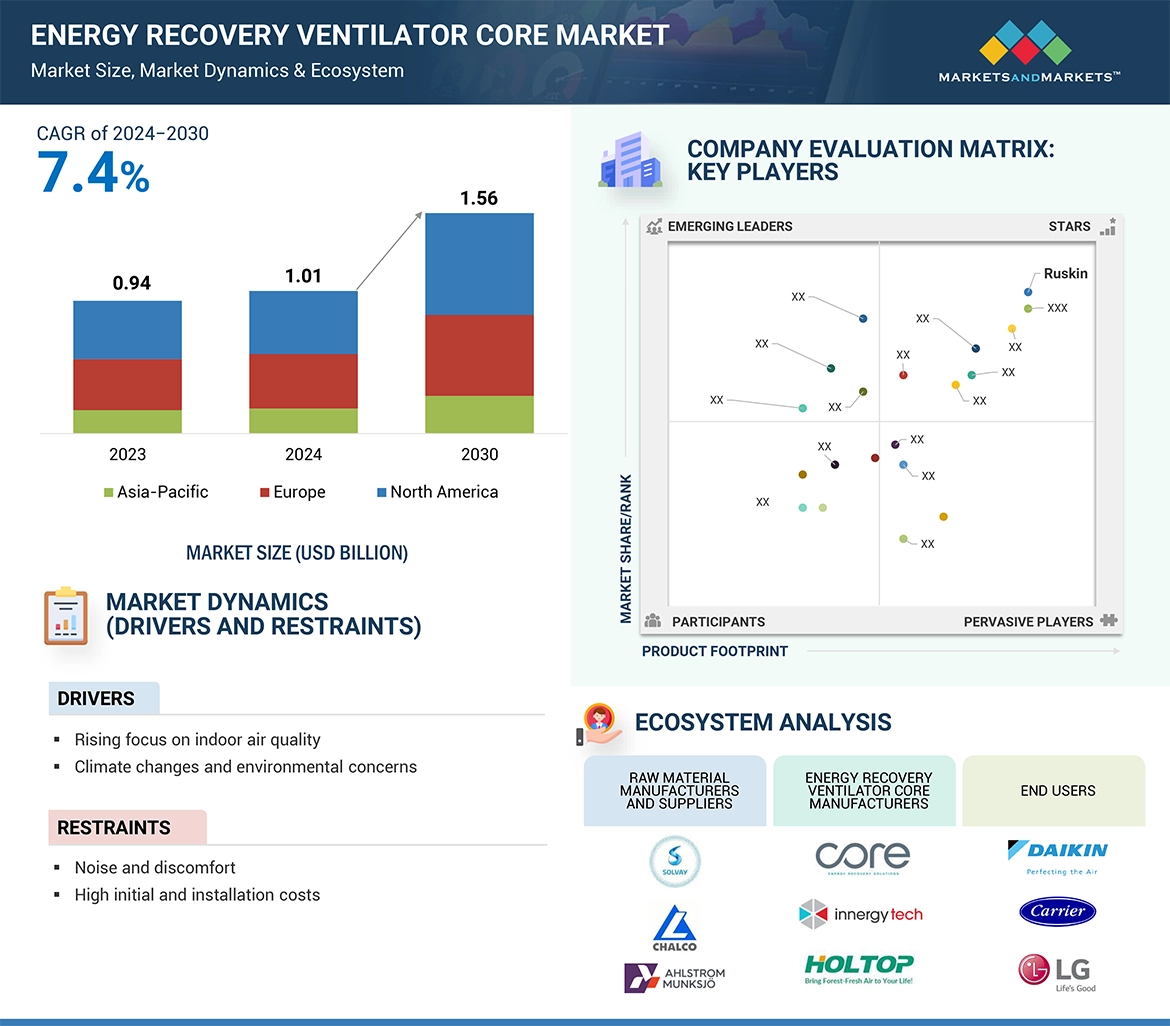
To provide detailed information regarding the major factors (drivers, restraints, opportunities, and challenges) influencing market growth.
-
To forecast the size of the various segments of the energy recovery ventilator core market based on five regions—North America, Asia Pacific, Europe, South America, and the Middle East & Africa—along with key countries in each region.
-
To analyze the opportunities in the market for stakeholders and present a competitive landscape for the market leaders.
-
To analyze recent developments, such as expansions, agreements, new product developments, partnerships, acquisitions, and collaboration in the energy recovery ventilator core market.
-
To strategically profile the key players in the market and comprehensively analyze their core competencies.


 HIGHEST CAGR MARKET IN 2024-2030
 US FASTEST GROWING MARKET IN THE REGION


Growth opportunities and latent adjacency in Energy Recovery Ventilator Core Market