
Enterprise Imaging IT Market: Growth, Size, Share, and Trends

Enterprise Imaging IT Market by Function (VNA, PACS, Universal Viewer, Analytics), Modality (X-ray, MRI, CT, PET, SPECT, Mammo), Application (Diagnosis, Therapeutic, Theranostic), Therapy (Onco, Cardio, Neuro), End User, Region - Global Forecast to 2030


OVERVIEW
Source: Secondary Research, Interviews with Experts, MarketsandMarkets Analysis
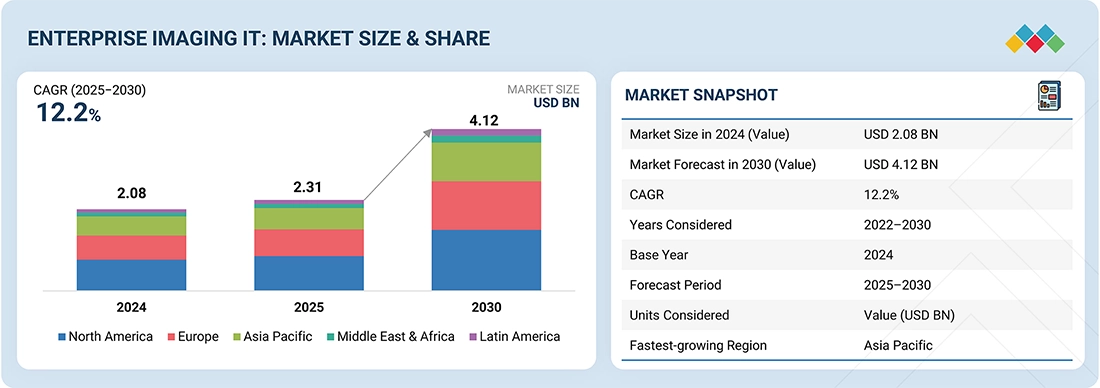
The enterprise imaging IT market size is projected to reach USD 4.12 billion by 2030 from USD 2.31 billion in 2025, at a CAGR of 12.2% during the forecast period. Market growth is fueled by the increasing demand for cross-specialty image access in oncology and cardiology and the integration of advanced visualization tools such as 3D and cinematic rendering into enterprise viewers.
KEY TAKEAWAYS
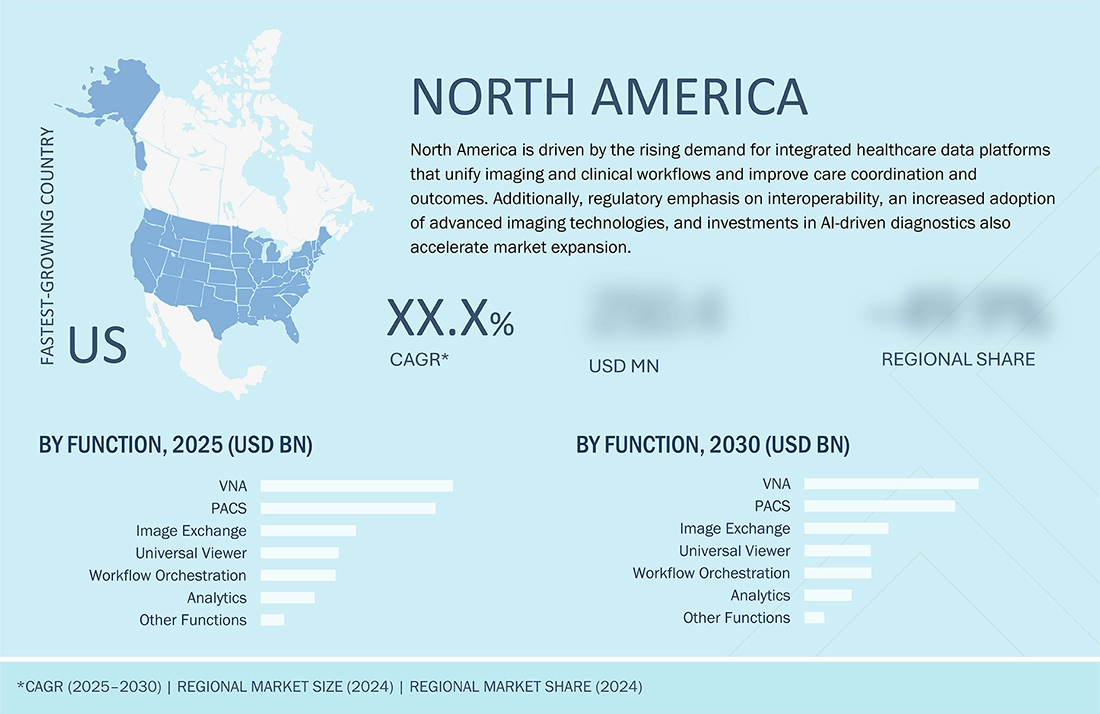
- The North America enterprise imaging IT market accounted for a 38.2% revenue share in 2024.
- By Function, the Vendor Neutral Archives segment is expected to register the highest CAGR of 12.9%.
- By Modality, the X-ray segment is expected to dominate the market with 24.3% in 2024.
- By Application, the diagnostics segment is projected to grow at the fastest rate from 2025 to 2030.
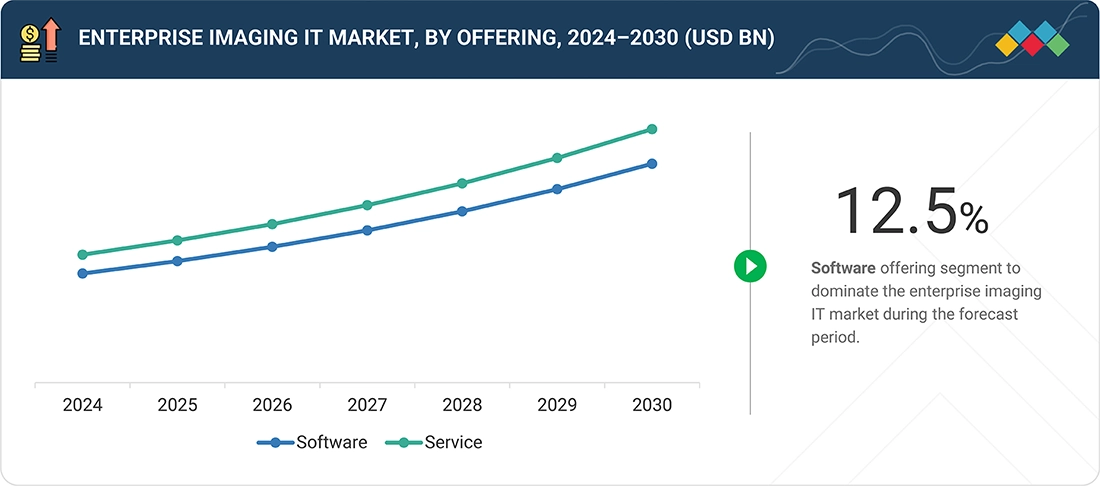
- By Offering, software segment is expected to dominate the market.
- By Deployment Mode, cloud-based solutions segment is expected to register the highest CAGR during the forecast period.
- By Therapeutic Area, cardiology segment is expected to dominate the market.
- By end user, the diagnostic centers segment is expected to register the highest CAGR.
- Agfa-Gevaert Group, FUJIFILM Corporation, GE HealthCare, Sectra AB, CANON MEDICAL SYSTEMS CORPORATION, Koninklijke Philips N.V., and Siemens Healthineers AG were identified as some of the star players in the IoT medical devices market, given their strong market share and product footprint.
- Dicom Systems, Inc., PostDICOM, Qaelum, AdvaHealth Solutions, PaxeraHealth, among others, have distinguished themselves among startups and SMEs by securing strong footholds in specialized niche areas, underscoring their potential as emerging market leaders
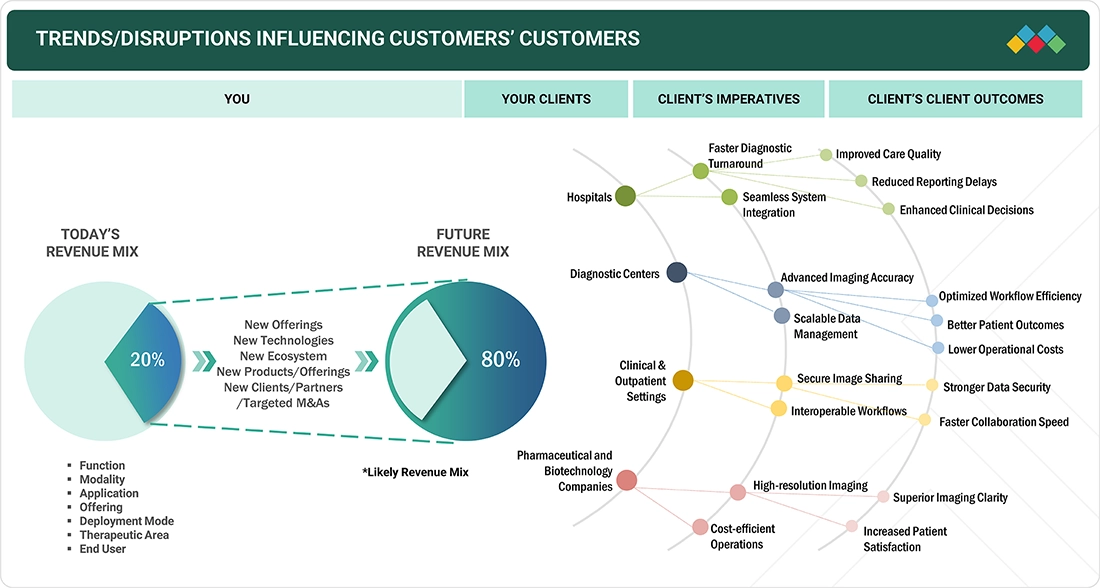
TRENDS & DISRUPTIONS IMPACTING CUSTOMERS' CUSTOMERS
In the enterprise imaging IT market, the impact on consumers’ businesses results from customer trends or disruptions. Hot prospects include healthcare providers and enterprises using imaging IT solutions, while target applications include PACS, VNA, AI-based image analysis, workflow orchestration, and interoperability platforms. Shifts such as AI adoption, cloud migration, regulatory changes, interoperability demands, and value-based care models influence the revenues of end users like hospitals, diagnostic centers, and outpatient clinics. These changes in end-user revenues affect the revenue of hot prospects, ultimately impacting the revenues of enterprise imaging IT vendors such as GE Healthcare, Philips, Sectra, FujiFilm, and Agfa HealthCare.
Source: Secondary Research, Interviews with Experts, MarketsandMarkets Analysis
MARKET DYNAMICS
Level
-
Increased Demand for Scalable and Cost-Effective Solutions.

-
Growing Volume of Medical Imaging Procedures

Level
-
Data Security and Privacy Concerns

-
Lack of skilled professionals for deployment and interpretation

Level
-
Growth of VNA and interoperability in enterprise imaging software

-
Multi-Modality and Advanced Visualization

Level
-
Limited Adoption of Enterprise Imaging Software in Developing Regions

-
High Upfront Integration and Deployment Costs

Source: Secondary Research, Interviews with Experts, MarketsandMarkets Analysis
Driver: Growing Volume of Medical Imaging Procedures
The increasing prevalence of major chronic diseases, including neurological conditions, cardiovascular diseases, and cancer, remains a significant global burden that drives the need for advanced diagnostic imaging procedures. Furthermore, the substantial rise in diagnostic tests using X-rays, CT scans, MRI, PET scans, and ultrasound imaging generates an enormous volume of imaging data. This large amount of data remains difficult to store and retrieve with traditional systems. Therefore, to address these challenges, advanced solutions such as enterprise imaging software are introduced, providing scalable storage, efficient retrieval, and improved image management systems. As imaging procedures become more common in hospitals, diagnostic centers, and ambulatory surgical centers, the demand for enterprise imaging software is expected to grow substantially.
Restraint: Data Security and Privacy Concerns
Data security and privacy are key factors that hinder market growth because sensitive patient records from diverse medical departments are consolidated into a unified system. This process raises the risk of unauthorized access, ransomware attacks, and cyber threats, making healthcare systems attractive targets for hackers. Moreover, cybersecurity threats disrupt patient care, interfere with healthcare operations, and increase operational expenses. Regulatory agencies like the General Data Protection Regulation (GDPR) and the Health Insurance Portability and Accountability Act (HIPAA) enforce strict compliance to safeguard patient records and data. Organizations that fail to comply risk damaging their reputation, losing patient trust, and facing hefty fines.
Opportunity: Growth of VNA and interoperability in enterprise imaging software
The growth of Vendor-Neutral Archives (VNA) and interoperability in enterprise imaging software offers a lucrative opportunity for imaging centers, healthcare providers, and software vendors. The adoption of vendor-neutral, interoperable platforms is rising as healthcare organizations aim to streamline the exchange of imaging data across departments, facilities, and health networks. Traditional picture archiving and communication systems (PACS) are often department-specific and vendor-dependent, making cross-departmental data sharing complex and costly. In contrast, VNAs consolidate imaging data from multiple sources, enabling healthcare providers to store, manage, and access images through a single, centralized repository. This trend is increasing demand for VNA-integrated enterprise imaging software, creating opportunities for market growth and technological innovation.
Challenge: Limited Adoption of Enterprise Imaging Software in Developing Regions
Limited budgets in healthcare, insufficient IT infrastructure, and a shortage of trained staff in developing regions hinder the adoption of enterprise imaging software. High costs of implementation and lack of funding prevent hospitals from investing in modern imaging systems. Many facilities lack reliable internet connectivity, cloud storage, and cybersecurity measures necessary for enterprise imaging. Another obstacle is the shortage of skilled healthcare professionals and IT experts capable of managing and maintaining advanced software systems, which affects adoption and increases reliance on external consultants, raising overall implementation costs.
Enterprise Imaging IT Market: COMMERCIAL USE CASES ACROSS INDUSTRIES
| COMPANY | USE CASE DESCRIPTION | BENEFITS |
|---|---|---|
 |
Deploy Centricity/VNA + Universal Viewer to unify radiology, cardiology and clinical images into a single patient timeline used for tumor boards and perioperative planning. | Single patient timeline; faster MDT decisions; fewer repeat scans. |
 |
Replace multiple PACS with Synapse Enterprise Imaging + Synapse 3D to give radiology and surgical teams one workflow for advanced visualization (oncology, vascular, neuro). | Streamlined pre-op planning; consistent 3D tools across sites; faster clinician adoption. |
 |
Implement Sectra VNA and secure exchange to enable referral networks, second opinions and centralized reading. | Secure sharing; faster referrals; reduced duplicate imaging. |
 |
Consolidate imaging and apply Vitrea analytics (CT/MR quantification) for disease tracking (cardio/oncology) across the enterprise. | Quantified follow-up metrics; consistent measurements; faster clinical decisions. |
 |
IntelliSpace Enterprise Imaging consolidates studies across hospital networks and embeds analytics/quantification into the reading workflow. | Standardized workflows; faster KPI tracking; embedded decision support. |
Logos and trademarks shown above are the property of their respective owners. Their use here is for informational and illustrative purposes only.
MARKET ECOSYSTEM
The enterprise imaging IT market includes organizations that provide integrated imaging informatics solutions and services to healthcare institutions across various deployment models. The market's ecosystem map highlights key components and stakeholders that facilitate the entire imaging process, from image acquisition and storage to analysis, sharing, and archiving. This ecosystem features PACS/VNA vendors, advanced visualization and AI solution providers, cloud-native imaging platform developers, diagnostic viewer and workflow orchestration vendors, interoperability facilitators (such as FHIR and DICOM routing solutions), and infrastructure providers that ensure secure data hosting, automation, and regulatory compliance within enterprise imaging environments.
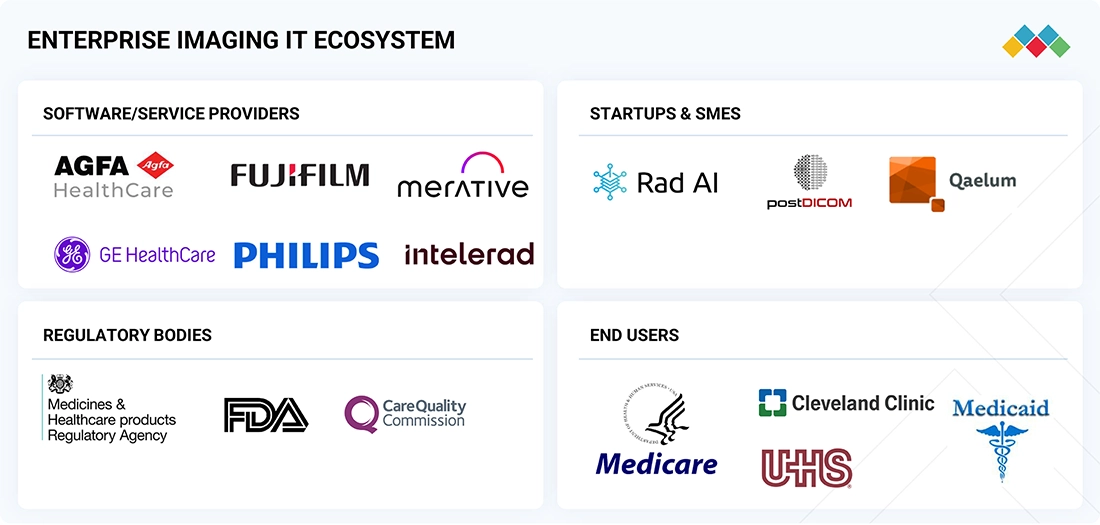
Logos and trademarks shown above are the property of their respective owners. Their use here is for informational and illustrative purposes only.
MARKET SEGMENTS
Source: Secondary Research, Interviews with Experts, MarketsandMarkets Analysis
Enterprise Imaging IT Market, By Function
Based on function, the enterprise imaging IT market is divided into vendor-neutral archive (VNA), picture archiving and communication systems (PACS), image exchange, universal viewer, workflow orchestration, analytics, and others. Among these, the VNA held the largest market share in 2024. This growth is driven by the increasing need to archive and index high-resolution video modalities such as intra-operative endoscopy and 4K surgical feeds within a single, searchable VNA. Hospitals are also requesting blockchain-backed, immutable audit logs for all imaging assets to meet stricter medico-legal and AI training governance standards. Additionally, the shift toward multi-tenant, cloud-native VNAs allows integrated delivery networks to centrally manage archives across numerous regional hospitals without redundant infrastructure.
Enterprise Imaging IT Market, By Offering
The software segment is projected to have the highest CAGR during the forecast period among enterprise imaging IT market offerings, driven by the shift to serverless, event-driven compute models in core imaging software. This enables IT teams to elastically scale processing for high-volume reading spikes without overprovisioning. Vendors are also launching low-code/no-code configuration studios that allow hospitals to quickly customize workflow rules and viewer layouts without expensive professional services. The emergence of certified, app-store-style marketplaces for imaging extensions is creating a lively ecosystem of third-party analytics and visualization modules. Furthermore, the effort to integrate enterprise imaging platforms with robotic surgery and interventional suites through open APIs is opening new peri-operative use cases and encouraging wider software adoption.
Enterprise Imaging IT Market, By End users
Based on end users, the hospitals segment held the largest share of the enterprise imaging IT market in 2024. This growth is driven by hospitals deploying mobile stroke and cardiac care units, which require ultra-low-latency, cloud-connected PACS to transmit CT and echo studies in real time. The rise of hospital-led imaging registries for AI research is also increasing demand for standardized, high-throughput ingestion pipelines and metadata normalization. Additionally, federal cybersecurity grant programs under CISA are encouraging health systems to modernize imaging archives with integrated threat detection and secure remote access.
REGION
North America accounted for the largest share of the enterprise imaging IT market in 2024.
Based on the region, the enterprise imaging IT market is divided into North America, Europe, the Asia Pacific, Latin America, and the Middle East & Africa. North America held the largest share of the enterprise imaging IT market in 2024. This is due to the widespread integration of structured radiology reporting with EHRs, the increasing demand for imaging data analytics in population health initiatives, and the quick expansion of enterprise imaging consolidation across IDNs (Integrated Delivery Networks). The region is also experiencing strong adoption of AI-based quality assurance tools for imaging interpretation and peer review, along with rising federal investments in digital infrastructure modernization, which further support market growth.
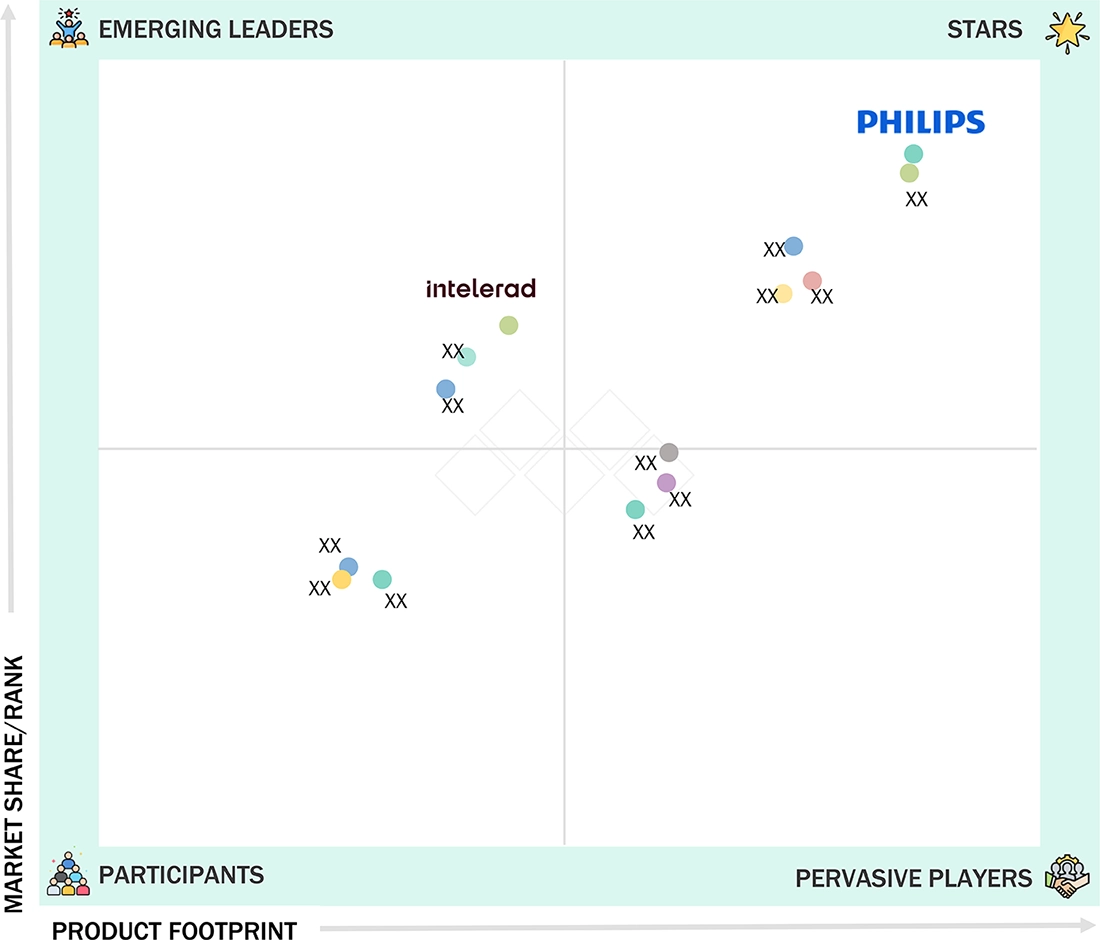
Enterprise Imaging IT Market: COMPANY EVALUATION MATRIX
In the enterprise imaging IT market matrix, Philips (Star) leads with a strong market share and an extensive product footprint, driven by its comprehensive enterprise imaging solutions, advanced AI-powered diagnostic tools, and robust interoperability capabilities that are widely adopted across hospitals and diagnostic networks. Intelerad (Emerging Leader) is gaining visibility with its scalable imaging workflow solutions and cloud-native platforms, strengthening its position through innovation, ease of integration, and targeted offerings for specialty practices and mid-sized healthcare providers. While Philips dominates through scale and a diverse portfolio, Intelerad shows significant potential to move toward the leaders’ quadrant as demand for interoperable, cloud-enabled, and AI-driven imaging solutions continues to grow.
Source: Secondary Research, Interviews with Experts, MarketsandMarkets Analysis
KEY MARKET PLAYERS
- Agfa-Gevaert Group. (Belgium)
- FUJIFILM Corporation (Japan)
- Merative (US)
- Pro Medicus, Ltd. (Australia)
- Optum, Inc. (US)
- GE HealthCare (US)
- Intelerad. Intelerad. (Canada)
- Sectra AB (Sweden)
- CANON MEDICAL SYSTEMS CORPORATION (Japan)
- Hyland Software, Inc. (US)
- Koninklijke Philips N.V. (Netherlands)
- Siemens Healthineers AG (Germany)
- INFINITT Healthcare Co., Ltd. (South Korea)
- Novarad (US)
- Mach7 Technologies (US)
- Hermes Medical Solutions (Sweden)
- Konica Minolta, Inc. (Japan)
- BridgeHead Software Ltd. (England)
- Sclmage, Inc. (US)
- VISUS Health IT GmbH (Germany)
MARKET SCOPE
| REPORT METRIC | DETAILS |
|---|---|
| Market Size in 2024 (Value) | USD 2.08 Billion |
| Market Forecast in 2030 (value) | USD 4.12 Billion |
| Growth Rate | CAGR of 12.2% from 2025-2030 |
| Years Considered | 2022-2030 |
| Base Year | 2024 |
| Forecast Period | 2025-2030 |
| Units Considered | Value (USD Million/Billion) |
| Report Coverage | Revenue forecast, company ranking, competitive landscape, growth factors, and trends. |
| Segments Covered | Function, Modality, Application, Offering, Deployment Mode, Therapeutic Area, End User |
| Regions Covered | North America, Europe, Asia Pacific, Latin America, Middle East & Africa |
WHAT IS IN IT FOR YOU: Enterprise Imaging IT Market REPORT CONTENT GUIDE
DELIVERED CUSTOMIZATIONS
We have successfully delivered the following deep-dive customizations:
| CLIENT REQUEST | CUSTOMIZATION DELIVERED | VALUE ADDS |
|---|---|---|
| Client Request on PACS & VNA Market (Private Player Financials, Pricing & Sales Channel) |
|
|
RECENT DEVELOPMENTS
- June 2025 : GE HealthCare (US) released its first integrated software with MIM Encore, combining advanced GE algorithms with MIM Software to improve digital imaging workflows in oncology, cardiology, and neurology. The solution simplifies PET/SPECT imaging, enhances diagnostic confidence, and automates reporting to increase efficiency and support precise care.
- May 2025 : Merative (US) announced its global expansion of the Merge Imaging Suite, including Merge VNA (Vendor Neutral Archive) and Merge Hemo (Hemodynamic Monitoring Software), into new markets such as Puerto Rico, the UK, Costa Rica, and Canada, enhancing enterprise imaging infrastructure and workflow modernization across healthcare systems worldwide.
- March 2025 : Agfa-Gevaert Group (Belgium) appointed Evolucare (France), part of the GPI Group, as its strategic partner in France to expand the reach of its Enterprise Imaging Platform throughout the region, utilizing Evolucare's extensive healthcare IT and radiology deployment expertise.
Table of Contents
 Exclusive indicates content/data unique to MarketsandMarkets and not available with any competitors.
Methodology
This market research study involved the extensive use of secondary sources, directories, and databases to identify and collect information useful for this technical, market-oriented, and financial study of the enterprise imaging IT market. In-depth interviews were conducted with various primary respondents, including key industry participants, subject-matter experts (SMEs), C-level executives of key market players, and industry consultants, among other experts, to obtain and verify critical qualitative and quantitative information and to assess market prospects. The size of the enterprise imaging IT market was estimated through various secondary research approaches and triangulated with inputs from primary research to arrive at the final market size.
Secondary Research
The secondary research process involved the widespread use of secondary sources, directories, databases (such as Bloomberg Businessweek, Factiva, and D&B Hoovers), white papers, annual reports, company house documents, investor presentations, and SEC filings of companies. Some non-exclusive secondary sources include the World Health Organization (WHO), the Organisation for Economic Co-operation and Development (OECD), Healthcare Information and Management Systems Society (HIMSS), Centers for Disease Control and Prevention (CDC), ClinicalTrials.gov, Expert Interviews, and MarketsandMarkets Analysis.
Secondary research was used to identify and collect information useful for the extensive, technical, market-oriented, and commercial study of the enterprise imaging IT market. It was also used to obtain important information about the key players, market classification, and segmentation according to industry trends to the bottom-most level, and key developments related to market and technology perspectives. A database of the key industry leaders was also prepared using secondary research.
Primary Research
In the primary research process, various sources from both the supply and demand sides were interviewed to obtain qualitative and quantitative information for this report. Primary sources are mainly industry experts from the core and related industries and preferred suppliers, manufacturers, distributors, technology developers, researchers, and organizations related to all segments of this industry’s value chain. In-depth interviews were conducted with various primary respondents, including key industry participants, subject-matter experts (SMEs), C-level executives of key market players, and industry consultants, among other experts, to obtain and verify the critical qualitative and quantitative information as well as assess prospects.
Primary research was conducted to identify segmentation types, industry trends, key players, and key market dynamics such as drivers, restraints, opportunities, challenges, industry trends, and strategies adopted by key players.
After completing the market engineering process, which includes calculations for market statistics, market breakdown, size estimations, forecasting, and data triangulation, extensive primary research was conducted. This research aimed to gather information and verify the critical numbers obtained during the market analysis. Additionally, primary research was conducted to identify different types of market segmentation, analyze industry trends, evaluate the competitive landscape of enterprise imaging IT solutions offered by various players, and understand key market dynamics such as drivers, restraints, opportunities, challenges, industry trends, and strategies employed by key market participants.
In the complete market engineering process, the top-down and bottom-up approaches and several data triangulation methods were extensively used to perform the market estimation and market forecasting for the overall market segments and subsegments listed in this report. Extensive qualitative and quantitative analysis was performed on the complete market engineering process to list the key information/insights throughout the report.
Breakdown of Primary Interviews

Note 1: Others include sales, marketing, and product managers.
Note 2: Tiers are defined based on a company’s total revenue. As of 2024: Tier 1 = >USD 1 billion, Tier 2 = USD 500 million to USD 1 billion, and Tier 3 = < USD 500 million.
To know about the assumptions considered for the study, download the pdf brochure
Market Size Estimation
The market size estimates and forecasts provided in this study are derived through a mix of the bottom-up approach (revenue share analysis of leading players) and top-down approach (assessment of utilization/adoption/penetration trends, by function, modality, application, offering, deployment mode, therapeutic area, end user, and region).

Data Triangulation
After arriving at the overall market size, from the market size estimation process explained above, the enterprise Imaging IT market was split into segments and subsegments. Data triangulation and market breakdown procedures were employed to complete the overall market engineering process and arrive at the exact statistics for all segments and subsegments, wherever applicable. The data was triangulated by studying various factors and trends from both the demand and supply sides in the enterprise imaging IT market.
Market Definition
The enterprise imaging IT comprises software and IT infrastructure solutions that enable seamless management, integration, and sharing of medical images across departments and care settings. It supports unified imaging workflows, enhances clinical collaboration, and improves diagnostic efficiency. This market serves hospitals, diagnostic centers, and integrated delivery networks, aiming to optimize image-driven decision-making.
Stakeholders
- Vendor Neutral Archive (VNA) & PACS vendors
- Government bodies
- Healthcare service providers
- Clinical/Physician centers
- Healthcare professionals
- Health IT service providers
- Healthcare associations/institutes
- Ambulatory care centers
- Venture capitalists
- Distributors and resellers
- Maintenance and support service providers
- Integration service providers
- Advocacy groups
- Data security and privacy experts
- Investors and financial institutions
- Industry associations and trade groups
Report Objectives
- To define, describe, and forecast the enterprise imaging IT market by function, modality, application, offering, deployment mode, therapeutic area, end user, and region
- To provide detailed information regarding the major drivers, restraints, opportunities, and challenges influencing market growth
- To strategically analyze micromarkets with respect to individual growth trends, prospects, and contributions to the overall enterprise imaging IT solutions market
- To analyze market opportunities for stakeholders and provide details of the competitive landscape for key players
- To forecast the size of the enterprise imaging IT solutions market in five main regions (and their respective countries): North America, Europe, Asia Pacific, the Middle East & Africa, and Latin America
- To provide key industry insights, such as supply chain analysis, regulatory insights, patent analysis, and the impact of the 2025 US tariffs
- To profile the key players in the market and comprehensively analyze their core competencies
- To track and analyze competitive developments, such as solution launches, enhancements, and upgrades; collaborations; partnerships; acquisitions; agreements; and expansions of the leading players in the market
- To benchmark players within the market using the company evaluation matrix, which analyzes market players on various parameters within the broad categories of business strategy, market share, and product offering
Key Questions Addressed by the Report
Who are the leading industry players in the enterprise imaging IT market?
The prominent players in the enterprise imaging IT market include Agfa-Gevaert Group (Belgium), FUJIFILM Corporation (Japan), Merative (US), Pro Medicus, Ltd. (Australia), Optum, Inc. (US), GE HealthCare (US), Intelerad (Canada), Sectra AB (Sweden), CANON MEDICAL SYSTEMS CORPORATION (Japan), Hyland Software, Inc. (US), Koninklijke Philips N.V. (Netherlands), Siemens Healthineers AG (Germany), INFINITT Healthcare Co., Ltd. (South Korea), Novarad (US), Mach7 Technologies (US), Hermes Medical Solutions (Sweden), Konica Minolta, Inc. (Japan), BridgeHead Software Ltd. (England), Sclmage, Inc. (US), VISUS Health IT GmbH (Germany), Dicom Systems, Inc. (US), PostDICOM (Netherlands), Qaelum (Belgium), AdvaHealth Solutions (Singapore), PaxeraHealth (US), and Rad AI (US).
What offerings have been included in the enterprise imaging IT market report?
The enterprise imaging IT market report includes software and services as key offerings.
Which geographical region dominates the enterprise imaging IT market?
The enterprise imaging IT market is segmented into North America, Europe, the Asia Pacific, Latin America, and the Middle East & Africa. In 2024, North America accounted for the largest market share, while Asia Pacific is expected to register the highest growth during the forecast period.
Which end-user segments have been included in the enterprise imaging IT market report?
The report includes hospitals, diagnostic centers, clinics and outpatient settings, pharmaceutical and biotechnology companies, medtech companies, research and academia, and other end users as the primary segments.
What is the total CAGR expected to be recorded for the enterprise imaging IT market during 2025–2030?
The enterprise imaging IT market is expected to hold a CAGR of 12.2% during the forecast period from 2025 to 2030.
Need a Tailored Report?
Customize this report to your needs
Get 10% FREE Customization
Customize This ReportPersonalize This Research
- Triangulate with your Own Data
- Get Data as per your Format and Definition
- Gain a Deeper Dive on a Specific Application, Geography, Customer or Competitor
- Any level of Personalization
Let Us Help You
- What are the Known and Unknown Adjacencies Impacting the Enterprise Imaging IT Market
- What will your New Revenue Sources be?
- Who will be your Top Customer; what will make them switch?
- Defend your Market Share or Win Competitors
- Get a Scorecard for Target Partners

Custom Market Research Services
We Will Customise The Research For You, In Case The Report Listed Above Does Not Meet With Your Requirements
Get 10% Free CustomisationTESTIMONIALS

JAYANT RAJPUROHIT
Director of Market Insights, Data and Analytics
SFI Health,
Leading Pharmaceutical Companywww.sfihealth.com/

We at SFI Health approached MarketsandMarkets for an Opportunity Assessment on "Incidence and Prevalence of Focus Indications" as we wanted to know the most attractive HCPs like Physician, Functional MD, Naturopath and Pharmacist. The project was critical for us to ensure our focus on the right target which would enable sustainable growth and profitability for SFI Health. The business insights provided exceeded our expectations and we were extremely impressed. The team at MarketsandMarkets is highly professional and detail oriented and very well understood our business needs. MarketsandMarkets offers a unique combination of expertise and dedicated engagement model. We identified 2 new products to be launched in coming months, based on the research findings provided by MarketsandMarkets. We are happy with the services and would strongly recommend MarketsandMarkets to my peers in the industry.

BEATRIZ DE LA CALLE
Head of Commercial Analytics
Qualicaps,
Leading Pharmaceutical Companywww.qualicaps.com/

We partnered with MarketsandMarkets for an assessment study on hard empty capsules. The team was extremely professional in understanding our business requirements and we received timely responses to all our queries. The market intelligence and the recommendations has met our business requirements. We were extremely impressed to see the final study results; it really exceeded our expectations. The market intelligence offered by MarketsandMarkets, and clarity on next steps will help us achieve our business objective for the Year 2021. We are happy with the services and would strongly recommend MarketsandMarkets to my peers in the industry.

Bob Williams,
Senior Director Business Development & Innovation
Bracco Diagnostics Inc.,
Italian Multinational in life sciences sector and a World Leader in imaging diagnosticsimaging.bracco.com/us-en
We were pleased with targeted insights that MarketsandMarkets identified from a custom study on the 'Radiation Dose Management Solutions Market'. Your team identified and characterized the market participants as well as underlying trends accurately. This study was useful to Bracco in formulating business strategies for our dose monitoring product lines and we thank MarketsandMarkets for the job well done.
Cody Coonradt,
Market Development and Strategy Manager
3M Health Information Systems,
Leader in Health care Coding, Payment & Analytics Solutions.www.3m.com/3M/en_US/health-information-systems-us
The value for our organization comes from three things: depth of research, specificity of segments and being easy to work with. As important as the first two are, the third can't be underestimated. MarketsandMarkets, maybe more than any other research vendor, wants to know what is top of mind for our team and what big questions we are grappling to answer.
Their customer first approach and high value engagement model, have given us great analysis and excellent value for money


Growth opportunities and latent adjacency in Enterprise Imaging IT Market