2
RESEARCH METHODOLOGY
49
5
MARKET OVERVIEW AND INDUSTRY TRENDS
Cloud-driven AI and cybersecurity innovations redefine network management, offering strategic growth and efficiency.
64
5.2.1.1
INCREASING FOCUS ON ADVANCED CYBERSECURITY MEASURES
5.2.1.2
GROWING SHIFT TOWARD CLOUD-BASED SERVICES
5.2.1.3
ADOPTION OF AI/ML SOLUTIONS TO AUTOMATE NETWORK MANAGEMENT TASKS
5.2.2.1
HIGH INITIAL INVESTMENTS
5.2.2.2
MANAGING HIGH COSTS OF WAN LINKS
5.2.3.1
IMPLEMENTATION OF ZERO TRUST SECURITY ARCHITECTURE
5.2.3.2
GROWTH IN EDGE COMPUTING
5.2.3.3
INTRODUCTION OF QUANTUM-SAFE NETWORKS
5.2.4.1
COMPLEX NETWORK ENVIRONMENTS
5.2.4.2
REGULATORY AND COMPLIANCE ISSUES
5.3
BRIEF HISTORY OF ENTERPRISE NETWORKING
5.4
SUPPLY CHAIN ANALYSIS
5.6.1
PRIVATE HEALTHCARE FIRM RECOLETAS SALUD USED JUNIPER AI-NATIVE NETWORKING PLATFORM TO ENHANCE PATIENT EXPERIENCE
5.6.2
CB&S BANK, WITH PENCHANT FOR M&A, USED FORTINET SECURITY FABRIC TO SIMPLIFY NETWORKING AND SECURITY
5.6.3
MEXICO'S CENACE BUILT AGILE, HIGH-CAPACITY NETWORK USING HUAWEI'S HIGH-QUALITY 10 GBPS SMART POWER CAMPUS SOLUTION
5.6.4
EXTREME NETWORKS POWERED SANTA CASA’S ADVANCED HEALTHCARE SERVICES
5.6.5
DHL COLLABORATED WITH CISCO TO MEET DEMANDS OF DIGITAL TRANSFORMATION
5.6.6
BROADCOM'S DX NETOPS HELPED ALTICE PORTUGAL GAIN VISIBILITY INTO TRADITIONAL AND SOFTWARE-DEFINED NETWORKS
5.7
TARIFF AND REGULATORY LANDSCAPE
5.7.1
TARIFF RELATED TO MACHINES FOR RECEPTION, CONVERSION, AND TRANSMISSION OR REGENERATION OF VOICE, IMAGES, OR OTHER DATA
5.7.2
REGULATORY BODIES, GOVERNMENT AGENCIES, AND OTHER ORGANIZATIONS
5.7.2.4
MIDDLE EAST & AFRICA
5.8.2
ADJACENT TECHNOLOGIES
5.8.2.1
ARTIFICIAL INTELLIGENCE (AI)/MACHINE LEARNING (ML)
5.8.2.2
5G AND NEXT-GENERATION NETWORKS
5.8.2.3
INTERNET OF THINGS (IOT)
5.8.3
COMPLEMENTARY TECHNOLOGIES
5.8.3.1
VIRTUAL PRIVATE NETWORKS (VPNS)
5.9.1
LIST OF MAJOR PATENTS
5.10.1
AVERAGE SELLING PRICE TREND OF KEY PLAYERS, BY HARDWARE APPLIANCE
5.10.2
INDICATIVE PRICING ANALYSIS, BY NETWORKING SOFTWARE
5.11
TRENDS/DISRUPTIONS IMPACTING CUSTOMER BUSINESS
5.12
KEY CONFERENCES AND EVENTS, 2024–2025
5.13
PORTER’S FIVE FORCES ANALYSIS
5.13.1
THREAT OF NEW ENTRANTS
5.13.2
THREAT OF SUBSTITUTES
5.13.3
BARGAINING POWER OF BUYERS
5.13.4
BARGAINING POWER OF SUPPLIERS
5.13.5
INTENSITY OF COMPETITIVE RIVALRY
5.14
KEY STAKEHOLDERS AND BUYING CRITERIA
5.14.1
KEY STAKEHOLDERS IN BUYING PROCESS
5.15
TECHNOLOGY ROADMAP FOR ENTERPRISE NETWORKING MARKET
5.15.1
SHORT-TERM ROADMAP (2023–2025)
5.15.2
MID-TERM ROADMAP (2026–2028)
5.15.3
LONG-TERM ROADMAP (2029–2030)
5.16
BEST PRACTICES IN ENTERPRISE NETWORKING MARKET
5.16.3
PROFESSIONAL INSTALLATION AND CONTINUOUS MONITORING
5.16.4
SECURITY INTEGRATION
5.16.5
OPERATION AND MANAGEMENT
5.16.6
REGULATORY COMPLIANCE
5.16.7
SKILL DEVELOPMENT AND TRAINING
5.17
CURRENT AND EMERGING BUSINESS MODELS
5.17.1
NETWORK AS A SERVICE (NAAS)
5.17.2
ZERO-TRUST SECURITY MODELS
5.17.3
EDGE COMPUTING INTEGRATION
5.17.4
AI-DRIVEN AUTONOMOUS NETWORKS
5.17.5
HYBRID AND MULTI-CLOUD NETWORKING
5.18
ENTERPRISE NETWORKING MARKET: TOOLS, FRAMEWORKS, AND TECHNIQUES
5.19
HS CODE ANALYSIS: MACHINES FOR RECEPTION, CONVERSION, AND TRANSMISSION OR REGENERATION OF VOICE, IMAGES, OR OTHER DATA (851762)
5.19.1
EXPORT SCENARIO OF MACHINES FOR RECEPTION, CONVERSION, AND TRANSMISSION OR REGENERATION OF VOICE, IMAGES, OR OTHER DATA (851762)
5.19.2
IMPORT SCENARIO OF MACHINES FOR RECEPTION, CONVERSION, AND TRANSMISSION OR REGENERATION OF VOICE, IMAGES, OR OTHER DATA (851762)
5.20
INVESTMENT AND FUNDING SCENARIO
5.21
IMPACT OF ARTIFICIAL INTELLIGENCE (AI)/GENERATIVE AI ON ENTERPRISE NETWORKING MARKET
5.21.1
IMPACT OF AI/GENERATIVE AI ON ENTERPRISE NETWORKING
5.21.2
USE CASES OF GENERATIVE AI IN ENTERPRISE NETWORKING
5.22
IMPACT OF INTEGRATION OF SD-WAN AND SASE ON ENTERPRISE NETWORKING MARKET
6
ENTERPRISE NETWORKING MARKET, BY OFFERING
Market Size & Growth Rate Forecast Analysis to 2029 in USD Million | 74 Data Tables
99
6.1.1
OFFERING: ENTERPRISE NETWORKING MARKET DRIVERS
6.2.1.1
TO DISCOVER OPTIMAL PATH AND EASE ROUTING OF DATA TRAFFIC
6.2.2.1
TO EASE CONNECTIVITY OF DEVICES WITHIN NETWORK AND DATA PACKET FORWARDING
6.2.2.2.2
MODULAR SWITCHES
6.2.2.3
SWITCHES BY SPEED
6.2.2.3.1
>1 GBPS TO <=10 GBPS
6.2.2.3.2
>10 GBPS TO <=40 GBPS
6.2.2.3.3
> 40 GBPS TO <=100 GBPS
6.2.2.3.4
>100 GBPS TO <=400 GBPS
6.2.2.3.5
400 GBPS AND ABOVE
6.2.3.1
NEED TO MAINTAIN INTERNET SPEED IN WIRELESS NETWORK FOR RELIABLE CONNECTIVITY
6.2.4.1
TO ENABLE SMOOTH COMMUNICATION BETWEEN DIFFERENT NETWORK ENVIRONMENTS
6.2.5.1
TO ESTABLISH BARRIER BETWEEN TRUSTED AND UNTRUSTED NETWORKS AND FILTER DATA TRAFFIC
6.2.6
OTHER NETWORKING DEVICES
6.3.1
NETWORK MANAGEMENT & MONITORING
6.3.1.1
GETTING VISIBILITY INTO HEALTH AND PERFORMANCE OF NETWORKING DEVICES
6.3.2.1
NEED TO MONITOR AND PROTECT ENTERPRISE NETWORK FROM SECURITY RISKS
6.3.3
NETWORK VIRTUALIZATION
6.3.3.1
NEED TO DECOUPLE NETWORK SERVICES FROM UNDERLYING HARDWARE
6.3.4.1
TO AUTOMATE PLANNING, DEPLOYMENT, OPERATIONS, AND OPTIMIZATION OF NETWORKS AND THEIR SERVICES
6.3.5
OTHER NETWORKING SOFTWARE
6.4.1
PROFESSIONAL SERVICES
6.4.1.1
PROVIDING ORGANIZATIONS WITH VALUABLE INSIGHTS, TECHNICAL EXPERTISE, AND BEST PRACTICES TO ENSURE SUCCESSFUL PLANNING, IMPLEMENTATION, AND OPTIMIZATION OF NETWORK
6.4.1.3
DEPLOYMENT & INTEGRATION
6.4.1.4
SUPPORT & MAINTENANCE
6.4.2.1
TO ENSURE NETWORKS ARE CONTINUOUSLY MONITORED FOR PERFORMANCE ISSUES, SECURITY VULNERABILITIES, AND OPERATIONAL EFFICIENCY
7
ENTERPRISE NETWORKING MARKET, BY NETWORK
Market Size & Growth Rate Forecast Analysis to 2029 in USD Million | 10 Data Tables
132
7.1.1
NETWORK: ENTERPRISE NETWORKING MARKET DRIVERS
7.2.1
NEED FOR HIGH-CAPACITY, RELIABLE NETWORKING SOLUTIONS TO SUPPORT LARGE-SCALE DATA AND COMMUNICATION DEMAND ACROSS ENTERPRISE CAMPUSES TO DRIVE MARKET
7.3.1
ADOPTION OF ADVANCED DATA CENTER NETWORKING SOLUTIONS TO SUPPORT CLOUD COMPUTING, BIG DATA, AND VIRTUALIZATION TO PROPEL MARKET GROWTH
7.4.1
ACCELERATED GROWTH FUELED BY NEED FOR SECURE AND SCALABLE NETWORKING SOLUTIONS TO EFFICIENTLY CONNECT AND MANAGE DISPERSED ENTERPRISE BRANCHES TO FOSTER GROWTH
7.5.1
INCREASED RELIANCE ON REMOTE NETWORKS DRIVEN BY WIDESPREAD ADOPTION OF SOLUTIONS THAT ENSURE SECURE AND DEPENDABLE CONNECTIVITY FOR DISTRIBUTED WORKFORCE
8
ENTERPRISE NETWORKING MARKET, BY DEPLOYMENT MODE
Market Size & Growth Rate Forecast Analysis to 2029 in USD Million | 8 Data Tables
139
8.1.1
DEPLOYMENT MODE: ENTERPRISE NETWORKING MARKET DRIVERS
8.2.1
ORGANIZATIONS SEEKING CUSTOMIZABLE NETWORKING SOLUTIONS THAT ALLOW GREATER CONTROL AND FLEXIBILITY OVER INFRASTRUCTURE DEPLOYMENT WILL FOSTER GROWTH
8.3
MANAGED SD-WAN (TELCO OR MSP)
8.3.1
MARKET EXPANSION DRIVEN BY DEMAND FOR MANAGED SERVICES THAT OFFER OPTIMIZED, SECURE, AND SCALABLE NETWORK CONNECTIVITY
8.4
SD-WAN AS A SERVICE (CLOUD-BASED)
8.4.1
GROWTH DRIVEN BY SHIFT TOWARD CLOUD-BASED NETWORKING SOLUTIONS THAT PROVIDE FLEXIBLE, SCALABLE, AND EASY-TO-MANAGE CONNECTIVITY
9
ENTERPRISE NETWORKING MARKET, BY CONNECTION TYPE
Market Size & Growth Rate Forecast Analysis to 2029 in USD Million | 6 Data Tables
145
9.1.1
CONNECTION TYPE: ENTERPRISE NETWORKING MARKET DRIVERS
9.2.1
ONGOING NEED FOR STABLE AND HIGH-SPEED WIRED CONNECTIONS CRITICAL FOR SUPPORTING ENTERPRISE-LEVEL APPLICATIONS AND DATA-INTENSIVE OPERATIONS TO DRIVE MARKET
9.3.1
INCREASED ADOPTION OF WIRELESS NETWORKING TECHNOLOGIES THAT OFFER MOBILITY, EASE OF DEPLOYMENT, AND SUPPORT FOR MODERN, FLEXIBLE WORK ENVIRONMENTS TO PROPEL MARKET
10
ENTERPRISE NETWORKING MARKET, BY END USER
Market Size & Growth Rate Forecast Analysis to 2029 in USD Million | 32 Data Tables
150
10.1.1
END USER: ENTERPRISE NETWORKING MARKET DRIVERS
10.2.1
SERVICE PROVIDER: ENTERPRISE NETWORKING MARKET DRIVERS
10.2.2
CLOUD SERVICE PROVIDERS
10.2.2.1
RISING DEMAND FOR SCALABLE AND HIGH-PERFORMANCE NETWORKING SOLUTIONS AS CLOUD SERVICE PROVIDERS SEEK TO ENHANCE DATA MANAGEMENT AND APPLICATION HOSTING CAPABILITIES
10.2.3
TELECOM SERVICE PROVIDERS
10.2.3.1
MARKET EXPANSION DRIVEN BY HEIGHTENED NEED FOR HIGH-CAPACITY, SECURE, AND RELIABLE NETWORKING SOLUTIONS THAT SUPPORT GROWING SCALE AND COMPLEXITY OF TELECOM SERVICES
10.3.1.1
GROWTH DRIVEN BY INCREASING DEMAND FOR NETWORKING SOLUTIONS THAT SUPPORT GLOBAL COLLABORATION, CLOUD INTEGRATION, AND REMOTE WORK CAPABILITIES ACROSS IT AND ITES SECTORS
10.3.1.2
IT & ITES: ENTERPRISE NETWORKING USE CASES
10.3.1.2.1
GLOBAL COLLABORATION
10.3.1.2.2
CLOUD COMPUTING INTEGRATION
10.3.1.2.3
REMOTE WORK SOLUTIONS
10.3.1.2.4
DATA CENTER MANAGEMENT
10.3.2.1
GROWTH DRIVEN BY ADOPTION OF SECURE AND HIGH-SPEED NETWORKING SOLUTIONS DESIGNED TO ENHANCE ONLINE BANKING, FRAUD PREVENTION, AND COMPLIANCE WITH INDUSTRY REGULATIONS
10.3.2.2
BFSI: ENTERPRISE NETWORKING USE CASES
10.3.2.2.1
SECURE ONLINE BANKING
10.3.2.2.2
FRAUD DETECTION AND PREVENTION
10.3.2.2.3
REGULATORY COMPLIANCE
10.3.2.2.4
BRANCH CONNECTIVITY
10.3.3
HEALTHCARE & LIFE SCIENCES
10.3.3.1
EXPANSION DRIVEN BY ADOPTION OF NETWORKING TECHNOLOGIES THAT ENABLE TELEMEDICINE, SECURE HEALTH RECORDS MANAGEMENT, AND REAL-TIME IOT-ENABLED PATIENT MONITORING
10.3.3.2
HEALTHCARE & LIFE SCIENCES: ENTERPRISE NETWORKING USE CASES
10.3.3.2.1
ELECTRONIC HEALTH RECORDS (EHRS) INTEGRATION
10.3.3.2.2
MEDICAL DEVICE CONNECTIVITY
10.3.3.2.3
SECURE PATIENT DATA MANAGEMENT
10.3.3.2.4
TELEMEDICINE SERVICES
10.3.3.2.5
CLINICAL RESEARCH AND DATA ANALYSIS
10.3.4.1
GROWTH DRIVEN BY ADOPTION OF NETWORKING SOLUTIONS THAT ENABLE SMART FACTORY AUTOMATION, INTEGRATION OF INDUSTRIAL IOT (IIOT), AND PREDICTIVE MAINTENANCE STRATEGIES
10.3.4.2
MANUFACTURING: ENTERPRISE NETWORKING USE CASES
10.3.4.2.1
REAL-TIME PRODUCTION MONITORING
10.3.4.2.2
SUPPLY CHAIN MANAGEMENT
10.3.4.2.3
PREDICTIVE MAINTENANCE
10.3.4.2.4
INTEGRATED MANUFACTURING EXECUTION SYSTEMS (MES)
10.3.5
TRANSPORTATION & LOGISTICS
10.3.5.1
RISING NEED FOR NETWORKING SOLUTIONS THAT ENHANCE REAL-TIME TRACKING, FLEET MANAGEMENT, AND AUTOMATION IN LOGISTICS OPERATIONS
10.3.5.2
TRANSPORTATION & LOGISTICS: ENTERPRISE NETWORKING USE CASES
10.3.5.2.1
REAL-TIME FLEET TRACKING
10.3.5.2.2
FLEET MANAGEMENT
10.3.5.2.3
SUPPLY CHAIN VISIBILITY
10.3.5.2.4
AUTONOMOUS VEHICLE OPERATIONS
10.3.5.2.5
WAREHOUSE AUTOMATION
10.3.6.1
GROWING DEMAND FOR COMPREHENSIVE NETWORKING SOLUTIONS THAT SUPPORT CAMPUS-WIDE CONNECTIVITY, VIRTUAL LEARNING, AND SECURE ONLINE ASSESSMENTS
10.3.6.2
EDUCATION: ENTERPRISE NETWORKING USE CASES
10.3.6.2.1
CAMPUS-WIDE WI-FI NETWORKS
10.3.6.2.2
VIRTUAL CLASSROOMS
10.3.6.2.3
LEARNING MANAGEMENT SYSTEM (LMS)
10.3.6.2.4
ONLINE EXAMS AND ASSESSMENTS
10.3.6.2.5
RESEARCH COLLABORATION
10.3.7
RETAIL & E-COMMERCE
10.3.7.1
INCREASING NEED FOR INTEGRATED NETWORKING SOLUTIONS THAT ENHANCE OMNICHANNEL CUSTOMER EXPERIENCES, REAL-TIME INVENTORY TRACKING, AND SECURE ONLINE TRANSACTIONS
10.3.7.2
RETAIL & E-COMMERCE: ENTERPRISE NETWORKING USE CASES
10.3.7.2.1
OMNICHANNEL CUSTOMER EXPERIENCE
10.3.7.2.2
INVENTORY MANAGEMENT
10.3.7.2.3
POINT-OF-SALE (POS) SYSTEMS
10.3.7.2.4
CUSTOMER ANALYTICS AND PERSONALIZATION
10.3.7.2.5
E-COMMERCE PLATFORM MANAGEMENT
10.3.8.1
ADOPTION OF NETWORKING SOLUTIONS FOR SMART CITY DEVELOPMENT, SECURE GOVERNMENT COMMUNICATIONS, AND PROVISION OF E-GOVERNMENT SERVICES
10.3.8.2
GOVERNMENT: ENTERPRISE NETWORKING USE CASES
10.3.8.2.1
SMART CITY INITIATIVES
10.3.8.2.2
SECURE COMMUNICATION NETWORKS
10.3.8.2.3
E-GOVERNMENT SERVICES
10.3.8.2.4
DISASTER RESPONSE AND MANAGEMENT
10.3.8.2.5
DEFENSE AND NATIONAL SECURITY
10.3.9
MEDIA & ENTERTAINMENT
10.3.9.1
ADOPTION OF ADVANCED NETWORKING TECHNOLOGIES THAT FACILITATE CONTENT DISTRIBUTION, LIVE STREAMING, AND CLOUD-BASED MEDIA PRODUCTION
10.3.9.2
MEDIA & ENTERTAINMENT: ENTERPRISE NETWORKING USE CASES
10.3.9.2.1
CONTENT DISTRIBUTION NETWORKS (CDNS)
10.3.9.2.2
LIVE STREAMING
10.3.9.2.3
POST-PRODUCTION COLLABORATION
10.3.9.2.4
DIGITAL RIGHTS MANAGEMENT (DRM)
10.3.9.2.5
CLOUD-BASED MEDIA PRODUCTION
10.3.10
OTHER ENTERPRISES
10.3.10.1
OTHER ENTERPRISES: ENTERPRISE NETWORKING USE CASES
10.3.10.1.1
SMART GRID MANAGEMENT
10.3.10.1.2
GUEST WI-FI AND CONNECTIVITY
10.3.10.1.3
REMOTE MONITORING
11
ENTERPRISE NETWORKING MARKET, BY TECHNOLOGY
Market Size & Growth Rate Forecast Analysis
173
11.1
SOFTWARE-DEFINED NETWORKING (SDN)
11.2
NETWORK FUNCTION VIRTUALIZATION (NFV)
11.3
SOFTWARE-DEFINED WIDE AREA NETWORK (SD-WAN)
11.4
SECURE ACCESS SERVICE EDGE (SASE)
11.6
INTENT-BASED NETWORKING (IBN)
12
ENTERPRISE NETWORKING MARKET, BY REGION
Comprehensive coverage of 8 Regions with country-level deep-dive of 16 Countries | 348 Data Tables.
176
12.2.1
NORTH AMERICA: MACROECONOMIC OUTLOOK
12.2.2.1
RISING PREVALENCE OF AI ADVANCEMENTS, AUTOMATION, AND NEXT-GEN NETWORK TECHNOLOGIES TO DRIVE MARKET
12.2.3.1
INCREASING INVESTMENTS BY VENDORS IN NETWORK INFRASTRUCTURE TO OFFER OPTIMIZED ACCESS TO CLOUD SOLUTIONS TO PROPEL MARKET
12.3.1
EUROPE: MACROECONOMIC OUTLOOK
12.3.2.1
STRINGENT TELECOM REGULATIONS SUPPORT ADOPTION OF ENTERPRISE NETWORKING SOLUTIONS IN UK
12.3.3.1
STRONG FOCUS ON INDUSTRY 4.0 AND SMART MANUFACTURING AND NEED FOR ADVANCED NETWORKING SOLUTIONS TO FOSTER MARKET GROWTH
12.3.4.1
PRESENCE OF VARIOUS TELECOM OPERATORS AND REGULATORY BODIES SUPPORTING ENTERPRISE NETWORKING SOLUTIONS TO CONTRIBUTE TO MARKET GROWTH
12.3.5.1
NEED TO ADHERE TO DATA PROTECTION LAWS TO ACCELERATE MARKET GROWTH IN ITALY
12.3.6.1
RISING INVESTMENTS IN AI AND CLOUD-BASED SOLUTIONS TO MIGRATE MISSION-CRITICAL WORKLOADS TO ENHANCE MARKET GROWTH
12.3.7.1
PRESENCE OF MAJOR VENDORS TO FUEL DEMAND FOR ENTERPRISE NETWORKING SOLUTIONS
12.4.1
ASIA PACIFIC: MACROECONOMIC OUTLOOK
12.4.2.1
SIGNIFICANT INVESTMENTS BY MAJOR PLAYERS AND NEED FOR RAPID DEVELOPMENT AND ADOPTION OF NEW TECHNOLOGIES TO FOSTER MARKET GROWTH
12.4.3.1
INCREASING ADOPTION OF ADVANCED TECHNOLOGIES AND INTEGRATION WITH AI AND AUTOMATION TO CONTRIBUTE TO MARKET GROWTH
12.4.4.1
GROWING FOCUS ON CLOUD AND NETWORK CONNECTIVITY POWERED BY AI TECHNOLOGY TO DRIVE ADOPTION OF ENTERPRISE NETWORKING SOLUTIONS
12.4.5
AUSTRALIA & NEW ZEALAND
12.4.5.1
STRICTER DATA PROTECTION REGULATIONS TO INFLUENCE DEVELOPMENT OF SECURE ENTERPRISE NETWORKING SOLUTIONS
12.4.6.1
HEAVY INVESTMENTS BY BUSINESSES AND GOVERNMENTS TOWARD DIGITAL TRANSFORMATION TO PROPEL MARKET
12.4.7.1
ACCELERATED ADOPTION OF REMOTE WORK MODELS TO FUEL DEMAND FOR ENTERPRISE NETWORKING SOLUTIONS
12.4.8
REST OF ASIA PACIFIC
12.5
MIDDLE EAST & AFRICA
12.5.1
MIDDLE EAST & AFRICA: MACROECONOMIC OUTLOOK
12.5.2.1
ECONOMIC DIVERSIFICATION EFFORTS BY GOVERNMENTS DRIVING GROWTH OF ENTERPRISE NETWORKING MARKET
12.5.2.2.1
NEED TO SUPPORT INFRASTRUCTURE DEVELOPMENT AND AUTOMATE SECURITY FOR VIRTUALIZED DATA CENTERS TO PROPEL MARKET
12.5.2.3.1
NEED FOR DIGITAL TRANSFORMATION UNDER VISION 2030 TO PROPEL ENTERPRISE NETWORKING MARKET
12.5.2.4.1
MODERNIZATION AND DIGITAL INFRASTRUCTURE IMPROVEMENTS TO BOOST ENTERPRISE NETWORKING MARKET GROWTH
12.5.2.5.1
NEED FOR CLOUD-FIRST POLICIES AND GOVERNMENT-DRIVEN DIGITALIZATION TO DRIVE GROWTH
12.5.2.6
REST OF MIDDLE EAST
12.5.3.1
NEED FOR RELIABLE CONNECTIVITY SOLUTIONS IN UNDERSERVED AREAS TO ACCELERATES GROWTH OF ENTERPRISE NETWORKING MARKET
12.6.1
LATIN AMERICA: MACROECONOMIC OUTLOOK
12.6.2.1
ONGOING INVESTMENTS IN TELECOM INFRASTRUCTURE AND MODERNIZATION PROJECTS TO BOOST ADOPTION OF ENTERPRISE NETWORKING SOLUTIONS
12.6.3.1
NEED FOR IMPROVED CONNECTIVITY AND GOVERNMENT INFRASTRUCTURE INVESTMENTS TO SUPPORT ENTERPRISE NETWORKING MARKET
12.6.4
REST OF LATIN AMERICA
13
COMPETITIVE LANDSCAPE
Discover top strategies and market positions of key players and emerging leaders in enterprise networking.
287
13.2
KEY PLAYER STRATEGIES/RIGHT TO WIN
13.4
MARKET SHARE ANALYSIS
13.4.1
MARKET RANKING ANALYSIS
13.5
COMPANY EVALUATION MATRIX: KEY PLAYERS, 2023
13.5.5
COMPANY FOOTPRINT: KEY PLAYERS, 2023
13.5.5.1
COMPANY FOOTPRINT
13.5.5.2
OFFERING FOOTPRINT
13.5.5.3
END USER FOOTPRINT
13.5.5.4
REGIONAL FOOTPRINT
13.6
COMPANY EVALUATION MATRIX: STARTUPS/SMES, 2023
13.6.1
PROGRESSIVE COMPANIES
13.6.2
RESPONSIVE COMPANIES
13.6.5
COMPETITIVE BENCHMARKING: STARTUPS/SMES, 2023
13.6.5.1
KEY STARTUPS/SMES
13.6.5.2
COMPETITIVE BENCHMARKING OF KEY STARTUPS/SMES
13.7
COMPANY VALUATION AND FINANCIAL METRICS OF KEY ENTERPRISE NETWORKING PROVIDERS
13.8
BRAND/PRODUCT COMPARISON
13.9
COMPETITIVE SCENARIO AND TRENDS
13.9.1
PRODUCT LAUNCHES AND ENHANCEMENTS
14
COMPANY PROFILES
In-depth Company Profiles of Leading Market Players with detailed Business Overview, Product and Service Portfolio, Recent Developments, and Unique Analyst Perspective (MnM View)
305
14.1.1
CISCO SYSTEMS, INC.
14.1.1.1
BUSINESS OVERVIEW
14.1.1.2
PRODUCTS/SOLUTIONS/SERVICES OFFERED
14.1.1.3
RECENT DEVELOPMENTS
14.1.1.3.1
PRODUCT LAUNCHES AND ENHANCEMENTS
14.1.1.4.2
STRATEGIC CHOICES
14.1.1.4.3
WEAKNESSES AND COMPETITIVE THREATS
14.1.2
HEWLETT PACKARD ENTERPRISE (HPE)
14.1.3
HUAWEI TECHNOLOGIES CO. LTD.
14.1.7
ARISTA NETWORKS, INC.
14.1.8
EXTREME NETWORKS, INC.
14.1.10
CHECK POINT SOFTWARE TECHNOLOGIES
14.1.11
RIVERBED TECHNOLOGY
14.1.13
PALO ALTO NETWORKS
14.1.15
ALCATEL-LUCENT ENTERPRISES
15
ADJACENT/RELATED MARKETS
356
15.2.3
SD-WAN MARKET, BY OFFERING
15.2.4
SD-WAN MARKET, BY DEPLOYMENT MODE
15.2.5
SD-WAN MARKET, BY ORGANIZATION SIZE
15.2.6
SD-WAN MARKET, BY END USER
15.2.7
SD-WAN MARKET, BY REGION
15.3
SOFTWARE-DEFINED NETWORKING (SDN) MARKET
15.3.3
SOFTWARE-DEFINED NETWORKING MARKET, BY OFFERING
15.3.4
SOFTWARE-DEFINED NETWORKING MARKET, BY SDN TYPE
15.3.5
SOFTWARE-DEFINED NETWORKING MARKET, BY END USER
15.3.6
SOFTWARE-DEFINED NETWORKING MARKET, BY APPLICATION
15.3.7
SOFTWARE-DEFINED NETWORKING MARKET, BY VERTICAL
15.3.8
SOFTWARE-DEFINED NETWORKING MARKET, BY REGION
16.2
KNOWLEDGESTORE: MARKETSANDMARKETS’ SUBSCRIPTION PORTAL
16.3
CUSTOMIZATION OPTIONS
TABLE 1
USD EXCHANGE RATES, 2019–2023
TABLE 2
ENTERPRISE NETWORKING MARKET: ECOSYSTEM
TABLE 3
NORTH AMERICA: LIST OF REGULATORY BODIES, GOVERNMENT AGENCIES, AND OTHER ORGANIZATIONS
TABLE 4
EUROPE: LIST OF REGULATORY BODIES, GOVERNMENT AGENCIES, AND OTHER ORGANIZATIONS
TABLE 5
ASIA PACIFIC: LIST OF REGULATORY BODIES, GOVERNMENT AGENCIES, AND OTHER ORGANIZATIONS
TABLE 6
ROW: LIST OF REGULATORY BODIES, GOVERNMENT AGENCIES, AND OTHER ORGANIZATIONS
TABLE 7
AVERAGE SELLING PRICE OF KEY PLAYERS, BY NETWORKING DEVICE
TABLE 8
INDICATIVE PRICING LEVELS OF ENTERPRISE NETWORKING SOFTWARE
TABLE 9
ENTERPRISE NETWORKING MARKET: DETAILED LIST OF CONFERENCES AND EVENTS, 2024–2025
TABLE 10
PORTER’S FIVE FORCES IMPACT ON ENTERPRISE NETWORKING MARKET
TABLE 11
INFLUENCE OF STAKEHOLDERS ON BUYING PROCESS FOR TOP THREE END USERS
TABLE 12
KEY BUYING CRITERIA FOR TOP THREE END USERS
TABLE 13
ENTERPRISE NETWORKING MARKET, BY OFFERING, 2018–2023 (USD MILLION)
TABLE 14
ENTERPRISE NETWORKING MARKET, BY OFFERING, 2024–2029 (USD MILLION)
TABLE 15
NETWORKING DEVICES: ENTERPRISE NETWORKING MARKET, BY REGION, 2018–2023 (USD MILLION)
TABLE 16
NETWORKING DEVICES: ENTERPRISE NETWORKING MARKET, BY REGION, 2024–2029 (USD MILLION)
TABLE 17
NETWORKING DEVICES: ENTERPRISE NETWORKING MARKET, BY TYPE, 2018–2023 (USD MILLION)
TABLE 18
NETWORKING DEVICES: ENTERPRISE NETWORKING MARKET, BY TYPE, 2024–2029 (USD MILLION)
TABLE 19
ROUTERS: ENTERPRISE NETWORKING MARKET, BY REGION, 2018–2023 (USD MILLION)
TABLE 20
ROUTERS: ENTERPRISE NETWORKING MARKET, BY REGION, 2024–2029 (USD MILLION)
TABLE 21
SWITCHES: ENTERPRISE NETWORKING MARKET, BY REGION, 2018–2023 (USD MILLION)
TABLE 22
SWITCHES: ENTERPRISE NETWORKING MARKET, BY REGION, 2024–2029 (USD MILLION)
TABLE 23
SWITCHES: ENTERPRISE NETWORKING MARKET, BY TYPE, 2018–2023 (USD MILLION)
TABLE 24
SWITCHES: ENTERPRISE NETWORKING MARKET, BY TYPE, 2024–2029 (USD MILLION)
TABLE 25
FIXED SWITCHES: ENTERPRISE NETWORKING MARKET, BY REGION, 2018–2023 (USD MILLION)
TABLE 26
FIXED SWITCHES: ENTERPRISE NETWORKING MARKET, BY REGION, 2024–2029 (USD MILLION)
TABLE 27
FIXED SWITCHES: ENTERPRISE NETWORKING MARKET, BY TYPE, 2018–2023 (USD MILLION)
TABLE 28
FIXED SWITCHES: ENTERPRISE NETWORKING MARKET, BY TYPE, 2024–2029 (USD MILLION)
TABLE 29
MANAGED SWITCHES: ENTERPRISE NETWORKING MARKET, BY REGION, 2018–2023 (USD MILLION)
TABLE 30
MANAGED SWITCHES: ENTERPRISE NETWORKING MARKET, BY REGION, 2024–2029 (USD MILLION)
TABLE 31
UNMANAGED SWITCHES: ENTERPRISE NETWORKING MARKET, BY REGION, 2018–2023 (USD MILLION)
TABLE 32
UNMANAGED SWITCHES: ENTERPRISE NETWORKING MARKET, BY REGION, 2024–2029 (USD MILLION)
TABLE 33
POWER OVER ETHERNET (POE) SWITCHES: ENTERPRISE NETWORKING MARKET, BY REGION, 2018–2023 (USD MILLION)
TABLE 34
POWER OVER ETHERNET (POE) SWITCHES: ENTERPRISE NETWORKING MARKET, BY REGION, 2024–2029 (USD MILLION)
TABLE 35
MODULAR SWITCHES: ENTERPRISE NETWORKING MARKET, BY REGION, 2018–2023 (USD MILLION)
TABLE 36
MODULAR SWITCHES: ENTERPRISE NETWORKING MARKET, BY REGION, 2024–2029 (USD MILLION)
TABLE 37
SWITCHES: ENTERPRISE NETWORKING MARKET, BY SPEED, 2018–2023 (USD MILLION)
TABLE 38
SWITCHES: ENTERPRISE NETWORKING MARKET, BY SPEED, 2024–2029 (USD MILLION)
TABLE 39
>1 GBPS TO <=10 GBPS: ENTERPRISE NETWORKING MARKET, BY REGION, 2018–2023 (USD MILLION)
TABLE 40
>1 GBPS TO <=10 GBPS: ENTERPRISE NETWORKING MARKET, BY REGION, 2024–2029 (USD MILLION)
TABLE 41
>10 GBPS TO <=40 GBPS: ENTERPRISE NETWORKING MARKET, BY REGION, 2018–2023 (USD MILLION)
TABLE 42
>10 GBPS TO <=40 GBPS: ENTERPRISE NETWORKING MARKET, BY REGION, 2024–2029 (USD MILLION)
TABLE 43
> 40 GBPS TO <=100 GBPS: ENTERPRISE NETWORKING MARKET, BY REGION, 2018–2023 (USD MILLION)
TABLE 44
> 40 GBPS TO <=100 GBPS: ENTERPRISE NETWORKING MARKET, BY REGION, 2024–2029 (USD MILLION)
TABLE 45
>100 GBPS TO <=400 GBPS: ENTERPRISE NETWORKING MARKET, BY REGION, 2018–2023 (USD MILLION)
TABLE 46
>100 GBPS TO <=400 GBPS: ENTERPRISE NETWORKING MARKET, BY REGION, 2024–2029 (USD MILLION)
TABLE 47
400 GBPS AND ABOVE: ENTERPRISE NETWORKING MARKET, BY REGION, 2018–2023 (USD MILLION)
TABLE 48
400 GBPS AND ABOVE: ENTERPRISE NETWORKING MARKET, BY REGION, 2024–2029 (USD MILLION)
TABLE 49
ACCESS POINTS: ENTERPRISE NETWORKING MARKET, BY REGION, 2018–2023 (USD MILLION)
TABLE 50
ACCESS POINTS: ENTERPRISE NETWORKING MARKET, BY REGION, 2024–2029 (USD MILLION)
TABLE 51
GATEWAYS: ENTERPRISE NETWORKING MARKET, BY REGION, 2018–2023 (USD MILLION)
TABLE 52
GATEWAYS: ENTERPRISE NETWORKING MARKET, BY REGION, 2024–2029 (USD MILLION)
TABLE 53
FIREWALLS: ENTERPRISE NETWORKING MARKET, BY REGION, 2018–2023 (USD MILLION)
TABLE 54
FIREWALLS: ENTERPRISE NETWORKING MARKET, BY REGION, 2024–2029 (USD MILLION)
TABLE 55
OTHER NETWORKING DEVICES: ENTERPRISE NETWORKING MARKET, BY REGION, 2018–2023 (USD MILLION)
TABLE 56
OTHER NETWORKING DEVICES: ENTERPRISE NETWORKING MARKET, BY REGION, 2024–2029 (USD MILLION)
TABLE 57
NETWORKING SOFTWARE: ENTERPRISE NETWORKING MARKET, BY REGION, 2018–2023 (USD MILLION)
TABLE 58
NETWORKING SOFTWARE: ENTERPRISE NETWORKING MARKET, BY REGION, 2024–2029 (USD MILLION)
TABLE 59
NETWORKING SOFTWARE: ENTERPRISE NETWORKING MARKET, BY TYPE, 2018–2023 (USD MILLION)
TABLE 60
NETWORKING SOFTWARE: ENTERPRISE NETWORKING MARKET, BY TYPE, 2024–2029 (USD MILLION)
TABLE 61
NETWORK MANAGEMENT & MONITORING: ENTERPRISE NETWORKING MARKET, BY REGION, 2018–2023 (USD MILLION)
TABLE 62
NETWORK MANAGEMENT & MONITORING: ENTERPRISE NETWORKING MARKET, BY REGION, 2024–2029 (USD MILLION)
TABLE 63
NETWORK SECURITY: ENTERPRISE NETWORKING MARKET, BY REGION, 2018–2023 (USD MILLION)
TABLE 64
NETWORK SECURITY: ENTERPRISE NETWORKING MARKET, BY REGION, 2024–2029 (USD MILLION)
TABLE 65
NETWORK VIRTUALIZATION: ENTERPRISE NETWORKING MARKET, BY REGION, 2018–2023 (USD MILLION)
TABLE 66
NETWORK VIRTUALIZATION: ENTERPRISE NETWORKING MARKET, BY REGION, 2024–2029 (USD MILLION)
TABLE 67
NETWORK AUTOMATION: ENTERPRISE NETWORKING MARKET, BY REGION, 2018–2023 (USD MILLION)
TABLE 68
NETWORK AUTOMATION: ENTERPRISE NETWORKING MARKET, BY REGION, 2024–2029 (USD MILLION)
TABLE 69
OTHER NETWORKING SOFTWARE: ENTERPRISE NETWORKING MARKET, BY REGION, 2018–2023 (USD MILLION)
TABLE 70
OTHER NETWORKING SOFTWARE: ENTERPRISE NETWORKING MARKET, BY REGION, 2024–2029 (USD MILLION)
TABLE 71
SERVICES: ENTERPRISE NETWORKING MARKET, BY REGION, 2018–2023 (USD MILLION)
TABLE 72
SERVICES: ENTERPRISE NETWORKING MARKET, BY REGION, 2024–2029 (USD MILLION)
TABLE 73
SERVICES: ENTERPRISE NETWORKING MARKET, BY TYPE, 2018–2023 (USD MILLION)
TABLE 74
SERVICES: ENTERPRISE NETWORKING MARKET, BY TYPE, 2024–2029 (USD MILLION)
TABLE 75
PROFESSIONAL SERVICES: ENTERPRISE NETWORKING MARKET, BY REGION, 2018–2023 (USD MILLION)
TABLE 76
PROFESSIONAL SERVICES: ENTERPRISE NETWORKING MARKET, BY REGION, 2024–2029 (USD MILLION)
TABLE 77
PROFESSIONAL SERVICE: ENTERPRISE NETWORKING MARKET, BY TYPE, 2018–2023 (USD MILLION)
TABLE 78
PROFESSIONAL SERVICE: ENTERPRISE NETWORKING MARKET, BY TYPE, 2024–2029 (USD MILLION)
TABLE 79
CONSULTING: ENTERPRISE NETWORKING MARKET, BY REGION, 2018–2023 (USD MILLION)
TABLE 80
CONSULTING: ENTERPRISE NETWORKING MARKET, BY REGION, 2024–2029 (USD MILLION)
TABLE 81
DEPLOYMENT & INTEGRATION: ENTERPRISE NETWORKING MARKET, BY REGION, 2018–2023 (USD MILLION)
TABLE 82
DEPLOYMENT & INTEGRATION: ENTERPRISE NETWORKING MARKET, BY REGION, 2024–2029 (USD MILLION)
TABLE 83
SUPPORT & MAINTENANCE: ENTERPRISE NETWORKING MARKET, BY REGION, 2018–2023 (USD MILLION)
TABLE 84
SUPPORT & MAINTENANCE: ENTERPRISE NETWORKING MARKET, BY REGION, 2024–2029 (USD MILLION)
TABLE 85
MANAGED SERVICES: ENTERPRISE NETWORKING MARKET, BY REGION, 2018–2023 (USD MILLION)
TABLE 86
MANAGED SERVICES: ENTERPRISE NETWORKING MARKET, BY REGION, 2024–2029 (USD MILLION)
TABLE 87
ENTERPRISE NETWORKING MARKET, BY NETWORK, 2018–2023 (USD MILLION)
TABLE 88
ENTERPRISE NETWORKING MARKET, BY NETWORK, 2024–2029 (USD MILLION)
TABLE 89
CAMPUS NETWORK: ENTERPRISE NETWORKING MARKET, BY REGION, 2018–2023 (USD MILLION)
TABLE 90
CAMPUS NETWORK: ENTERPRISE NETWORKING MARKET, BY REGION, 2024–2029 (USD MILLION)
TABLE 91
DATA CENTER NETWORK: ENTERPRISE NETWORKING MARKET, BY REGION, 2018–2023 (USD MILLION)
TABLE 92
DATA CENTER NETWORK: ENTERPRISE NETWORKING MARKET, BY REGION, 2024–2029 (USD MILLION)
TABLE 93
BRANCH NETWORK: ENTERPRISE NETWORKING MARKET, BY REGION, 2018–2023 (USD MILLION)
TABLE 94
BRANCH NETWORK: ENTERPRISE NETWORKING MARKET, BY REGION, 2024–2029 (USD MILLION)
TABLE 95
REMOTE NETWORK: ENTERPRISE NETWORKING MARKET, BY REGION, 2018–2023 (USD MILLION)
TABLE 96
REMOTE NETWORK: ENTERPRISE NETWORKING MARKET, BY REGION, 2024–2029 (USD MILLION)
TABLE 97
ENTERPRISE NETWORKING MARKET, BY DEPLOYMENT MODE, 2018–2023 (USD MILLION)
TABLE 98
ENTERPRISE NETWORKING MARKET, BY DEPLOYMENT MODE, 2024–2029 (USD MILLION)
TABLE 99
DIY: ENTERPRISE NETWORKING MARKET, BY REGION, 2018–2023 (USD MILLION)
TABLE 100
DIY: ENTERPRISE NETWORKING MARKET, BY REGION, 2024–2029 (USD MILLION)
TABLE 101
MANAGED SD-WAN (TELCO OR MSP): ENTERPRISE NETWORKING MARKET, BY REGION, 2018–2023 (USD MILLION)
TABLE 102
MANAGED SD-WAN (TELCO OR MSP): ENTERPRISE NETWORKING MARKET, BY REGION, 2024–2029 (USD MILLION)
TABLE 103
SD-WAN AS A SERVICE (CLOUD-BASED): ENTERPRISE NETWORKING MARKET, BY REGION, 2018–2023 (USD MILLION)
TABLE 104
SD-WAN AS A SERVICE (CLOUD-BASED): ENTERPRISE NETWORKING MARKET, BY REGION, 2024–2029 (USD MILLION)
TABLE 105
ENTERPRISE NETWORKING MARKET, BY CONNECTION TYPE, 2018–2023 (USD MILLION)
TABLE 106
ENTERPRISE NETWORKING MARKET, BY CONNECTION TYPE, 2024–2029 (USD MILLION)
TABLE 107
WIRED: ENTERPRISE NETWORKING MARKET, BY REGION, 2018–2023 (USD MILLION)
TABLE 108
WIRED: ENTERPRISE NETWORKING MARKET, BY REGION, 2024–2029 (USD MILLION)
TABLE 109
WIRELESS: ENTERPRISE NETWORKING MARKET, BY REGION, 2018–2023 (USD MILLION)
TABLE 110
WIRELESS: ENTERPRISE NETWORKING MARKET, BY REGION, 2024–2029 (USD MILLION)
TABLE 111
ENTERPRISE NETWORKING MARKET, BY END USER, 2018–2023 (USD MILLION)
TABLE 112
ENTERPRISE NETWORKING MARKET, BY END USER, 2024–2029 (USD MILLION)
TABLE 113
ENTERPRISE NETWORKING MARKET, BY SERVICE PROVIDER, 2018–2023 (USD MILLION)
TABLE 114
ENTERPRISE NETWORKING MARKET, BY SERVICE PROVIDER, 2024–2029 (USD MILLION)
TABLE 115
CLOUD SERVICE PROVIDERS: ENTERPRISE NETWORKING MARKET, BY REGION, 2018–2023 (USD MILLION)
TABLE 116
CLOUD SERVICE PROVIDERS: ENTERPRISE NETWORKING MARKET, BY REGION, 2024–2029 (USD MILLION)
TABLE 117
TELECOM SERVICE PROVIDERS: ENTERPRISE NETWORKING MARKET, BY REGION, 2018–2023 (USD MILLION)
TABLE 118
TELECOM SERVICE PROVIDERS: ENTERPRISE NETWORKING MARKET, BY REGION, 2024–2029 (USD MILLION)
TABLE 119
ENTERPRISES: ENTERPRISE NETWORKING MARKET, BY REGION, 2018–2023 (USD MILLION)
TABLE 120
ENTERPRISES: ENTERPRISE NETWORKING MARKET, BY REGION, 2024–2029 (USD MILLION)
TABLE 121
ENTERPRISE NETWORKING MARKET, BY ENTERPRISE, 2018–2023 (USD MILLION)
TABLE 122
ENTERPRISE NETWORKING MARKET, BY ENTERPRISE, 2024–2029 (USD MILLION)
TABLE 123
IT & ITES: ENTERPRISE NETWORKING MARKET, BY REGION, 2018–2023 (USD MILLION)
TABLE 124
IT & ITES: ENTERPRISE NETWORKING MARKET, BY REGION, 2024–2029 (USD MILLION)
TABLE 125
BFSI: ENTERPRISE NETWORKING MARKET, BY REGION, 2018–2023 (USD MILLION)
TABLE 126
BFSI: ENTERPRISE NETWORKING MARKET, BY REGION, 2024–2029 (USD MILLION)
TABLE 127
HEALTHCARE & LIFE SCIENCES: ENTERPRISE NETWORKING MARKET, BY REGION, 2018–2023 (USD MILLION)
TABLE 128
HEALTHCARE & LIFE SCIENCES: ENTERPRISE NETWORKING MARKET, BY REGION, 2024–2029 (USD MILLION)
TABLE 129
MANUFACTURING: ENTERPRISE NETWORKING MARKET, BY REGION, 2018–2023 (USD MILLION)
TABLE 130
MANUFACTURING: ENTERPRISE NETWORKING MARKET, BY REGION, 2024–2029 (USD MILLION)
TABLE 131
TRANSPORTATION & LOGISTICS: ENTERPRISE NETWORKING MARKET, BY REGION, 2018–2023 (USD MILLION)
TABLE 132
TRANSPORTATION & LOGISTICS: ENTERPRISE NETWORKING MARKET, BY REGION, 2024–2029 (USD MILLION)
TABLE 133
EDUCATION: ENTERPRISE NETWORKING MARKET, BY REGION, 2018–2023 (USD MILLION)
TABLE 134
EDUCATION: ENTERPRISE NETWORKING MARKET, BY REGION, 2024–2029 (USD MILLION)
TABLE 135
RETAIL & E-COMMERCE: ENTERPRISE NETWORKING MARKET, BY REGION, 2018–2023 (USD MILLION)
TABLE 136
RETAIL & E-COMMERCE: ENTERPRISE NETWORKING MARKET, BY REGION, 2024–2029 (USD MILLION)
TABLE 137
GOVERNMENT: ENTERPRISE NETWORKING MARKET, BY REGION, 2018–2023 (USD MILLION)
TABLE 138
GOVERNMENT: ENTERPRISE NETWORKING MARKET, BY REGION, 2024–2029 (USD MILLION)
TABLE 139
MEDIA & ENTERTAINMENT: ENTERPRISE NETWORKING MARKET, BY REGION, 2018–2023 (USD MILLION)
TABLE 140
MEDIA & ENTERTAINMENT: ENTERPRISE NETWORKING MARKET, BY REGION, 2024–2029 (USD MILLION)
TABLE 141
OTHER ENTERPRISES: ENTERPRISE NETWORKING MARKET, BY REGION, 2018–2023 (USD MILLION)
TABLE 142
OTHER ENTERPRISES: ENTERPRISE NETWORKING MARKET, BY REGION, 2024–2029 (USD MILLION)
TABLE 143
ENTERPRISE NETWORKING MARKET, BY REGION, 2018–2023 (USD MILLION)
TABLE 144
ENTERPRISE NETWORKING MARKET, BY REGION, 2024–2029 (USD MILLION)
TABLE 145
NORTH AMERICA: ENTERPRISE NETWORKING MARKET, BY OFFERING, 2018–2023 (USD MILLION)
TABLE 146
NORTH AMERICA: ENTERPRISE NETWORKING MARKET, BY OFFERING, 2024–2029 (USD MILLION)
TABLE 147
NORTH AMERICA: ENTERPRISE NETWORKING MARKET, BY NETWORKING DEVICE, 2018–2023 (USD MILLION)
TABLE 148
NORTH AMERICA: ENTERPRISE NETWORKING MARKET, BY NETWORKING DEVICE, 2024–2029 (USD MILLION)
TABLE 149
NORTH AMERICA: ENTERPRISE NETWORKING MARKET, BY SWITCH TYPE, 2018–2023 (USD MILLION)
TABLE 150
NORTH AMERICA: ENTERPRISE NETWORKING MARKET, BY SWITCH TYPE, 2024–2029 (USD MILLION)
TABLE 151
NORTH AMERICA: ENTERPRISE NETWORKING MARKET, BY FIXED SWITCH TYPE, 2018–2023 (USD MILLION)
TABLE 152
NORTH AMERICA: ENTERPRISE NETWORKING MARKET, BY FIXED SWITCH TYPE, 2024–2029 (USD MILLION)
TABLE 153
NORTH AMERICA: ENTERPRISE NETWORKING MARKET, BY SWITCH SPEED, 2018–2023 (USD MILLION)
TABLE 154
NORTH AMERICA: ENTERPRISE NETWORKING MARKET, BY SWITCH SPEED, 2024–2029 (USD MILLION)
TABLE 155
NORTH AMERICA: ENTERPRISE NETWORKING MARKET, BY NETWORKING SOFTWARE, 2018–2023 (USD MILLION)
TABLE 156
NORTH AMERICA: ENTERPRISE NETWORKING MARKET, BY NETWORKING SOFTWARE, 2024–2029 (USD MILLION)
TABLE 157
NORTH AMERICA: ENTERPRISE NETWORKING MARKET, BY SERVICE, 2018–2023 (USD MILLION)
TABLE 158
NORTH AMERICA: ENTERPRISE NETWORKING MARKET, BY SERVICE, 2024–2029 (USD MILLION)
TABLE 159
NORTH AMERICA: ENTERPRISE NETWORKING MARKET, BY PROFESSIONAL SERVICE, 2018–2023 (USD MILLION)
TABLE 160
NORTH AMERICA: ENTERPRISE NETWORKING MARKET, BY PROFESSIONAL SERVICE, 2024–2029 (USD MILLION)
TABLE 161
NORTH AMERICA: ENTERPRISE NETWORKING MARKET, BY CONNECTION TYPE, 2018–2023 (USD MILLION)
TABLE 162
NORTH AMERICA: ENTERPRISE NETWORKING MARKET, BY CONNECTION TYPE, 2024–2029 (USD MILLION)
TABLE 163
NORTH AMERICA: ENTERPRISE NETWORKING MARKET, BY DEPLOYMENT MODE, 2018–2023 (USD MILLION)
TABLE 164
NORTH AMERICA: ENTERPRISE NETWORKING MARKET, BY DEPLOYMENT MODE, 2024–2029 (USD MILLION)
TABLE 165
NORTH AMERICA: ENTERPRISE NETWORKING MARKET, BY NETWORK, 2018–2023 (USD MILLION)
TABLE 166
NORTH AMERICA: ENTERPRISE NETWORKING MARKET, BY NETWORK, 2024–2029 (USD MILLION)
TABLE 167
NORTH AMERICA: ENTERPRISE NETWORKING MARKET, BY END USER, 2018–2023 (USD MILLION)
TABLE 168
NORTH AMERICA: ENTERPRISE NETWORKING MARKET, BY END USER, 2024–2029 (USD MILLION)
TABLE 169
NORTH AMERICA: ENTERPRISE NETWORKING MARKET, BY SERVICE PROVIDER, 2018–2023 (USD MILLION)
TABLE 170
NORTH AMERICA: ENTERPRISE NETWORKING MARKET, BY SERVICE PROVIDER, 2024–2029 (USD MILLION)
TABLE 171
NORTH AMERICA: ENTERPRISE NETWORKING MARKET, BY ENTERPRISE, 2018–2023 (USD MILLION)
TABLE 172
NORTH AMERICA: ENTERPRISE NETWORKING MARKET, BY ENTERPRISE, 2024–2029 (USD MILLION)
TABLE 173
NORTH AMERICA: ENTERPRISE NETWORKING MARKET, BY COUNTRY, 2018–2023 (USD MILLION)
TABLE 174
NORTH AMERICA: ENTERPRISE NETWORKING MARKET, BY COUNTRY, 2024–2029 (USD MILLION)
TABLE 175
US: ENTERPRISE NETWORKING MARKET, BY OFFERING, 2018–2023 (USD MILLION)
TABLE 176
US: ENTERPRISE NETWORKING MARKET, BY OFFERING, 2024–2029 (USD MILLION)
TABLE 177
US: ENTERPRISE NETWORKING MARKET, BY NETWORKING DEVICE, 2018–2023 (USD MILLION)
TABLE 178
US: ENTERPRISE NETWORKING MARKET, BY NETWORKING DEVICE, 2024–2029 (USD MILLION)
TABLE 179
US: ENTERPRISE NETWORKING MARKET, BY SWITCH TYPE, 2018–2023 (USD MILLION)
TABLE 180
US: ENTERPRISE NETWORKING MARKET, BY SWITCH TYPE, 2024–2029 (USD MILLION)
TABLE 181
US: ENTERPRISE NETWORKING MARKET, BY FIXED SWITCH TYPE, 2018–2023 (USD MILLION)
TABLE 182
US: ENTERPRISE NETWORKING MARKET, BY FIXED SWITCH TYPE, 2024–2029 (USD MILLION)
TABLE 183
US: ENTERPRISE NETWORKING MARKET, BY SWITCH SPEED, 2018–2023 (USD MILLION)
TABLE 184
US: ENTERPRISE NETWORKING MARKET, BY SWITCH SPEED, 2024–2029 (USD MILLION)
TABLE 185
US: ENTERPRISE NETWORKING MARKET, BY NETWORKING SOFTWARE, 2018–2023 (USD MILLION)
TABLE 186
US: ENTERPRISE NETWORKING MARKET, BY NETWORKING SOFTWARE, 2024–2029 (USD MILLION)
TABLE 187
US: ENTERPRISE NETWORKING MARKET, BY SERVICE, 2018–2023 (USD MILLION)
TABLE 188
US: ENTERPRISE NETWORKING MARKET, BY SERVICE, 2024–2029 (USD MILLION)
TABLE 189
US: ENTERPRISE NETWORKING MARKET, BY PROFESSIONAL SERVICE, 2018–2023 (USD MILLION)
TABLE 190
US: ENTERPRISE NETWORKING MARKET, BY PROFESSIONAL SERVICE, 2024–2029 (USD MILLION)
TABLE 191
US: ENTERPRISE NETWORKING MARKET, BY CONNECTION TYPE, 2018–2023 (USD MILLION)
TABLE 192
US: ENTERPRISE NETWORKING MARKET, BY CONNECTION TYPE, 2024–2029 (USD MILLION)
TABLE 193
US: ENTERPRISE NETWORKING MARKET, BY DEPLOYMENT MODE, 2018–2023 (USD MILLION)
TABLE 194
US: ENTERPRISE NETWORKING MARKET, BY DEPLOYMENT MODE, 2024–2029 (USD MILLION)
TABLE 195
US: ENTERPRISE NETWORKING MARKET, BY NETWORK, 2018–2023 (USD MILLION)
TABLE 196
US: ENTERPRISE NETWORKING MARKET, BY NETWORK, 2024–2029 (USD MILLION)
TABLE 197
US: ENTERPRISE NETWORKING MARKET, BY END USER, 2018–2023 (USD MILLION)
TABLE 198
US: ENTERPRISE NETWORKING MARKET, BY END USER, 2024–2029 (USD MILLION)
TABLE 199
US: ENTERPRISE NETWORKING MARKET, BY SERVICE PROVIDER, 2018–2023 (USD MILLION)
TABLE 200
US: ENTERPRISE NETWORKING MARKET, BY SERVICE PROVIDER, 2024–2029 (USD MILLION)
TABLE 201
US: ENTERPRISE NETWORKING MARKET, BY ENTERPRISE, 2018–2023 (USD MILLION)
TABLE 202
US: ENTERPRISE NETWORKING MARKET, BY ENTERPRISE, 2024–2029 (USD MILLION)
TABLE 203
CANADA: ENTERPRISE NETWORKING MARKET, BY OFFERING, 2018–2023 (USD MILLION)
TABLE 204
CANADA: ENTERPRISE NETWORKING MARKET, BY OFFERING, 2024–2029 (USD MILLION)
TABLE 205
CANADA: ENTERPRISE NETWORKING MARKET, BY NETWORKING DEVICE, 2018–2023 (USD MILLION)
TABLE 206
CANADA: ENTERPRISE NETWORKING MARKET, BY NETWORKING DEVICE, 2024–2029 (USD MILLION)
TABLE 207
CANADA: ENTERPRISE NETWORKING MARKET, BY SWITCH TYPE, 2018–2023 (USD MILLION)
TABLE 208
CANADA: ENTERPRISE NETWORKING MARKET, BY SWITCH TYPE, 2024–2029 (USD MILLION)
TABLE 209
CANADA: ENTERPRISE NETWORKING MARKET, BY FIXED SWITCH TYPE, 2018–2023 (USD MILLION)
TABLE 210
CANADA: ENTERPRISE NETWORKING MARKET, BY FIXED SWITCH TYPE, 2024–2029 (USD MILLION)
TABLE 211
CANADA: ENTERPRISE NETWORKING MARKET, BY SWITCH SPEED, 2018–2023 (USD MILLION)
TABLE 212
CANADA: ENTERPRISE NETWORKING MARKET, BY SWITCH SPEED, 2024–2029 (USD MILLION)
TABLE 213
CANADA: ENTERPRISE NETWORKING MARKET, BY NETWORKING SOFTWARE, 2018–2023 (USD MILLION)
TABLE 214
CANADA: ENTERPRISE NETWORKING MARKET, BY NETWORKING SOFTWARE, 2024–2029 (USD MILLION)
TABLE 215
CANADA: ENTERPRISE NETWORKING MARKET, BY SERVICE, 2018–2023 (USD MILLION)
TABLE 216
CANADA: ENTERPRISE NETWORKING MARKET, BY SERVICE, 2024–2029 (USD MILLION)
TABLE 217
CANADA: ENTERPRISE NETWORKING MARKET, BY PROFESSIONAL SERVICE, 2018–2023 (USD MILLION)
TABLE 218
CANADA: ENTERPRISE NETWORKING MARKET, BY PROFESSIONAL SERVICE, 2024–2029 (USD MILLION)
TABLE 219
CANADA: ENTERPRISE NETWORKING MARKET, BY CONNECTION TYPE, 2018–2023 (USD MILLION)
TABLE 220
CANADA: ENTERPRISE NETWORKING MARKET, BY CONNECTION TYPE, 2024–2029 (USD MILLION)
TABLE 221
CANADA: ENTERPRISE NETWORKING MARKET, BY DEPLOYMENT MODE, 2018–2023 (USD MILLION)
TABLE 222
CANADA: ENTERPRISE NETWORKING MARKET, BY DEPLOYMENT MODE, 2024–2029 (USD MILLION)
TABLE 223
CANADA: ENTERPRISE NETWORKING MARKET, BY NETWORK, 2018–2023 (USD MILLION)
TABLE 224
CANADA: ENTERPRISE NETWORKING MARKET, BY NETWORK, 2024–2029 (USD MILLION)
TABLE 225
CANADA: ENTERPRISE NETWORKING MARKET, BY END USER, 2018–2023 (USD MILLION)
TABLE 226
CANADA: ENTERPRISE NETWORKING MARKET, BY END USER, 2024–2029 (USD MILLION)
TABLE 227
CANADA: ENTERPRISE NETWORKING MARKET, BY SERVICE PROVIDER, 2018–2023 (USD MILLION)
TABLE 228
CANADA: ENTERPRISE NETWORKING MARKET, BY SERVICE PROVIDER, 2024–2029 (USD MILLION)
TABLE 229
CANADA: ENTERPRISE NETWORKING MARKET, BY ENTERPRISE, 2018–2023 (USD MILLION)
TABLE 230
CANADA: ENTERPRISE NETWORKING MARKET, BY ENTERPRISE, 2024–2029 (USD MILLION)
TABLE 231
EUROPE: ENTERPRISE NETWORKING MARKET, BY OFFERING, 2018–2023 (USD MILLION)
TABLE 232
EUROPE: ENTERPRISE NETWORKING MARKET, BY OFFERING, 2024–2029 (USD MILLION)
TABLE 233
EUROPE: ENTERPRISE NETWORKING MARKET, BY NETWORKING DEVICE, 2018–2023 (USD MILLION)
TABLE 234
EUROPE: ENTERPRISE NETWORKING MARKET, BY NETWORKING DEVICE, 2024–2029 (USD MILLION)
TABLE 235
EUROPE: ENTERPRISE NETWORKING MARKET, BY SWITCH TYPE, 2018–2023 (USD MILLION)
TABLE 236
EUROPE: ENTERPRISE NETWORKING MARKET, BY SWITCH TYPE, 2024–2029 (USD MILLION)
TABLE 237
EUROPE: ENTERPRISE NETWORKING MARKET, BY FIXED SWITCH TYPE, 2018–2023 (USD MILLION)
TABLE 238
EUROPE: ENTERPRISE NETWORKING MARKET, BY FIXED SWITCH TYPE, 2024–2029 (USD MILLION)
TABLE 239
EUROPE: ENTERPRISE NETWORKING MARKET, BY SWITCH SPEED, 2018–2023 (USD MILLION)
TABLE 240
EUROPE: ENTERPRISE NETWORKING MARKET, BY SWITCH SPEED, 2024–2029 (USD MILLION)
TABLE 241
EUROPE: ENTERPRISE NETWORKING MARKET, BY NETWORKING SOFTWARE, 2018–2023 (USD MILLION)
TABLE 242
EUROPE: ENTERPRISE NETWORKING MARKET, BY NETWORKING SOFTWARE, 2024–2029 (USD MILLION)
TABLE 243
EUROPE: ENTERPRISE NETWORKING MARKET, BY SERVICE, 2018–2023 (USD MILLION)
TABLE 244
EUROPE: ENTERPRISE NETWORKING MARKET, BY SERVICE, 2024–2029 (USD MILLION)
TABLE 245
EUROPE: ENTERPRISE NETWORKING MARKET, BY PROFESSIONAL SERVICE, 2018–2023 (USD MILLION)
TABLE 246
EUROPE: ENTERPRISE NETWORKING MARKET, BY PROFESSIONAL SERVICE, 2024–2029 (USD MILLION)
TABLE 247
EUROPE: ENTERPRISE NETWORKING MARKET, BY CONNECTION TYPE, 2018–2023 (USD MILLION)
TABLE 248
EUROPE: ENTERPRISE NETWORKING MARKET, BY CONNECTION TYPE, 2024–2029 (USD MILLION)
TABLE 249
EUROPE: ENTERPRISE NETWORKING MARKET, BY DEPLOYMENT MODE, 2018–2023 (USD MILLION)
TABLE 250
EUROPE: ENTERPRISE NETWORKING MARKET, BY DEPLOYMENT MODE, 2024–2029 (USD MILLION)
TABLE 251
EUROPE: ENTERPRISE NETWORKING MARKET, BY NETWORK, 2018–2023 (USD MILLION)
TABLE 252
EUROPE: ENTERPRISE NETWORKING MARKET, BY NETWORK, 2024–2029 (USD MILLION)
TABLE 253
EUROPE: ENTERPRISE NETWORKING MARKET, BY END USER, 2018–2023 (USD MILLION)
TABLE 254
EUROPE: ENTERPRISE NETWORKING MARKET, BY END USER, 2024–2029 (USD MILLION)
TABLE 255
EUROPE: ENTERPRISE NETWORKING MARKET, BY SERVICE PROVIDER, 2018–2023 (USD MILLION)
TABLE 256
EUROPE: ENTERPRISE NETWORKING MARKET, BY SERVICE PROVIDER, 2024–2029 (USD MILLION)
TABLE 257
EUROPE: ENTERPRISE NETWORKING MARKET, BY ENTERPRISE, 2018–2023 (USD MILLION)
TABLE 258
EUROPE: ENTERPRISE NETWORKING MARKET, BY ENTERPRISE, 2024–2029 (USD MILLION)
TABLE 259
EUROPE: ENTERPRISE NETWORKING MARKET, BY COUNTRY/SUBREGION, 2018–2023 (USD MILLION)
TABLE 260
EUROPE: ENTERPRISE NETWORKING MARKET, BY COUNTRY/SUBREGION, 2024–2029 (USD MILLION)
TABLE 261
UK: ENTERPRISE NETWORKING MARKET, BY OFFERING, 2018–2023 (USD MILLION)
TABLE 262
UK: ENTERPRISE NETWORKING MARKET, BY OFFERING, 2024–2029 (USD MILLION)
TABLE 263
UK: ENTERPRISE NETWORKING MARKET, BY NETWORKING DEVICE, 2018–2023 (USD MILLION)
TABLE 264
UK: ENTERPRISE NETWORKING MARKET, BY NETWORKING DEVICE, 2024–2029 (USD MILLION)
TABLE 265
UK: ENTERPRISE NETWORKING MARKET, BY SWITCH TYPE, 2018–2023 (USD MILLION)
TABLE 266
UK: ENTERPRISE NETWORKING MARKET, BY SWITCH TYPE, 2024–2029 (USD MILLION)
TABLE 267
UK: ENTERPRISE NETWORKING MARKET, BY FIXED SWITCH TYPE, 2018–2023 (USD MILLION)
TABLE 268
UK: ENTERPRISE NETWORKING MARKET, BY FIXED SWITCH TYPE, 2024–2029 (USD MILLION)
TABLE 269
UK: ENTERPRISE NETWORKING MARKET, BY SWITCH SPEED, 2018–2023 (USD MILLION)
TABLE 270
UK: ENTERPRISE NETWORKING MARKET, BY SWITCH SPEED, 2024–2029 (USD MILLION)
TABLE 271
UK: ENTERPRISE NETWORKING MARKET, BY NETWORKING SOFTWARE, 2018–2023 (USD MILLION)
TABLE 272
UK: ENTERPRISE NETWORKING MARKET, BY NETWORKING SOFTWARE, 2024–2029 (USD MILLION)
TABLE 273
UK: ENTERPRISE NETWORKING MARKET, BY SERVICE, 2018–2023 (USD MILLION)
TABLE 274
UK: ENTERPRISE NETWORKING MARKET, BY SERVICE, 2024–2029 (USD MILLION)
TABLE 275
UK: ENTERPRISE NETWORKING MARKET, BY PROFESSIONAL SERVICE, 2018–2023 (USD MILLION)
TABLE 276
UK: ENTERPRISE NETWORKING MARKET, BY PROFESSIONAL SERVICE, 2024–2029 (USD MILLION)
TABLE 277
UK: ENTERPRISE NETWORKING MARKET, BY CONNECTION TYPE, 2018–2023 (USD MILLION)
TABLE 278
UK: ENTERPRISE NETWORKING MARKET, BY CONNECTION TYPE, 2024–2029 (USD MILLION)
TABLE 279
UK: ENTERPRISE NETWORKING MARKET, BY DEPLOYMENT MODE, 2018–2023 (USD MILLION)
TABLE 280
UK: ENTERPRISE NETWORKING MARKET, BY DEPLOYMENT MODE, 2024–2029 (USD MILLION)
TABLE 281
UK: ENTERPRISE NETWORKING MARKET, BY NETWORK, 2018–2023 (USD MILLION)
TABLE 282
UK: ENTERPRISE NETWORKING MARKET, BY NETWORK, 2024–2029 (USD MILLION)
TABLE 283
UK: ENTERPRISE NETWORKING MARKET, BY END USER, 2018–2023 (USD MILLION)
TABLE 284
UK: ENTERPRISE NETWORKING MARKET, BY END USER, 2024–2029 (USD MILLION)
TABLE 285
UK: ENTERPRISE NETWORKING MARKET, BY SERVICE PROVIDER, 2018–2023 (USD MILLION)
TABLE 286
UK: ENTERPRISE NETWORKING MARKET, BY SERVICE PROVIDER, 2024–2029 (USD MILLION)
TABLE 287
UK: ENTERPRISE NETWORKING MARKET, BY ENTERPRISE, 2018–2023 (USD MILLION)
TABLE 288
UK: ENTERPRISE NETWORKING MARKET, BY ENTERPRISE, 2024–2029 (USD MILLION)
TABLE 289
ASIA PACIFIC: ENTERPRISE NETWORKING MARKET, BY OFFERING, 2018–2023 (USD MILLION)
TABLE 290
ASIA PACIFIC: ENTERPRISE NETWORKING MARKET, BY OFFERING, 2024–2029 (USD MILLION)
TABLE 291
ASIA PACIFIC: ENTERPRISE NETWORKING MARKET, BY NETWORKING DEVICE, 2018–2023 (USD MILLION)
TABLE 292
ASIA PACIFIC: ENTERPRISE NETWORKING MARKET, BY NETWORKING DEVICE, 2024–2029 (USD MILLION)
TABLE 293
ASIA PACIFIC: ENTERPRISE NETWORKING MARKET, BY SWITCH TYPE, 2018–2023 (USD MILLION)
TABLE 294
ASIA PACIFIC: ENTERPRISE NETWORKING MARKET, BY SWITCH TYPE, 2024–2029 (USD MILLION)
TABLE 295
ASIA PACIFIC: ENTERPRISE NETWORKING MARKET, BY FIXED SWITCH TYPE, 2018–2023 (USD MILLION)
TABLE 296
ASIA PACIFIC: ENTERPRISE NETWORKING MARKET, BY FIXED SWITCH TYPE, 2024–2029 (USD MILLION)
TABLE 297
ASIA PACIFIC: ENTERPRISE NETWORKING MARKET, BY SWITCH SPEED, 2018–2023 (USD MILLION)
TABLE 298
ASIA PACIFIC: ENTERPRISE NETWORKING MARKET, BY SWITCH SPEED, 2024–2029 (USD MILLION)
TABLE 299
ASIA PACIFIC: ENTERPRISE NETWORKING MARKET, BY NETWORKING SOFTWARE, 2018–2023 (USD MILLION)
TABLE 300
ASIA PACIFIC: ENTERPRISE NETWORKING MARKET, BY NETWORKING SOFTWARE, 2024–2029 (USD MILLION)
TABLE 301
ASIA PACIFIC: ENTERPRISE NETWORKING MARKET, BY SERVICE, 2018–2023 (USD MILLION)
TABLE 302
ASIA PACIFIC: ENTERPRISE NETWORKING MARKET, BY SERVICE, 2024–2029 (USD MILLION)
TABLE 303
ASIA PACIFIC: ENTERPRISE NETWORKING MARKET, BY PROFESSIONAL SERVICE, 2018–2023 (USD MILLION)
TABLE 304
ASIA PACIFIC: ENTERPRISE NETWORKING MARKET, BY PROFESSIONAL SERVICE, 2024–2029 (USD MILLION)
TABLE 305
ASIA PACIFIC: ENTERPRISE NETWORKING MARKET, BY CONNECTION TYPE, 2018–2023 (USD MILLION)
TABLE 306
ASIA PACIFIC: ENTERPRISE NETWORKING MARKET, BY CONNECTION TYPE, 2024–2029 (USD MILLION)
TABLE 307
ASIA PACIFIC: ENTERPRISE NETWORKING MARKET, BY DEPLOYMENT MODE, 2018–2023 (USD MILLION)
TABLE 308
ASIA PACIFIC: ENTERPRISE NETWORKING MARKET, BY DEPLOYMENT MODE, 2024–2029 (USD MILLION)
TABLE 309
ASIA PACIFIC: ENTERPRISE NETWORKING MARKET, BY NETWORK, 2018–2023 (USD MILLION)
TABLE 310
ASIA PACIFIC: ENTERPRISE NETWORKING MARKET, BY NETWORK, 2024–2029 (USD MILLION)
TABLE 311
ASIA PACIFIC: ENTERPRISE NETWORKING MARKET, BY END USER, 2018–2023 (USD MILLION)
TABLE 312
ASIA PACIFIC: ENTERPRISE NETWORKING MARKET, BY END USER, 2024–2029 (USD MILLION)
TABLE 313
ASIA PACIFIC: ENTERPRISE NETWORKING MARKET, BY SERVICE PROVIDER, 2018–2023 (USD MILLION)
TABLE 314
ASIA PACIFIC: ENTERPRISE NETWORKING MARKET, BY SERVICE PROVIDER, 2024–2029 (USD MILLION)
TABLE 315
ASIA PACIFIC: ENTERPRISE NETWORKING MARKET, BY ENTERPRISE, 2018–2023 (USD MILLION)
TABLE 316
ASIA PACIFIC: ENTERPRISE NETWORKING MARKET, BY ENTERPRISE, 2024–2029 (USD MILLION)
TABLE 317
CHINA: ENTERPRISE NETWORKING MARKET, BY OFFERING, 2018–2023 (USD MILLION)
TABLE 318
CHINA: ENTERPRISE NETWORKING MARKET, BY OFFERING, 2024–2029 (USD MILLION)
TABLE 319
CHINA: ENTERPRISE NETWORKING MARKET, BY NETWORKING DEVICE, 2018–2023 (USD MILLION)
TABLE 320
CHINA: ENTERPRISE NETWORKING MARKET, BY NETWORKING DEVICE, 2024–2029 (USD MILLION)
TABLE 321
CHINA: ENTERPRISE NETWORKING MARKET, BY SWITCH TYPE, 2018–2023 (USD MILLION)
TABLE 322
CHINA: ENTERPRISE NETWORKING MARKET, BY SWITCH TYPE, 2024–2029 (USD MILLION)
TABLE 323
CHINA: ENTERPRISE NETWORKING MARKET, BY FIXED SWITCH TYPE, 2018–2023 (USD MILLION)
TABLE 324
CHINA: ENTERPRISE NETWORKING MARKET, BY FIXED SWITCH TYPE, 2024–2029 (USD MILLION)
TABLE 325
CHINA: ENTERPRISE NETWORKING MARKET, BY SWITCH SPEED, 2018–2023 (USD MILLION)
TABLE 326
CHINA: ENTERPRISE NETWORKING MARKET, BY SWITCH SPEED, 2024–2029 (USD MILLION)
TABLE 327
CHINA: ENTERPRISE NETWORKING MARKET, BY NETWORKING SOFTWARE, 2018–2023 (USD MILLION)
TABLE 328
CHINA: ENTERPRISE NETWORKING MARKET, BY NETWORKING SOFTWARE, 2024–2029 (USD MILLION)
TABLE 329
CHINA: ENTERPRISE NETWORKING MARKET, BY SERVICE, 2018–2023 (USD MILLION)
TABLE 330
CHINA: ENTERPRISE NETWORKING MARKET, BY SERVICE, 2024–2029 (USD MILLION)
TABLE 331
CHINA: ENTERPRISE NETWORKING MARKET, BY PROFESSIONAL SERVICE, 2018–2023 (USD MILLION)
TABLE 332
CHINA: ENTERPRISE NETWORKING MARKET, BY PROFESSIONAL SERVICE, 2024–2029 (USD MILLION)
TABLE 333
CHINA: ENTERPRISE NETWORKING MARKET, BY CONNECTION TYPE, 2018–2023 (USD MILLION)
TABLE 334
CHINA: ENTERPRISE NETWORKING MARKET, BY CONNECTION TYPE, 2024–2029 (USD MILLION)
TABLE 335
CHINA: ENTERPRISE NETWORKING MARKET, BY DEPLOYMENT MODE, 2018–2023 (USD MILLION)
TABLE 336
CHINA: ENTERPRISE NETWORKING MARKET, BY DEPLOYMENT MODE, 2024–2029 (USD MILLION)
TABLE 337
CHINA: ENTERPRISE NETWORKING MARKET, BY NETWORK, 2018–2023 (USD MILLION)
TABLE 338
CHINA: ENTERPRISE NETWORKING MARKET, BY NETWORK, 2024–2029 (USD MILLION)
TABLE 339
CHINA: ENTERPRISE NETWORKING MARKET, BY END USER, 2018–2023 (USD MILLION)
TABLE 340
CHINA: ENTERPRISE NETWORKING MARKET, BY END USER, 2024–2029 (USD MILLION)
TABLE 341
CHINA: ENTERPRISE NETWORKING MARKET, BY SERVICE PROVIDER, 2018–2023 (USD MILLION)
TABLE 342
CHINA: ENTERPRISE NETWORKING MARKET, BY SERVICE PROVIDER, 2024–2029 (USD MILLION)
TABLE 343
CHINA: ENTERPRISE NETWORKING MARKET, BY ENTERPRISE, 2018–2023 (USD MILLION)
TABLE 344
CHINA: ENTERPRISE NETWORKING MARKET, BY ENTERPRISE, 2024–2029 (USD MILLION)
TABLE 345
MIDDLE EAST & AFRICA: ENTERPRISE NETWORKING MARKET, BY OFFERING, 2018–2023 (USD MILLION)
TABLE 346
MIDDLE EAST & AFRICA: ENTERPRISE NETWORKING MARKET, BY OFFERING, 2024–2029 (USD MILLION)
TABLE 347
MIDDLE EAST & AFRICA: ENTERPRISE NETWORKING MARKET, BY NETWORKING DEVICE, 2018–2023 (USD MILLION)
TABLE 348
MIDDLE EAST & AFRICA: ENTERPRISE NETWORKING MARKET, BY NETWORKING DEVICE, 2024–2029 (USD MILLION)
TABLE 349
MIDDLE EAST & AFRICA: ENTERPRISE NETWORKING MARKET, BY SWITCH TYPE, 2018–2023 (USD MILLION)
TABLE 350
MIDDLE EAST & AFRICA: ENTERPRISE NETWORKING MARKET, BY SWITCH TYPE, 2024–2029 (USD MILLION)
TABLE 351
MIDDLE EAST & AFRICA: ENTERPRISE NETWORKING MARKET, BY FIXED SWITCH TYPE, 2018–2023 (USD MILLION)
TABLE 352
MIDDLE EAST & AFRICA: ENTERPRISE NETWORKING MARKET, BY FIXED SWITCH TYPE, 2024–2029 (USD MILLION)
TABLE 353
MIDDLE EAST & AFRICA: ENTERPRISE NETWORKING MARKET, BY SWITCH SPEED, 2018–2023 (USD MILLION)
TABLE 354
MIDDLE EAST & AFRICA: ENTERPRISE NETWORKING MARKET, BY SWITCH SPEED, 2024–2029 (USD MILLION)
TABLE 355
MIDDLE EAST & AFRICA: ENTERPRISE NETWORKING MARKET, BY NETWORKING SOFTWARE, 2018–2023 (USD MILLION)
TABLE 356
MIDDLE EAST & AFRICA: ENTERPRISE NETWORKING MARKET, BY NETWORKING SOFTWARE, 2024–2029 (USD MILLION)
TABLE 357
MIDDLE EAST & AFRICA: ENTERPRISE NETWORKING MARKET, BY SERVICE, 2018–2023 (USD MILLION)
TABLE 358
MIDDLE EAST & AFRICA: ENTERPRISE NETWORKING MARKET, BY SERVICE, 2024–2029 (USD MILLION)
TABLE 359
MIDDLE EAST & AFRICA: ENTERPRISE NETWORKING MARKET, BY PROFESSIONAL SERVICE, 2018–2023 (USD MILLION)
TABLE 360
MIDDLE EAST & AFRICA: ENTERPRISE NETWORKING MARKET, BY PROFESSIONAL SERVICE, 2024–2029 (USD MILLION)
TABLE 361
MIDDLE EAST & AFRICA: ENTERPRISE NETWORKING MARKET, BY CONNECTION TYPE, 2018–2023 (USD MILLION)
TABLE 362
MIDDLE EAST & AFRICA: ENTERPRISE NETWORKING MARKET, BY CONNECTION TYPE, 2024–2029 (USD MILLION)
TABLE 363
MIDDLE EAST & AFRICA: ENTERPRISE NETWORKING MARKET, BY DEPLOYMENT MODE, 2018–2023 (USD MILLION)
TABLE 364
MIDDLE EAST & AFRICA: ENTERPRISE NETWORKING MARKET, BY DEPLOYMENT MODE, 2024–2029 (USD MILLION)
TABLE 365
MIDDLE EAST & AFRICA: ENTERPRISE NETWORKING MARKET, BY NETWORK, 2018–2023 (USD MILLION)
TABLE 366
MIDDLE EAST & AFRICA: ENTERPRISE NETWORKING MARKET, BY NETWORK, 2024–2029 (USD MILLION)
TABLE 367
MIDDLE EAST & AFRICA: ENTERPRISE NETWORKING MARKET, BY END USER, 2018–2023 (USD MILLION)
TABLE 368
MIDDLE EAST & AFRICA: ENTERPRISE NETWORKING MARKET, BY END USER, 2024–2029 (USD MILLION)
TABLE 369
MIDDLE EAST & AFRICA: ENTERPRISE NETWORKING MARKET, BY SERVICE PROVIDER, 2018–2023 (USD MILLION)
TABLE 370
MIDDLE EAST & AFRICA: ENTERPRISE NETWORKING MARKET, BY SERVICE PROVIDER, 2024–2029 (USD MILLION)
TABLE 371
MIDDLE EAST & AFRICA: ENTERPRISE NETWORKING MARKET, BY ENTERPRISE, 2018–2023 (USD MILLION)
TABLE 372
MIDDLE EAST & AFRICA: ENTERPRISE NETWORKING MARKET, BY ENTERPRISE, 2024–2029 (USD MILLION)
TABLE 373
MIDDLE EAST & AFRICA: ENTERPRISE NETWORKING MARKET, BY REGION, 2018–2023 (USD MILLION)
TABLE 374
MIDDLE EAST & AFRICA: ENTERPRISE NETWORKING MARKET, BY REGION, 2024–2029 (USD MILLION)
TABLE 375
MIDDLE EAST: ENTERPRISE NETWORKING MARKET, BY OFFERING, 2018–2023 (USD MILLION)
TABLE 376
MIDDLE EAST: ENTERPRISE NETWORKING MARKET, BY OFFERING, 2024–2029 (USD MILLION)
TABLE 377
MIDDLE EAST: ENTERPRISE NETWORKING MARKET, BY NETWORKING DEVICE, 2018–2023 (USD MILLION)
TABLE 378
MIDDLE EAST: ENTERPRISE NETWORKING MARKET, BY NETWORKING DEVICE, 2024–2029 (USD MILLION)
TABLE 379
MIDDLE EAST: ENTERPRISE NETWORKING MARKET, BY SWITCH TYPE, 2018–2023 (USD MILLION)
TABLE 380
MIDDLE EAST: ENTERPRISE NETWORKING MARKET, BY SWITCH TYPE, 2024–2029 (USD MILLION)
TABLE 381
MIDDLE EAST: ENTERPRISE NETWORKING MARKET, BY FIXED SWITCH TYPE, 2018–2023 (USD MILLION)
TABLE 382
MIDDLE EAST: ENTERPRISE NETWORKING MARKET, BY FIXED SWITCH TYPE, 2024–2029 (USD MILLION)
TABLE 383
MIDDLE EAST: ENTERPRISE NETWORKING MARKET, BY SWITCH SPEED, 2018–2023 (USD MILLION)
TABLE 384
MIDDLE EAST: ENTERPRISE NETWORKING MARKET, BY SWITCH SPEED, 2024–2029 (USD MILLION)
TABLE 385
MIDDLE EAST: ENTERPRISE NETWORKING MARKET, BY NETWORKING SOFTWARE, 2018–2023 (USD MILLION)
TABLE 386
MIDDLE EAST: ENTERPRISE NETWORKING MARKET, BY NETWORKING SOFTWARE, 2024–2029 (USD MILLION)
TABLE 387
MIDDLE EAST: ENTERPRISE NETWORKING MARKET, BY SERVICE, 2018–2023 (USD MILLION)
TABLE 388
MIDDLE EAST: ENTERPRISE NETWORKING MARKET, BY SERVICE, 2024–2029 (USD MILLION)
TABLE 389
MIDDLE EAST: ENTERPRISE NETWORKING MARKET, BY PROFESSIONAL SERVICE, 2018–2023 (USD MILLION)
TABLE 390
MIDDLE EAST: ENTERPRISE NETWORKING MARKET, BY PROFESSIONAL SERVICE, 2024–2029 (USD MILLION)
TABLE 391
MIDDLE EAST: ENTERPRISE NETWORKING MARKET, BY CONNECTION TYPE, 2018–2023 (USD MILLION)
TABLE 392
MIDDLE EAST: ENTERPRISE NETWORKING MARKET, BY CONNECTION TYPE, 2024–2029 (USD MILLION)
TABLE 393
MIDDLE EAST: ENTERPRISE NETWORKING MARKET, BY DEPLOYMENT MODE, 2018–2023 (USD MILLION)
TABLE 394
MIDDLE EAST: ENTERPRISE NETWORKING MARKET, BY DEPLOYMENT MODE, 2024–2029 (USD MILLION)
TABLE 395
MIDDLE EAST: ENTERPRISE NETWORKING MARKET, BY NETWORK, 2018–2023 (USD MILLION)
TABLE 396
MIDDLE EAST: ENTERPRISE NETWORKING MARKET, BY NETWORK, 2024–2029 (USD MILLION)
TABLE 397
MIDDLE EAST: ENTERPRISE NETWORKING MARKET, BY END USER, 2018–2023 (USD MILLION)
TABLE 398
MIDDLE EAST: ENTERPRISE NETWORKING MARKET, BY END USER, 2024–2029 (USD MILLION)
TABLE 399
MIDDLE EAST: ENTERPRISE NETWORKING MARKET, BY SERVICE PROVIDER, 2018–2023 (USD MILLION)
TABLE 400
MIDDLE EAST: ENTERPRISE NETWORKING MARKET, BY SERVICE PROVIDER, 2024–2029 (USD MILLION)
TABLE 401
MIDDLE EAST: ENTERPRISE NETWORKING MARKET, BY ENTERPRISE, 2018–2023 (USD MILLION)
TABLE 402
MIDDLE EAST: ENTERPRISE NETWORKING MARKET, BY ENTERPRISE, 2024–2029 (USD MILLION)
TABLE 403
MIDDLE EAST: ENTERPRISE NETWORKING MARKET, BY COUNTRY, 2018–2023 (USD MILLION)
TABLE 404
MIDDLE EAST: ENTERPRISE NETWORKING MARKET, BY COUNTRY, 2024–2029 (USD MILLION)
TABLE 405
KSA: ENTERPRISE NETWORKING MARKET, BY OFFERING, 2018–2023 (USD MILLION)
TABLE 406
KSA: ENTERPRISE NETWORKING MARKET, BY OFFERING, 2024–2029 (USD MILLION)
TABLE 407
KSA: ENTERPRISE NETWORKING MARKET, BY NETWORKING DEVICE, 2018–2023 (USD MILLION)
TABLE 408
KSA: ENTERPRISE NETWORKING MARKET, BY NETWORKING DEVICE, 2024–2029 (USD MILLION)
TABLE 409
KSA: ENTERPRISE NETWORKING MARKET, BY SWITCH TYPE, 2018–2023 (USD MILLION)
TABLE 410
KSA: ENTERPRISE NETWORKING MARKET, BY SWITCH TYPE, 2024–2029 (USD MILLION)
TABLE 411
KSA: ENTERPRISE NETWORKING MARKET, BY FIXED SWITCH TYPE, 2018–2023 (USD MILLION)
TABLE 412
KSA: ENTERPRISE NETWORKING MARKET, BY FIXED SWITCH TYPE, 2024–2029 (USD MILLION)
TABLE 413
KSA: ENTERPRISE NETWORKING MARKET, BY SWITCH SPEED, 2018–2023 (USD MILLION)
TABLE 414
KSA: ENTERPRISE NETWORKING MARKET, BY SWITCH SPEED, 2024–2029 (USD MILLION)
TABLE 415
KSA: ENTERPRISE NETWORKING MARKET, BY NETWORKING SOFTWARE, 2018–2023 (USD MILLION)
TABLE 416
KSA: ENTERPRISE NETWORKING MARKET, BY NETWORKING SOFTWARE, 2024–2029 (USD MILLION)
TABLE 417
KSA: ENTERPRISE NETWORKING MARKET, BY SERVICE, 2018–2023 (USD MILLION)
TABLE 418
KSA: ENTERPRISE NETWORKING MARKET, BY SERVICE, 2024–2029 (USD MILLION)
TABLE 419
KSA: ENTERPRISE NETWORKING MARKET, BY PROFESSIONAL SERVICE, 2018–2023 (USD MILLION)
TABLE 420
KSA: ENTERPRISE NETWORKING MARKET, BY PROFESSIONAL SERVICE, 2024–2029 (USD MILLION)
TABLE 421
KSA: ENTERPRISE NETWORKING MARKET, BY CONNECTION TYPE, 2018–2023 (USD MILLION)
TABLE 422
KSA: ENTERPRISE NETWORKING MARKET, BY CONNECTION TYPE, 2024–2029 (USD MILLION)
TABLE 423
KSA: ENTERPRISE NETWORKING MARKET, BY DEPLOYMENT MODE, 2018–2023 (USD MILLION)
TABLE 424
KSA: ENTERPRISE NETWORKING MARKET, BY DEPLOYMENT MODE, 2024–2029 (USD MILLION)
TABLE 425
KSA: ENTERPRISE NETWORKING MARKET, BY NETWORK, 2018–2023 (USD MILLION)
TABLE 426
KSA: ENTERPRISE NETWORKING MARKET, BY NETWORK, 2024–2029 (USD MILLION)
TABLE 427
KSA: ENTERPRISE NETWORKING MARKET, BY END USER, 2018–2023 (USD MILLION)
TABLE 428
KSA: ENTERPRISE NETWORKING MARKET, BY END USER, 2024–2029 (USD MILLION)
TABLE 429
KSA: ENTERPRISE NETWORKING MARKET, BY SERVICE PROVIDER, 2018–2023 (USD MILLION)
TABLE 430
KSA: ENTERPRISE NETWORKING MARKET, BY SERVICE PROVIDER, 2024–2029 (USD MILLION)
TABLE 431
KSA: ENTERPRISE NETWORKING MARKET, BY ENTERPRISE, 2018–2023 (USD MILLION)
TABLE 432
KSA: ENTERPRISE NETWORKING MARKET, BY ENTERPRISE, 2024–2029 (USD MILLION)
TABLE 433
LATIN AMERICA: ENTERPRISE NETWORKING MARKET, BY OFFERING, 2018–2023 (USD MILLION)
TABLE 434
LATIN AMERICA: ENTERPRISE NETWORKING MARKET, BY OFFERING, 2024–2029 (USD MILLION)
TABLE 435
LATIN AMERICA: ENTERPRISE NETWORKING MARKET, BY NETWORKING DEVICE, 2018–2023 (USD MILLION)
TABLE 436
LATIN AMERICA: ENTERPRISE NETWORKING MARKET, BY NETWORKING DEVICE, 2024–2029 (USD MILLION)
TABLE 437
LATIN AMERICA: ENTERPRISE NETWORKING MARKET, BY SWITCH TYPE, 2018–2023 (USD MILLION)
TABLE 438
LATIN AMERICA: ENTERPRISE NETWORKING MARKET, BY SWITCH TYPE, 2024–2029 (USD MILLION)
TABLE 439
LATIN AMERICA: ENTERPRISE NETWORKING MARKET, BY FIXED SWITCH TYPE, 2018–2023 (USD MILLION)
TABLE 440
LATIN AMERICA: ENTERPRISE NETWORKING MARKET, BY FIXED SWITCH TYPE, 2024–2029 (USD MILLION)
TABLE 441
LATIN AMERICA: ENTERPRISE NETWORKING MARKET, BY SWITCH SPEED, 2018–2023 (USD MILLION)
TABLE 442
LATIN AMERICA: ENTERPRISE NETWORKING MARKET, BY SWITCH SPEED, 2024–2029 (USD MILLION)
TABLE 443
LATIN AMERICA: ENTERPRISE NETWORKING MARKET, BY NETWORKING SOFTWARE, 2018–2023 (USD MILLION)
TABLE 444
LATIN AMERICA: ENTERPRISE NETWORKING MARKET, BY NETWORKING SOFTWARE, 2024–2029 (USD MILLION)
TABLE 445
LATIN AMERICA: ENTERPRISE NETWORKING MARKET, BY SERVICE, 2018–2023 (USD MILLION)
TABLE 446
LATIN AMERICA: ENTERPRISE NETWORKING MARKET, BY SERVICE, 2024–2029 (USD MILLION)
TABLE 447
LATIN AMERICA: ENTERPRISE NETWORKING MARKET, BY PROFESSIONAL SERVICE, 2018–2023 (USD MILLION)
TABLE 448
LATIN AMERICA: ENTERPRISE NETWORKING MARKET, BY PROFESSIONAL SERVICE, 2024–2029 (USD MILLION)
TABLE 449
LATIN AMERICA: ENTERPRISE NETWORKING MARKET, BY CONNECTION TYPE, 2018–2023 (USD MILLION)
TABLE 450
LATIN AMERICA: ENTERPRISE NETWORKING MARKET, BY CONNECTION TYPE, 2024–2029 (USD MILLION)
TABLE 451
LATIN AMERICA: ENTERPRISE NETWORKING MARKET, BY DEPLOYMENT MODE, 2018–2023 (USD MILLION)
TABLE 452
LATIN AMERICA: ENTERPRISE NETWORKING MARKET, BY DEPLOYMENT MODE, 2024–2029 (USD MILLION)
TABLE 453
LATIN AMERICA: ENTERPRISE NETWORKING MARKET, BY NETWORK, 2018–2023 (USD MILLION)
TABLE 454
LATIN AMERICA: ENTERPRISE NETWORKING MARKET, BY NETWORK, 2024–2029 (USD MILLION)
TABLE 455
LATIN AMERICA: ENTERPRISE NETWORKING MARKET, BY END USER, 2018–2023 (USD MILLION)
TABLE 456
LATIN AMERICA: ENTERPRISE NETWORKING MARKET, BY END USER, 2024–2029 (USD MILLION)
TABLE 457
LATIN AMERICA: ENTERPRISE NETWORKING MARKET, BY SERVICE PROVIDER, 2018–2023 (USD MILLION)
TABLE 458
LATIN AMERICA: ENTERPRISE NETWORKING MARKET, BY SERVICE PROVIDER, 2024–2029 (USD MILLION)
TABLE 459
LATIN AMERICA: ENTERPRISE NETWORKING MARKET, BY ENTERPRISE, 2018–2023 (USD MILLION)
TABLE 460
LATIN AMERICA: ENTERPRISE NETWORKING MARKET, BY ENTERPRISE, 2024–2029 (USD MILLION)
TABLE 461
LATIN AMERICA: ENTERPRISE NETWORKING MARKET, BY COUNTRY, 2018–2023 (USD MILLION)
TABLE 462
LATIN AMERICA: ENTERPRISE NETWORKING MARKET, BY COUNTRY, 2024–2029 (USD MILLION)
TABLE 463
BRAZIL: ENTERPRISE NETWORKING MARKET, BY OFFERING, 2018–2023 (USD MILLION)
TABLE 464
BRAZIL: ENTERPRISE NETWORKING MARKET, BY OFFERING, 2024–2029 (USD MILLION)
TABLE 465
BRAZIL: ENTERPRISE NETWORKING MARKET, BY NETWORKING DEVICE, 2018–2023 (USD MILLION)
TABLE 466
BRAZIL: ENTERPRISE NETWORKING MARKET, BY NETWORKING DEVICE, 2024–2029 (USD MILLION)
TABLE 467
BRAZIL: ENTERPRISE NETWORKING MARKET, BY SWITCH TYPE, 2018–2023 (USD MILLION)
TABLE 468
BRAZIL: ENTERPRISE NETWORKING MARKET, BY SWITCH TYPE, 2024–2029 (USD MILLION)
TABLE 469
BRAZIL: ENTERPRISE NETWORKING MARKET, BY FIXED SWITCH TYPE, 2018–2023 (USD MILLION)
TABLE 470
BRAZIL: ENTERPRISE NETWORKING MARKET, BY FIXED SWITCH TYPE, 2024–2029 (USD MILLION)
TABLE 471
BRAZIL: ENTERPRISE NETWORKING MARKET, BY SWITCH SPEED, 2018–2023 (USD MILLION)
TABLE 472
BRAZIL: ENTERPRISE NETWORKING MARKET, BY SWITCH SPEED, 2024–2029 (USD MILLION)
TABLE 473
BRAZIL: ENTERPRISE NETWORKING MARKET, BY NETWORKING SOFTWARE, 2018–2023 (USD MILLION)
TABLE 474
BRAZIL: ENTERPRISE NETWORKING MARKET, BY NETWORKING SOFTWARE, 2024–2029 (USD MILLION)
TABLE 475
BRAZIL: ENTERPRISE NETWORKING MARKET, BY SERVICE, 2018–2023 (USD MILLION)
TABLE 476
BRAZIL: ENTERPRISE NETWORKING MARKET, BY SERVICE, 2024–2029 (USD MILLION)
TABLE 477
BRAZIL: ENTERPRISE NETWORKING MARKET, BY PROFESSIONAL SERVICE, 2018–2023 (USD MILLION)
TABLE 478
BRAZIL: ENTERPRISE NETWORKING MARKET, BY PROFESSIONAL SERVICE, 2024–2029 (USD MILLION)
TABLE 479
BRAZIL: ENTERPRISE NETWORKING MARKET, BY CONNECTION TYPE, 2018–2023 (USD MILLION)
TABLE 480
BRAZIL: ENTERPRISE NETWORKING MARKET, BY CONNECTION TYPE, 2024–2029 (USD MILLION)
TABLE 481
BRAZIL: ENTERPRISE NETWORKING MARKET, BY DEPLOYMENT MODE, 2018–2023 (USD MILLION)
TABLE 482
BRAZIL: ENTERPRISE NETWORKING MARKET, BY DEPLOYMENT MODE, 2024–2029 (USD MILLION)
TABLE 483
BRAZIL: ENTERPRISE NETWORKING MARKET, BY NETWORK, 2018–2023 (USD MILLION)
TABLE 484
BRAZIL: ENTERPRISE NETWORKING MARKET, BY NETWORK, 2024–2029 (USD MILLION)
TABLE 485
BRAZIL: ENTERPRISE NETWORKING MARKET, BY END USER, 2018–2023 (USD MILLION)
TABLE 486
BRAZIL: ENTERPRISE NETWORKING MARKET, BY END USER, 2024–2029 (USD MILLION)
TABLE 487
BRAZIL: ENTERPRISE NETWORKING MARKET, BY SERVICE PROVIDER, 2018–2023 (USD MILLION)
TABLE 488
BRAZIL: ENTERPRISE NETWORKING MARKET, BY SERVICE PROVIDER, 2024–2029 (USD MILLION)
TABLE 489
BRAZIL: ENTERPRISE NETWORKING MARKET, BY ENTERPRISE, 2018–2023 (USD MILLION)
TABLE 490
BRAZIL: ENTERPRISE NETWORKING MARKET, BY ENTERPRISE, 2024–2029 (USD MILLION)
TABLE 491
OVERVIEW OF STRATEGIES ADOPTED BY KEY ENTERPRISE NETWORKING PLAYERS
TABLE 492
ENTERPRISE NETWORKING MARKET: DEGREE OF COMPETITION
TABLE 493
OFFERING FOOTPRINT
TABLE 494
END USER FOOTPRINT
TABLE 495
REGIONAL FOOTPRINT
TABLE 496
ENTERPRISE NETWORKING MARKET: KEY STARTUPS/SMES
TABLE 497
ENTERPRISE NETWORKING MARKET: COMPETITIVE BENCHMARKING OF KEY STARTUPS/SMES
TABLE 498
ENTERPRISE NETWORKING MARKET: PRODUCT LAUNCHES AND ENHANCEMENTS, SEPTEMBER 2022–NOVEMBER 2024
TABLE 499
ENTERPRISE NETWORKING MARKET: DEALS, AUGUST 2022–NOVEMBER 2024
TABLE 500
CISCO SYSTEMS, INC.: COMPANY OVERVIEW
TABLE 501
CISCO SYSTEMS, INC.: PRODUCTS/SOLUTIONS/SERVICES OFFERED
TABLE 502
CISCO SYSTEMS, INC.: PRODUCT LAUNCHES AND ENHANCEMENTS
TABLE 503
CISCO SYSTEMS, INC.: DEALS
TABLE 504
HEWLETT PACKARD ENTERPRISE: COMPANY OVERVIEW
TABLE 505
HEWLETT PACKARD ENTERPRISE: PRODUCTS/SOLUTIONS/SERVICES OFFERED
TABLE 506
HEWLETT PACKARD ENTERPRISE: PRODUCT LAUNCHES AND ENHANCEMENTS
TABLE 507
HEWLETT PACKARD ENTERPRISE: DEALS
TABLE 508
HUAWEI: COMPANY OVERVIEW
TABLE 509
HUAWEI: PRODUCTS/SOLUTIONS/SERVICES OFFERED
TABLE 510
HUAWEI: PRODUCT LAUNCHES AND ENHANCEMENTS
TABLE 511
JUNIPER NETWORKS: COMPANY OVERVIEW
TABLE 512
JUNIPER NETWORKS: PRODUCTS/SOLUTIONS/SERVICES OFFERED
TABLE 513
JUNIPER NETWORKS: PRODUCT LAUNCHES AND ENHANCEMENTS
TABLE 514
JUNIPER NETWORKS: DEALS
TABLE 515
BROADCOM: COMPANY OVERVIEW
TABLE 516
BROADCOM: PRODUCTS/SOLUTIONS/SERVICES OFFERED
TABLE 517
BROADCOM: PRODUCT LAUNCHES AND ENHANCEMENTS
TABLE 518
BROADCOM: DEALS
TABLE 519
FORTINET: COMPANY OVERVIEW
TABLE 520
FORTINET: PRODUCTS/SOLUTIONS/SERVICES OFFERED
TABLE 521
FORTINET: PRODUCT LAUNCHES AND ENHANCEMENTS
TABLE 522
FORTINET: DEALS
TABLE 523
ARISTA NETWORKS: COMPANY OVERVIEW
TABLE 524
ARISTA NETWORKS: PRODUCTS/SOLUTIONS/SERVICES OFFERED
TABLE 525
ARISTA NETWORKS: DEALS
TABLE 526
EXTREME NETWORKS: COMPANY OVERVIEW
TABLE 527
EXTREME NETWORKS: PRODUCTS/SOLUTIONS/SERVICES OFFERED
TABLE 528
EXTREME NETWORKS: PRODUCT LAUNCHES AND ENHANCEMENTS
TABLE 529
EXTREME NETWORKS: DEALS
TABLE 530
CLOUDFLARE: COMPANY OVERVIEW
TABLE 531
CLOUDFLARE: PRODUCTS/SOLUTIONS/SERVICES OFFERED
TABLE 532
CLOUDFLARE: PRODUCT LAUNCHES AND ENHANCEMENTS
TABLE 533
CLOUDFLARE: DEALS
TABLE 534
SD-WAN MARKET, BY OFFERING, 2016–2021 (USD MILLION)
TABLE 535
SD-WAN MARKET, BY OFFERING, 2022–2027 (USD MILLION)
TABLE 536
SOLUTIONS: SD-WAN MARKET, BY TYPE, 2016–2021 (USD MILLION)
TABLE 537
SOLUTIONS: SD-WAN MARKET, BY TYPE, 2022–2027 (USD MILLION)
TABLE 538
SERVICES: SD-WAN MARKET, BY TYPE, 2016–2021 (USD MILLION)
TABLE 539
SERVICES: SD-WAN MARKET, BY TYPE, 2022–2027 (USD MILLION)
TABLE 540
SD-WAN MARKET, BY DEPLOYMENT MODE, 2016–2021 (USD MILLION)
TABLE 541
SD-WAN MARKET, BY DEPLOYMENT MODE, 2022–2027 (USD MILLION)
TABLE 542
SD-WAN MARKET, BY ORGANIZATION SIZE, 2016–2021 (USD MILLION)
TABLE 543
SD-WAN MARKET, BY ORGANIZATION SIZE, 2022–2027 (USD MILLION)
TABLE 544
SD-WAN MARKET, BY END USER, 2016–2021 (USD MILLION)
TABLE 545
SD-WAN MARKET, BY END USER, 2022–2027 (USD MILLION)
TABLE 546
SD-WAN MARKET, BY VERTICAL, 2016–2021 (USD MILLION)
TABLE 547
SD-WAN MARKET, BY VERTICAL, 2022–2027 (USD MILLION)
TABLE 548
SD-WAN MARKET, BY REGION, 2016–2021 (USD MILLION)
TABLE 549
SD-WAN MARKET, BY REGION, 2022–2027 (USD MILLION)
TABLE 550
SOFTWARE-DEFINED NETWORKING MARKET, BY OFFERING, 2018–2022 (USD MILLION)
TABLE 551
SOFTWARE-DEFINED NETWORKING MARKET, BY OFFERING, 2023–2028 (USD MILLION)
TABLE 552
SOFTWARE-DEFINED NETWORKING MARKET, BY SDN TYPE, 2018–2022 (USD MILLION)
TABLE 553
SOFTWARE-DEFINED NETWORKING MARKET, BY SDN TYPE, 2023–2028 (USD MILLION)
TABLE 554
SOFTWARE-DEFINED NETWORKING MARKET, BY END USER, 2018–2022 (USD MILLION)
TABLE 555
SOFTWARE-DEFINED NETWORKING MARKET, BY END USER, 2023–2028 (USD MILLION)
TABLE 556
SOFTWARE-DEFINED NETWORKING MARKET, BY APPLICATION, 2018–2022 (USD MILLION)
TABLE 557
SOFTWARE-DEFINED NETWORKING MARKET, BY APPLICATION, 2023–2028 (USD MILLION)
TABLE 558
SOFTWARE-DEFINED NETWORKING MARKET, BY VERTICAL, 2018–2022 (USD MILLION)
TABLE 559
SOFTWARE-DEFINED NETWORKING MARKET, BY VERTICAL, 2023–2028 (USD MILLION)
TABLE 560
SOFTWARE-DEFINED NETWORKING MARKET, BY REGION, 2018–2022 (USD MILLION)
TABLE 561
SOFTWARE-DEFINED NETWORKING MARKET, BY REGION, 2023–2028 (USD MILLION)
FIGURE 1
ENTERPRISE NETWORKING MARKET: RESEARCH DESIGN
FIGURE 2
BREAKDOWN OF PRIMARY INTERVIEWS, BY COMPANY TYPE, DESIGNATION, AND REGION
FIGURE 3
ENTERPRISE NETWORKING MARKET: TOP-DOWN AND BOTTOM-UP APPROACHES
FIGURE 4
MARKET SIZE ESTIMATION METHODOLOGY – APPROACH 1 (SUPPLY SIDE): REVENUE OF VENDORS IN ENTERPRISE NETWORKING MARKET
FIGURE 5
MARKET SIZE ESTIMATION METHODOLOGY – APPROACH 2 (DEMAND SIDE): ENTERPRISE NETWORKING MARKET
FIGURE 6
MARKET SIZE ESTIMATION METHODOLOGY: DEMAND-SIDE ANALYSIS
FIGURE 7
MARKET SIZE ESTIMATION USING BOTTOM-UP APPROACH
FIGURE 8
DATA TRIANGULATION
FIGURE 9
ENTERPRISE NETWORKING MARKET, 2022–2029 (USD MILLION)
FIGURE 10
ENTERPRISE NETWORKING MARKET, BY REGION, 2024
FIGURE 11
GROWING TREND OF SECURE MULTI-CLOUD NETWORKING AMONG ENTERPRISES TO DRIVE MARKET GROWTH
FIGURE 12
NETWORKING DEVICES SEGMENT TO DOMINATE MARKET DURING FORECAST PERIOD
FIGURE 13
MANAGED SERVICES SEGMENT TO ACCOUNT FOR HIGHER CAGR DURING FORECAST PERIOD
FIGURE 14
DEPLOYMENT & INTEGRATION SEGMENT TO ACCOUNT FOR LARGEST MARKET DURING FORECAST PERIOD
FIGURE 15
SWITCHES SEGMENT TO ACCOUNT FOR LARGEST MARKET SHARE DURING FORECAST PERIOD
FIGURE 16
CAMPUS NETWORK SEGMENT TO ACCOUNT FOR LARGEST MARKET SHARE DURING FORECAST PERIOD
FIGURE 17
MANAGED SD-WAN (TELCO OR MSP) SEGMENT TO ACCOUNT FOR LARGEST MARKET SHARE DURING FORECAST PERIOD
FIGURE 18
WIRED SEGMENT TO ACCOUNT FOR LARGER MARKET SHARE DURING FORECAST PERIOD
FIGURE 19
BFSI SEGMENT TO ACCOUNT FOR LARGEST MARKET SHARE DURING FORECAST PERIOD
FIGURE 20
NETWORK MANAGEMENT & MONITORING AND SERVICE PROVIDERS SEGMENTS TO ACCOUNT FOR SIGNIFICANT MARKET SHARES IN 2024
FIGURE 21
DRIVERS, RESTRAINTS, OPPORTUNITIES, AND CHALLENGES: ENTERPRISE NETWORKING MARKET
FIGURE 22
EVOLUTION OF ENTERPRISE NETWORKING
FIGURE 23
ENTERPRISE NETWORKING MARKET: SUPPLY CHAIN ANALYSIS
FIGURE 24
KEY PLAYERS IN ENTERPRISE NETWORKING MARKET ECOSYSTEM
FIGURE 25
LIST OF MAJOR PATENTS FOR ENTERPRISE NETWORKING SOLUTIONS
FIGURE 26
AVERAGE SELLING PRICES OF KEY PLAYERS, BY NETWORKING DEVICE
FIGURE 27
TRENDS/DISRUPTIONS IMPACTING CUSTOMER BUSINESS
FIGURE 28
ENTERPRISE NETWORKING MARKET: PORTER’S FIVE FORCES ANALYSIS
FIGURE 29
INFLUENCE OF STAKEHOLDERS ON BUYING PROCESS FOR TOP THREE END USERS
FIGURE 30
KEY BUYING CRITERIA FOR TOP THREE END USERS
FIGURE 31
MACHINES FOR RECEPTION, CONVERSION, AND TRANSMISSION OR REGENERATION OF VOICE, IMAGES, OR OTHER DATA EXPORT, BY KEY COUNTRY, 2015–2022 (USD BILLION)
FIGURE 32
MACHINES FOR RECEPTION, CONVERSION, AND TRANSMISSION OR REGENERATION OF VOICE, IMAGES, OR OTHER DATA IMPORT, BY KEY COUNTRY, 2015–2022 (USD BILLION)
FIGURE 33
INVESTMENT AND FUNDING SCENARIO
FIGURE 34
USE CASES OF GENERATIVE AI IN ENTERPRISE NETWORKING
FIGURE 35
NETWORKING SOFTWARE SEGMENT TO GROW AT HIGHEST CAGR DURING FORECAST PERIOD
FIGURE 36
ACCESS POINTS SEGMENT TO GROW AT HIGHEST CAGR DURING FORECAST PERIOD
FIGURE 37
NETWORK SECURITY SEGMENT TO GROW AT HIGHEST CAGR DURING FORECAST PERIOD
FIGURE 38
MANAGED SERVICES SEGMENT TO GROW AT HIGHER CAGR DURING FORECAST PERIOD
FIGURE 39
CONSULTING SEGMENT TO GROW AT HIGHEST CAGR DURING FORECAST PERIOD
FIGURE 40
DATA CENTER NETWORK TO GROW AT HIGHEST CAGR DURING FORECAST PERIOD
FIGURE 41
SD-WAN AS A SERVICE SEGMENT TO GROW AT HIGHEST CAGR DURING FORECAST PERIOD
FIGURE 42
WIRELESS SEGMENT TO GROW AT HIGHER CAGR DURING FORECAST PERIOD
FIGURE 43
ENTERPRISES SEGMENT TO REGISTER HIGHER CAGR DURING FORECAST PERIOD
FIGURE 44
TELECOM SERVICE PROVIDERS SEGMENT TO GROW AT HIGHER CAGR DURING FORECAST PERIOD
FIGURE 45
HEALTHCARE & LIFE SCIENCES SEGMENT TO REGISTER HIGHEST CAGR DURING FORECAST PERIOD
FIGURE 46
NORTH AMERICA: MARKET SNAPSHOT
FIGURE 47
ASIA PACIFIC: MARKET SNAPSHOT
FIGURE 48
REVENUE ANALYSIS OF KEY PLAYERS, 2019–2023 (USD MILLION)
FIGURE 49
SHARE OF LEADING COMPANIES IN ENTERPRISE NETWORKING MARKET, 2023
FIGURE 50
MARKET RANKING ANALYSIS OF TOP FIVE PLAYERS
FIGURE 51
ENTERPRISE NETWORKING MARKET: COMPANY EVALUATION MATRIX (KEY PLAYERS), 2023
FIGURE 52
COMPANY FOOTPRINT
FIGURE 53
ENTERPRISE NETWORKING MARKET: COMPANY EVALUATION MATRIX (STARTUPS/SMES), 2023
FIGURE 54
FINANCIAL METRICS OF KEY ENTERPRISE NETWORKING VENDORS
FIGURE 55
COMPANY VALUATION OF KEY ENTERPRISE NETWORKING VENDORS
FIGURE 56
BRAND/PRODUCT COMPARISON
FIGURE 57
CISCO SYSTEMS, INC.: COMPANY SNAPSHOT
FIGURE 58
HEWLETT PACKARD ENTERPRISE: COMPANY SNAPSHOT
FIGURE 59
HUAWEI: COMPANY SNAPSHOT
FIGURE 60
JUNIPER NETWORKS: COMPANY SNAPSHOT
FIGURE 61
BROADCOM: COMPANY SNAPSHOT
FIGURE 62
FORTINET: COMPANY SNAPSHOT
FIGURE 63
ARISTA NETWORKS: COMPANY SNAPSHOT
FIGURE 64
EXTREME NETWORKS: COMPANY SNAPSHOT
FIGURE 65
CLOUDFLARE: COMPANY SNAPSHOT


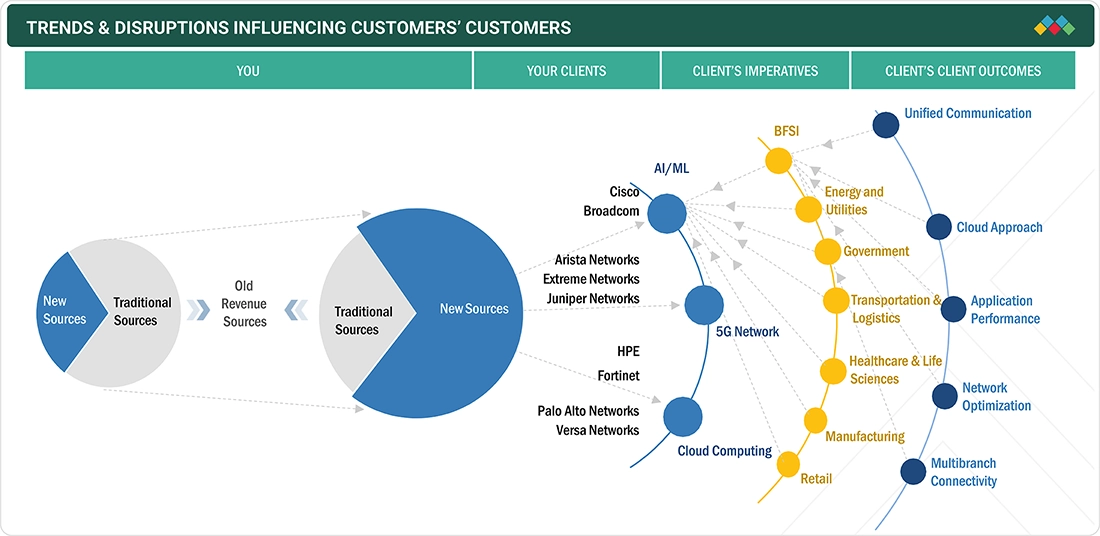


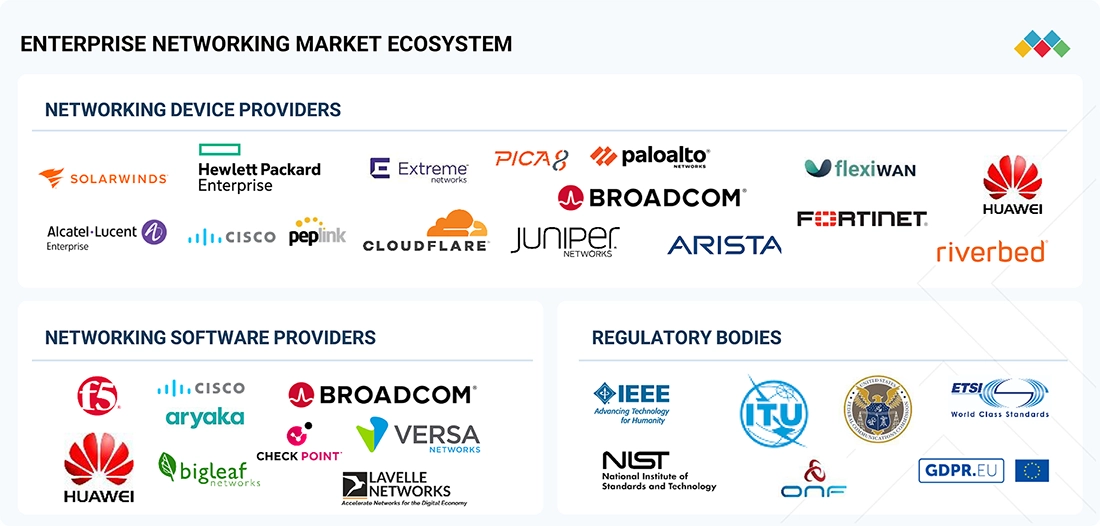
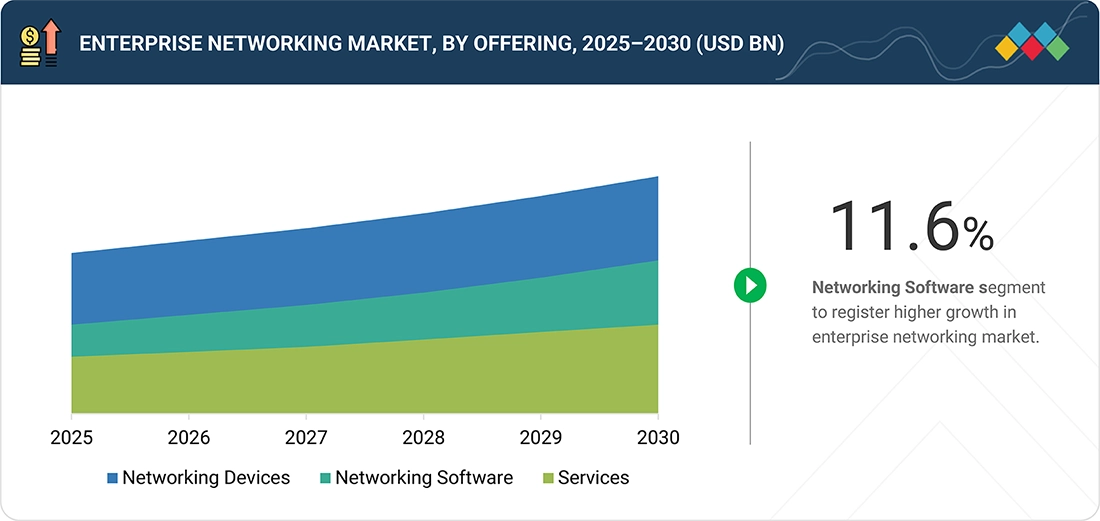
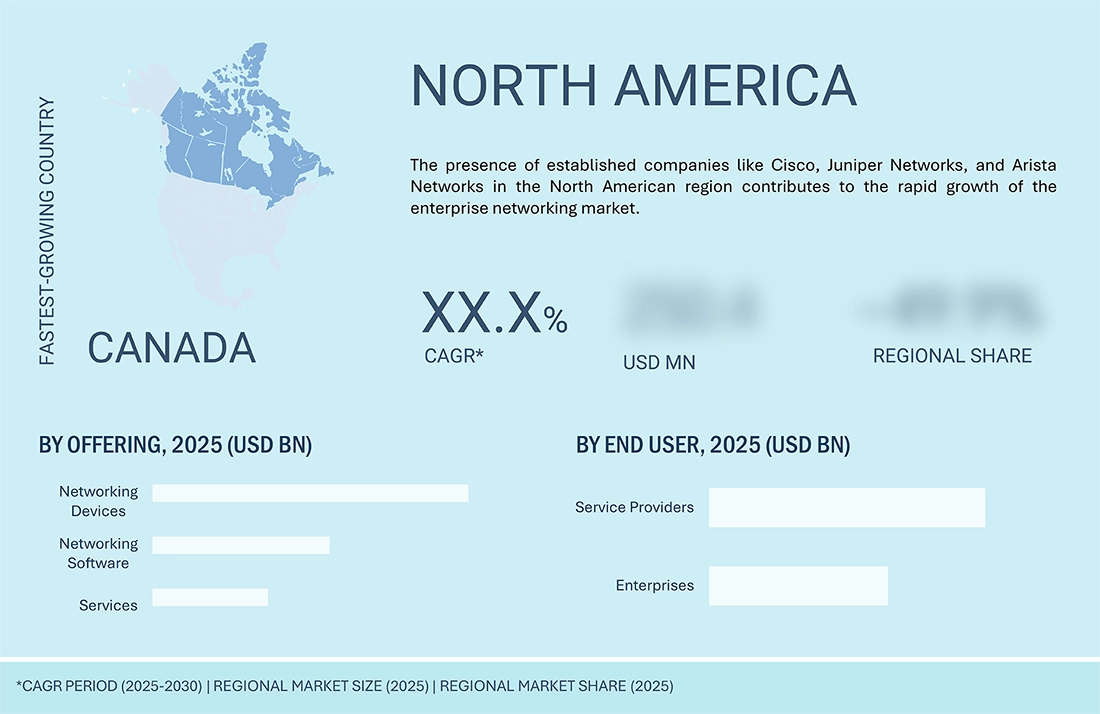
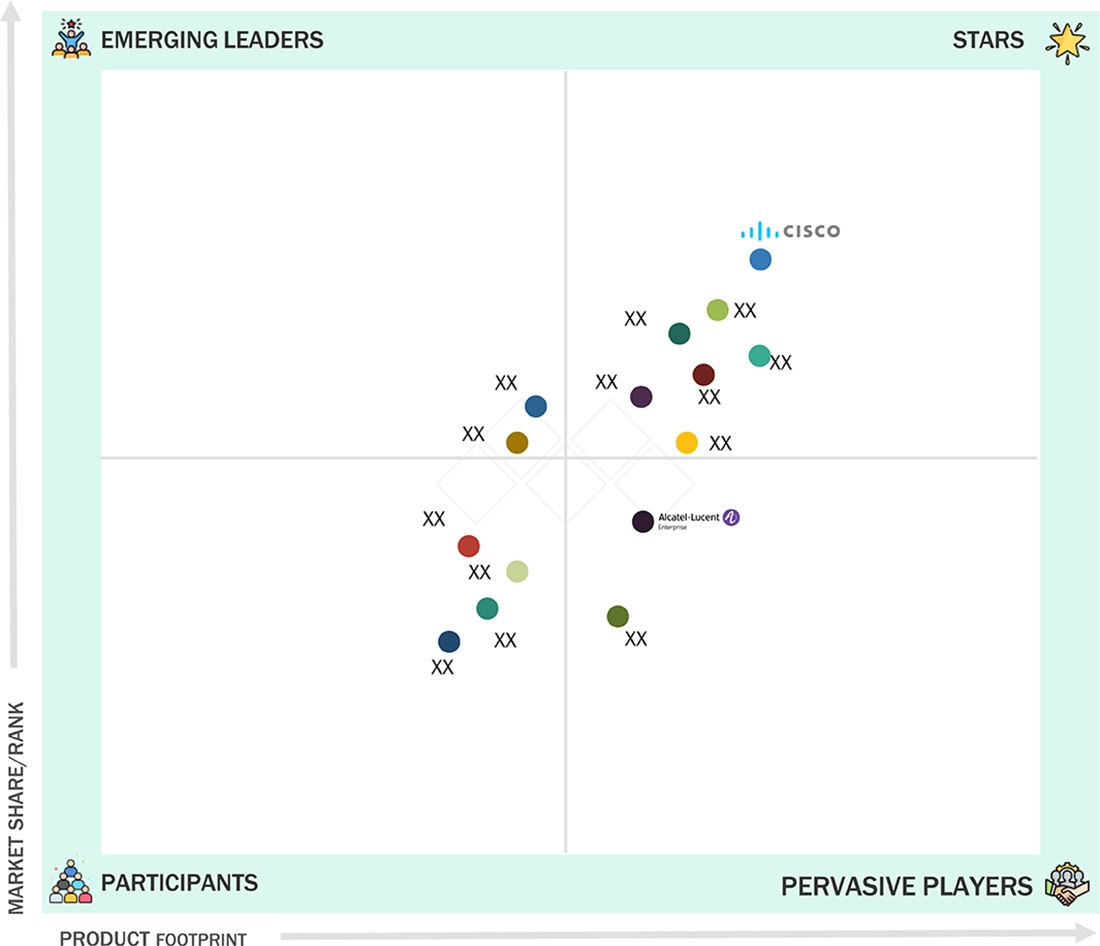
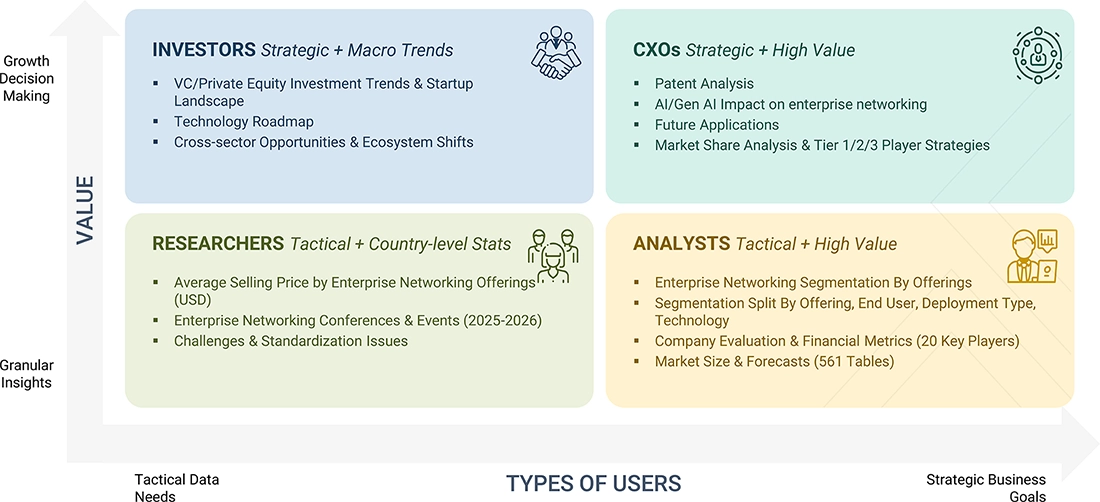
 Exclusive indicates content/data unique to MarketsandMarkets and not available with any competitors.


Growth opportunities and latent adjacency in Enterprise Networking Market