Europe Busbar Market by Material (Copper, Aluminum), Insulation (Laminated, Powder Coated, Bare), Manufacturing Process (Molded, Stamped, Flexible, Hybrid), End User (Utilities, Industrial, Data Centers, and Others), and Country – Forecast to 2031

icon1
USD 6.43 BN
MARKET SIZE, 2031
icon2
CAGR 6.5%
(2026-2031)
icon3
221
REPORT PAGES
icon4
133
MARKET TABLES

OVERVIEW

europe-busbar-market Overview

Source: Secondary Research, Interviews with Experts, MarketsandMarkets Analysis

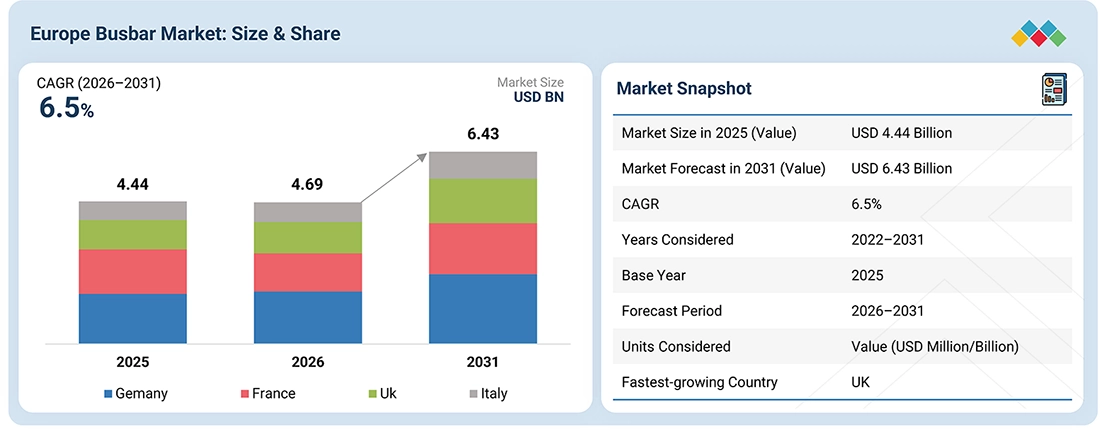
The Europe busbar market is projected to grow from USD 4.69 billion in 2026 to USD 6.43 billion by 2031, at a CAGR of 6.5%. Growth is driven by grid modernization, renewable energy integration, and rising investments in data centers, industrial automation, and transportation electrification. Technological advancements in copper, aluminum, and laminated busbars are further supporting demand by improving power distribution efficiency, thermal performance, and reliability across utility, industrial, commercial, data center, renewable energy, automotive, and locomotive applications.

KEY TAKEAWAYS

  • BY COUNTRY
    The UK market is expected to register the highest CAGR of 7.2% during the forecast period.
  • BY MATERIAL
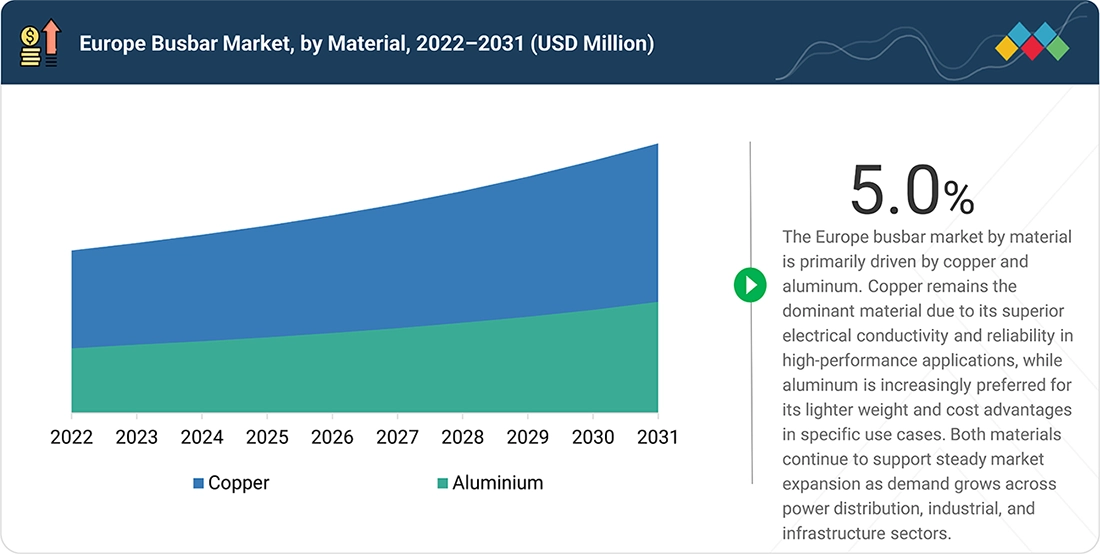
    By material, aluminum is expected to register the highest CAGR of 6.8% during the forecast period.
  • BY POWER RATING
    By power rating, the high segment is expected to register the highest CAGR of 7.2% during the forecast period.
  • BY MANUFACTURING PROCESS
    By manufacturing process, the flexible segment is expected to register the highest CAGR during the forecast period.
  • BY INSULATION
    By insulation, the laminated segment is expected to register the highest CAGR during the forecast period.
  • BY END-USE APPLICATIONS
    By end-use application, the data center segment is expected to register the highest CAGR during the forecast period.
  • COMPETITIVE LANDSCAPE
    Schneider Electric, Eaton, ABB, and Siemens are among the established participants in the Europe busbar market. These companies are expanding their positions through copper and aluminum busbar systems, low-, medium-, and high-voltage solutions, modular and compact designs, enhanced thermal performance, and integrated power-distribution technologies. Legrand, nVent, Rittal, and General Electric are particularly active across busbar hardware, power distribution solutions, and related infrastructure offerings.

The Europe busbar market is driven by the modernization of power distribution infrastructure, increasing integration of renewable energy, and growing demand for efficient and reliable electrical systems. Rising investments in data centers, industrial automation, utility grid upgrades, and transportation electrification are supporting market growth, while advancements in copper, aluminum, and laminated busbars, compact designs, higher current-carrying capacity, improved thermal performance, and modular systems are expanding busbar capabilities across utility, industrial, residential & commercial, data center, renewable energy, automotive, and locomotive applications.

TRENDS & DISRUPTIONS IMPACTING CUSTOMERS' CUSTOMERS

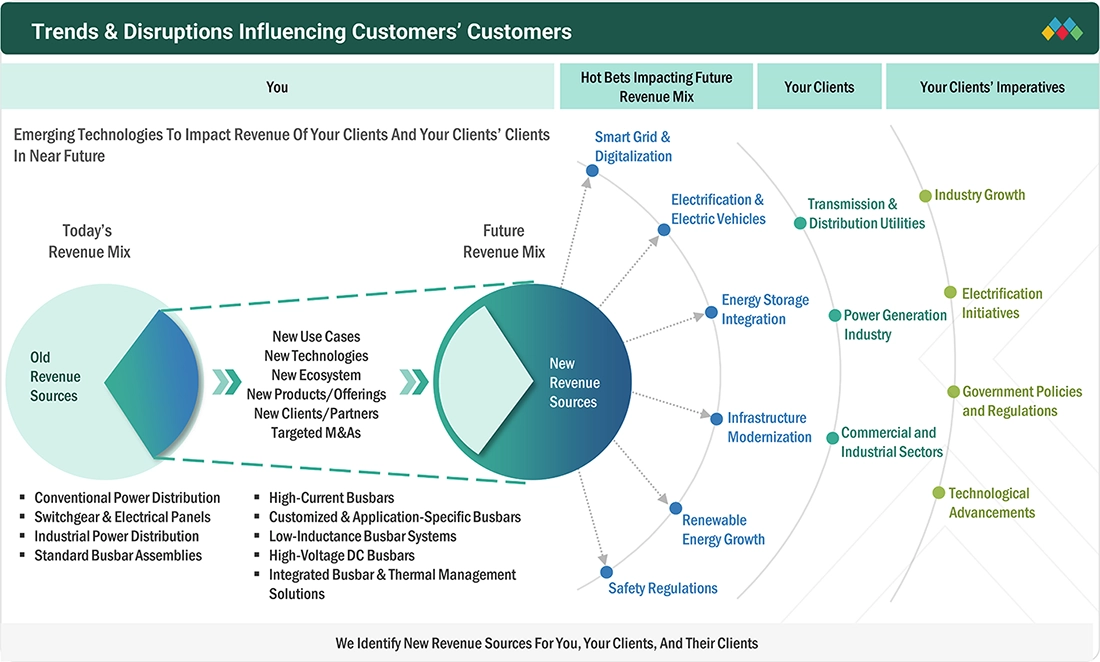
The Europe busbar market is estimated to register a CAGR of 6.5% during the forecast period. ABB Ltd., Siemens AG, Schneider Electric SE, Eaton Corporation, Legrand SA, nVent Electric plc, Rittal GmbH & Co. KG, and General Electric are strengthening their portfolios through copper and aluminum busbar systems, low-, medium-, and high-voltage solutions, modular designs, enhanced current-carrying capacity, and advanced power-distribution technologies. ABB is expanding modular and compact busbar solutions for industrial and utility applications, while Siemens is combining high-performance busbar systems with digital monitoring and smart-grid integration. Schneider Electric is integrating copper and aluminum busbars with improved thermal management, higher load density capabilities, and digital power-management platforms.

europe-busbar-market Disruptions

Source: Secondary Research, Interviews with Experts, MarketsandMarkets Analysis

MARKET DYNAMICS

Drivers
Impact
Level
  • Expansion of Data Centers and High-Density Computing
  • Increasing Industrial Electrification and Automation
RESTRAINTS
Impact
Level
  • Volatility in Copper and Aluminum Prices
  • High Initial Installation Costs
OPPORTUNITIES
Impact
Level
  • Retrofitting of Aging Electrical Infrastructure
  • Growing Demand for Modular and Digitally Monitored Busbar Solutions
CHALLENGES
Impact
Level
  • Intense Competition and Customization Requirements

Source: Secondary Research, Interviews with Experts, MarketsandMarkets Analysis

Expansion of Data Centers and High-Density Computing

The rapid expansion of data centers across Europe, driven by increasing adoption of artificial intelligence (AI), cloud computing, and digital services, is accelerating demand for reliable and high-capacity power distribution systems. Data centers require continuous electricity to operate servers, networking equipment, storage systems, and cooling infrastructure. As computing workloads become more power-intensive, operators increasingly require compact, scalable, and efficient electrical distribution solutions. Busbars address these requirements through high current-carrying capacity, space-efficient designs, and modular connections that simplify power distribution and future capacity expansion. According to the European Commission's September 2026 report, data centers across the European Union consumed 68 TWh of electricity in 2024, with consumption projected to reach 114 TWh by 2030. This increase highlights the growing need for electrical infrastructure capable of supporting higher power loads while maintaining operational reliability and efficient space utilization. Busbars are widely applicable within data centers, connecting switchgear, power distribution units, and server racks. For example, Siemens' SIVACON 8PS LData busbar trunking system provides modular tap-off connections and powerline communication capabilities, supporting flexible power distribution and monitoring in data center environments. Investment trends further demonstrate this demand. In July 2026, Siemens announced a €300 million investment in Germany to expand production of power distribution systems serving data centers and other industries. Although this investment covers broader electrical infrastructure, it reflects growing demand for supporting technologies. Consequently, continued expansion of hyperscale and colocation facilities is expected to create opportunities for busbar manufacturers offering high-capacity, modular, and digitally monitored power distribution solutions.

Volatility in Copper and Aluminum Prices

The Europe busbar market is exposed to fluctuations in copper and aluminum prices, as these metals are the primary conductive materials used in busbar manufacturing. Changes in metal prices directly affect raw material procurement costs, production expenses, pricing strategies, and profit margins. Since material costs form a significant part of the total manufacturing cost, sudden price increases can make it difficult for manufacturers to maintain stable quotations for electrical contractors, distributors, and end users, particularly in projects with fixed-price contracts and long delivery schedules. According to France's National Institute of Statistics and Economic Studies (INSEE), the London Metal Exchange copper spot price averaged USD 9200.3 per metric ton in April 2025, rising to USD 11310.8 per metric ton in December 2025—an increase of approximately 22.9% over eight months. The International Energy Agency also reported in its Global Critical Minerals Outlook 2026 that copper and aluminum prices rose by approximately one-third between January 2025 and April 2026, reflecting tight supply conditions and broader market pressures. These fluctuations create uncertainty for European busbar manufacturers when purchasing metals, negotiating contracts, and estimating project costs. For example, a manufacturer supplying copper busbars for a commercial building or industrial power distribution project may face higher material costs between quotation and production, particularly if the contract does not include price-adjustment clauses. Manufacturers may need to revise quotations, maintain additional inventory, or absorb part of the cost increase, potentially affecting competitiveness and profitability.

Retrofitting of Aging Electrical Infrastructure

The modernization of aging electrical infrastructure across Europe presents significant opportunities for busbar manufacturers. Many existing commercial buildings, industrial facilities, and public infrastructure assets require electrical system upgrades to accommodate increasing electricity demand, improve operational reliability, and meet evolving safety and energy-efficiency requirements. Retrofitting projects provide opportunities to replace outdated cable-based distribution arrangements and aging electrical panels with modern busbar trunking systems that offer compact installation, simplified maintenance, and greater flexibility for future expansion. This opportunity is particularly relevant to older industrial plants, office buildings, hospitals, railway facilities, and commercial complexes where space constraints and operational continuity are important considerations. For example, a manufacturing facility upgrading its production lines can install modular busbar trunking to supply power to new machinery without extensive rewiring across the facility. Similarly, commercial building owners can adopt busbar systems during electrical refurbishment to accommodate additional HVAC equipment, lifts, and other electrical loads. Europe's building renovation initiatives further support this opportunity. The European Union's revised Energy Performance of Buildings Directive (EU/2024/1275), which entered into force in May 2024, establishes a framework for improving building energy performance and accelerating renovation across the region. Although the directive does not specifically mandate busbar installations, building renovation and electrification projects can create opportunities for modern power distribution solutions. Manufacturers that collaborate with electrical contractors, facility managers, switchgear suppliers, and building renovation companies can strengthen their position in Europe's electrical infrastructure modernization market.

Intense Competition and Customization Requirements

The Europe busbar market faces intense competition among established electrical equipment manufacturers and specialized regional suppliers, making product differentiation, pricing, and customization important factors in winning customer contracts. Companies such as Schneider Electric, Siemens, ABB, and Eaton offer busbar and power distribution solutions for applications ranging from industrial facilities to data centers and commercial buildings. This competitive environment requires manufacturers to continuously improve product performance, installation flexibility, safety, and cost efficiency while meeting customer-specific requirements. Customization presents an additional challenge because busbar systems must be designed according to the electrical capacity, layout, available installation space, and operating conditions of individual projects. For example, data center operators may require modular busbar trunking systems that can accommodate increasing rack power densities and allow capacity expansion without major changes to existing infrastructure. Similarly, industrial customers may require specific conductor materials, current ratings, enclosure designs, and connection configurations to integrate busbars with existing switchgear and machinery. Schneider Electric's Canalis busbar trunking range and Siemens' SIVACON 8PS systems illustrate how manufacturers offer different configurations for building and industrial power distribution applications. Meeting these varied requirements can increase engineering and production costs, complicate inventory management, and extend delivery timelines, particularly for customized projects. Manufacturers must also balance tailored solutions with competitive pricing and compliance with applicable European electrical standards. Consequently, the ability to provide application-specific busbar systems while maintaining product quality, cost efficiency, and timely delivery remains a significant challenge for participants in the Europe busbar market.

EUROPE BUSBAR MARKET: COMMERCIAL USE CASES ACROSS INDUSTRIES

COMPANY USE CASE DESCRIPTION BENEFITS
company logo
Mersen was selected by Automotive Cells Company (ACC) to supply smart busbars for ACC's next-generation EV batteries. The busbars connect lithium-ion cells while also sensing electrical characteristics and communicating with the Battery Management System (BMS). Mersen and ACC collaborated for 18 months to develop a product tailored to ACC's requirements. The partnership created a long-term supply opportunity for Mersen, with the seven-year agreement potentially generating approximately USD 231.4 million in sales. It also strengthened Mersen's position in the European EV battery supply chain and demonstrated the increasing role of smart busbars in next-generation battery packs.
company logo
Molex announced a liquid-cooled busbar solution for AI data centers in 2026, addressing the increasing power and thermal management requirements of high-power-consuming AI data centers. The solution represents a move toward more integrated power distribution architectures designed specifically for next-generation data center infrastructure. The solution is expected to support efficient power distribution in high-power AI data centers while improving thermal management capabilities. Molex’s offering also demonstrates the potential for busbar manufacturers to move beyond component supply toward integrated power distribution solutions, potentially creating new opportunities for innovation and value addition in the busbar market.

Logos and trademarks shown above are the property of their respective owners. Their use here is for informational and illustrative purposes only.

MARKET ECOSYSTEM

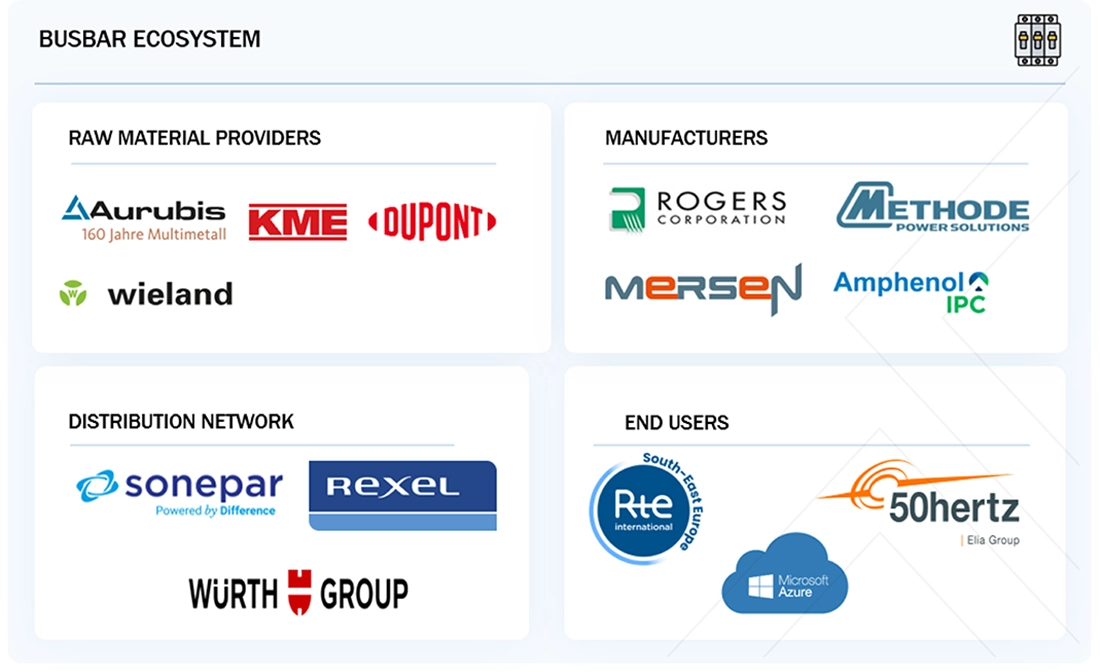
The Europe busbar market ecosystem comprises four key participant groups: raw material suppliers, manufacturers, distributors, and end-use industries. Their interconnected activities support the supply of reliable, high-quality, and sustainable electrical distribution solutions. The value chain is undergoing transformation driven by accelerating electrification and electric vehicle adoption, European decarbonization targets, expanding AI-driven data center infrastructure, circular economy initiatives, and the digitalization of power distribution. Advanced busbar trunking systems increasingly incorporate communication capabilities to transmit current measurements and diagnostic information to energy management systems and cloud-based platforms, enabling improved monitoring and operational efficiency. These developments are influencing product innovation toward lightweight materials, integrated sensors, and prefabricated modular designs. Meanwhile, supply chain relationships are evolving through strategic collaborations and longer-term agreements between manufacturers and major customers, including electric vehicle battery manufacturing facilities. Investment priorities are also expanding beyond conventional manufacturing toward recycled and low-carbon copper sourcing, digital monitoring solutions, and predictive maintenance capabilities, strengthening the industry's focus on sustainability, reliability, and efficient power distribution.

europe-busbar-market Ecosystem

Logos and trademarks shown above are the property of their respective owners. Their use here is for informational and illustrative purposes only.

MARKET SEGMENTS

europe-busbar-market Segments

Source: Secondary Research, Interviews with Experts, MarketsandMarkets Analysis

By Material

By material, aluminum is expected to register the highest CAGR of 6.8% during the forecast period.

By Power Rating

By power rating, the high segment is expected to register the highest CAGR of 7.2% during the forecast period.

By Insulation

By insulation, the laminated segment is expected to register the highest CAGR during the forecast period.

By Manufacturing Process

By manufacturing process, the flexible segment is expected to register the highest CAGR during the forecast period.

By End-Use Application

By end-use application, the data center segment is expected to register the highest CAGR during the forecast period.

REGION

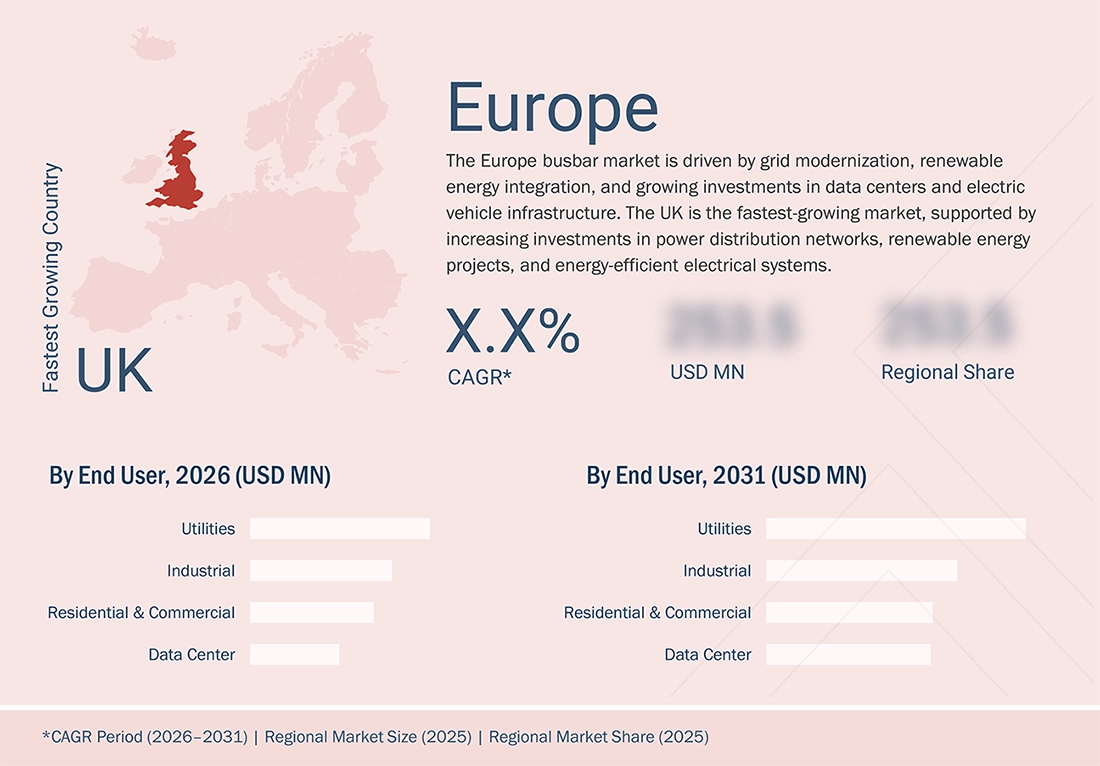
The UK is expected to register the highest CAGR of 7.2% during the forecast period.

The UK is expected to be the fastest-growing busbar market in Europe, registering the highest CAGR of 7.2% during the forecast period (2026–2031), driven by ongoing modernization of power distribution infrastructure, expansion of renewable energy integration, and increasing adoption of efficient copper and aluminum busbar systems. The UK market is supported by utility and industrial investments in low-, medium-, and high-voltage solutions, compact designs, and advanced thermal performance. Leading manufacturers are expanding their UK busbar portfolios with modular and high-current-capacity systems, while broader power distribution deployments demonstrate continued investment in grid modernization and industrial electrification. These developments are supporting the transition toward more reliable, efficient, and digitally integrated power distribution networks.

europe-busbar-market Region

EUROPE BUSBAR MARKET: COMPANY EVALUATION MATRIX

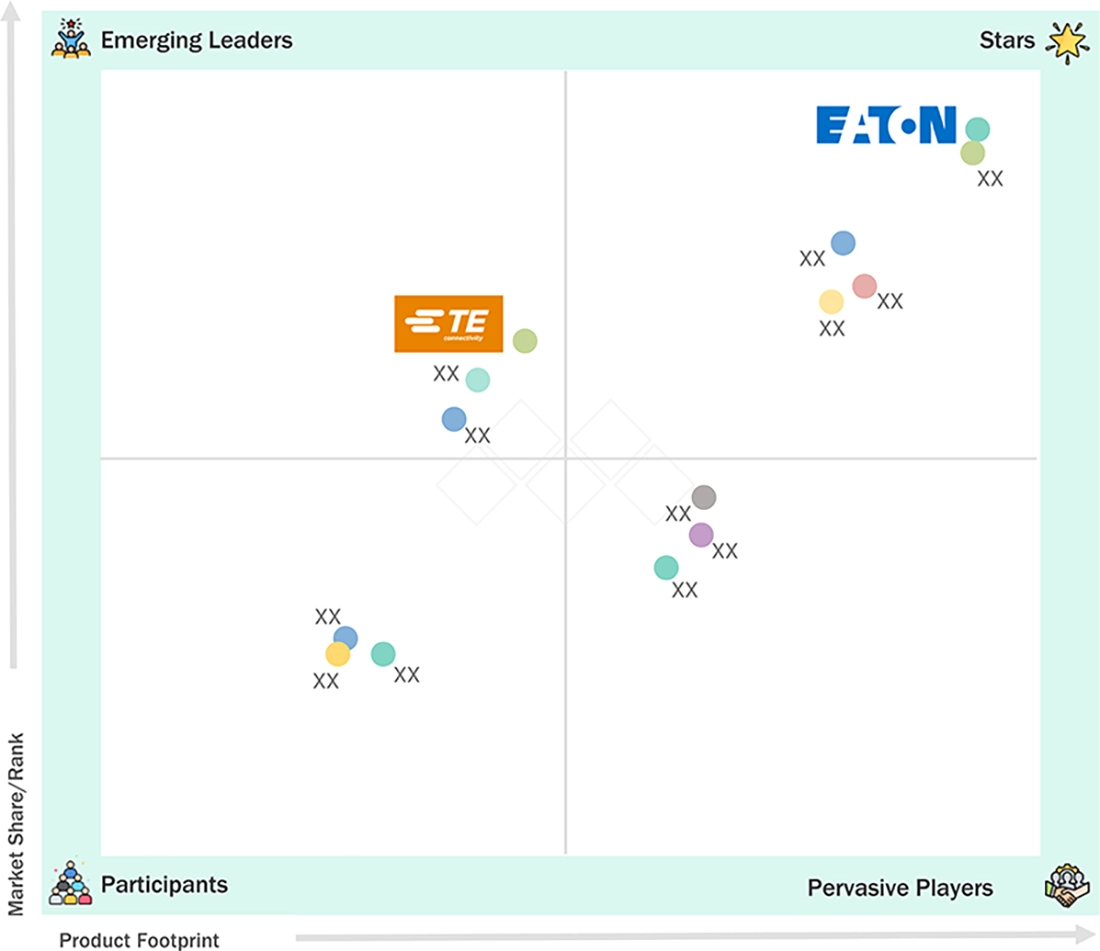
The Europe busbar market includes established power distribution and electrical infrastructure providers such as ABB Ltd., Siemens AG, Schneider Electric SE, Eaton Corporation, and Legrand SA, supported by broad busbar portfolios, material technologies, and utility relationships. ABB provides modular copper and aluminum busbar systems, high-current solutions, and integrated power distribution offerings, while Siemens offers low-, medium-, and high-voltage busbars with advanced thermal management and digital monitoring capabilities. Schneider Electric provides compact and high-performance busbar systems with improved load density and smart power-management features. Eaton and Legrand further expand the competitive landscape through versatile busbar designs, modular architectures, and solutions tailored for industrial, utility, and data center applications.

europe-busbar-market Evaluation Metrics

Source: Secondary Research, Interviews with Experts, MarketsandMarkets Analysis

KEY MARKET PLAYERS

  • ABB (Switzerland)
  • Schneider Electric (France)
  • Legrand (France)
  • Siemens (Germany)
  • Eaton (Ireland)
  • Mersen S.A. (France)
  • TE Connectivity (Ireland)
  • Rittal (Germany)
  • Wöhner GmbH & Co. KG (Germany)
  • EAE Electric (Turkey)
  • SVM (India)
  • Teknomega S.r.l. (Italy)
  • BKS Stromschienen AG (Switzerland)
  • MEGABARRE EUROPE SRL (Italy)
  • TOSUNlux (China)
  • Sefag Components AG (Switzerland)
  • Gindre (France)
  • Wenzhou YOFU Group Co., Ltd. (China)
  • Yueqing Gaoke Environmental Electric (China)
  • G AND N FORTUNE LIMITED (Hong Kong)
  • CTX Thermal Solutions GmbH (Germany)
  • GRAZIADIO & C. S.p.A. (Italy)
  • Anord Mardix (Ireland)
  • Incresol Engineering Solutions Pvt. (India)
  • Promet AG (Switzerland)

MARKET SCOPE

REPORT METRIC DETAILS
Market Size in 2025 (Value) USD 4.44 Billion
Market Size in 2026 (Value) USD 4.69 Billion
Market Forecast in 2031 (Value) USD 6.43 Billion
Growth Rate CAGR of 6.5% from 2026–2031
Years Considered 2022–2031
Base Year 2025
Forecast Period 2026–2031
Units Considered Value (USD Million/Billion)
Report Coverage Market size and forecast, company profiling, competitive landscape, market dynamics (drivers, restraints, opportunities, and challenges), technology trends, ecosystem analysis, commercial use cases, and regional analysis
Segments Covered
  • Material:
    • Copper
    • Aluminum
  • Insulation:
    • Laminated
    • Powder-Coated
    • Bare
  • Power Rating:
    • Low
    • Medium
    • High
  • Manufacturing Process:
    • Molded
    • Stamped
    • Hybrid
    • Flexible
  • End-Use Application:
    • Utilities
    • Industrial
    • Locomotive
    • Renewables
    • Data Centers
    • Automotive
    • Residential & Commercial
Regions Covered Germany, UK, France, Italy, and Rest of Europe

WHAT IS IN IT FOR YOU: EUROPE BUSBAR MARKET REPORT CONTENT GUIDE

europe-busbar-market Content Guide

DELIVERED CUSTOMIZATIONS

We have successfully delivered the following deep-dive customizations:

CLIENT REQUEST CUSTOMIZATION DELIVERED VALUE ADDS
Client requirement for Europe Busbar Market report Market sizing for busbars across key European countries and regions (Germany, UK, France, Italy, and Rest of Europe) Country-wise market attractiveness analysis, competitive landscape overview (Siemens, Schneider Electric, ABB, Legrand, Eaton, Rittal, Mersen, and others), and focus on high-growth applications such as data centers, renewable energy integration, EV/battery plants, and industrial manufacturing in high-growth economies (Poland, Netherlands, Spain)

RECENT DEVELOPMENTS

  • February 2026 : TE Connectivity finalized a strategic asset deal to acquire Phoenix Contact E-Mobility’s charging inlets business, which included key EV charging inlet assets. This acquisition enhanced TE’s position in electric vehicle power interconnection and supported the demand for high-current busbar and power distribution solutions in Europe.
  • November 2025 : Eaton agreed to acquire Boyd Corporation’s thermal business for approximately USD 9.5 billion. The acquisition would add liquid-cooling technologies for data centers and strengthen Eaton Corporation’s ability to provide integrated power and cooling solutions for AI infrastructure. Completion was expected in Q2 2026.
  • July 2025 : Legrand announced the acquisition of Amperio Project, a Swiss busbar specialist based in Murten, employing approximately 20 people and generating annual sales exceeding USD 4.5 million. The acquisition directly strengthened Legrand’s busbar portfolio and its capabilities in the European data center market, supporting its strategy to expand in segments associated with the energy and digital transition.
  • May 2025 : Rittal and Lenze entered into a technology partnership combining Rittal's RiLineX busbar platform with Lenze's i550 cabinet frequency inverters. The integration enabled compact mounting of inverters and associated fusing directly on the busbar board, helping reduce enclosure space requirements and simplify electrical panel assembly. The partnership targeted European machine-building, industrial automation, and plant engineering applications.


Table of Contents

checkmarkExclusive indicates content/data unique to MarketsandMarkets and not available with any competitors.

TITLE
PAGE NO
2
EXECUTIVE SUMMARY


25
3
PREMIUM INSIGHTS


29
4
MARKET OVERVIEW
Navigate market shifts with strategic retrofitting and modular solutions amid price volatility and competition.


34
 
4.1
INTRODUCTION


4.2
MARKET DYNAMICS


4.2.1
DRIVERS


4.2.1.1
EXPANSION OF DATA CENTERS AND HIGH-DENSITY COMPUTING


4.2.1.2
INCREASING INDUSTRIAL ELECTRIFICATION AND AUTOMATION


4.2.2
RESTRAINTS


4.2.2.1
VOLATILITY IN COPPER AND ALUMINUM PRICES


4.2.2.2
HIGH INITIAL INSTALLATION COSTS


4.2.3
OPPORTUNITIES


4.2.3.1
RETROFITTING OF AGING ELECTRICAL INFRASTRUCTURE


4.2.3.2
GROWING DEMAND FOR MODULAR AND DIGITALLY MONITORED BUSBAR SOLUTIONS


4.2.4
CHALLENGES


4.2.4.1
INTENSE COMPETITION AND CUSTOMIZATION REQUIREMENTS


4.3
UNMET NEEDS AND WHITE SPACES


4.4
INTERCONNECTED MARKETS AND CROSS-SECTOR OPPORTUNITIES


4.5
STRATEGIC MOVES BY TIER-1/2/3 PLAYERS


5
INDUSTRY TRENDS
Navigate competitive dynamics and emerging disruptions shaping the electric power grid industry landscape.


46
 
5.1
PORTER’S FIVE FORCES ANALYSIS


5.1.1
THREAT OF NEW ENTRANTS


5.1.2
THREAT OF SUBSTITUTES


5.1.3
BARGAINING POWER OF SUPPLIERS


5.1.4
BARGAINING POWER OF BUYERS


5.1.5
INTENSITY OF COMPETITIVE RIVALRY


5.2
MACROECONOMIC OUTLOOK


5.2.1
INTRODUCTION


5.2.2
GDP TRENDS AND FORECAST


5.2.3
ELECTRIC POWER GRID & INFRASTRUCTURE INDUSTRY TRENDS


5.3
SUPPLY CHAIN ANALYSIS


5.4
ECOSYSTEM ANALYSIS


5.5
PRICING ANALYSIS


5.5.1
AVERAGE SELLING PRICE TREND OF BUSBARS, BY VOLTAGE, 2022–2025


5.6
TRADE ANALYSIS


5.6.1
IMPORT SCENARIO (HS CODE 853690)


5.6.2
EXPORT SCENARIO (HS CODE 853690)


5.7
KEY CONFERENCES AND EVENTS, 2026–2027


5.8
TRENDS/DISRUPTIONS IMPACTING CUSTOMER BUSINESS


5.9
INVESTMENT AND FUNDING SCENARIO


5.10
CASE STUDY ANALYSIS


5.10.1
AUTOMOTIVE CELLS COMPANY SELECTS MERSEN TO SUPPLY SMART BUSBARS FOR NEXT-GENERATION EV BATTERIES


5.10.2
MOLEX DEVELOPS LIQUID-COOLED BUSBAR SOLUTION TO ADDRESS RISING POWER AND THERMAL MANAGEMENT DEMANDS IN AI DATA CENTERS


5.10.3
MERSEN PARTNERS WITH F&K DELVOTEC TO DEVELOP INFINI CELL BATTERY ASSEMBLY SOLUTION FOR HIGH-SPEED EV BATTERY ASSEMBLY


5.11
IMPACT OF US TARIFFS – EUROPE BUSBAR MARKET


5.11.1
INTRODUCTION


5.11.2
KEY TARIFF RATES


5.11.3
PRICE IMPACT ANALYSIS


5.11.4
IMPACT ON COUNTRIES/REGIONS


5.11.4.1
EUROPE


5.11.5
IMPACT ON KEY END-USE APPLICATIONS


6
TECHNOLOGICAL ADVANCEMENTS, AI-DRIVEN IMPACT, PATENTS, INNOVATIONS, AND FUTURE APPLICATIONS
AI-driven innovations redefine busbar technology, enhancing smart power distribution and market potential.


65
 
6.1
KEY TECHNOLOGIES


6.1.1
LOW-INDUCTANCE LAMINATED BUSBAR


6.1.2
FLEXIBLE AND BRAIDED BUSBARS


6.2
COMPLEMENTARY TECHNOLOGIES


6.2.1
SWITCHGEAR AND CIRCUIT PROTECTION


6.2.2
POWER MONITORING SENSORS


6.3
ADJACENT TECHNOLOGIES


6.3.1
FLEXIBLE BUSBAR CONNECTORS AND CABLE LINKS


6.3.2
INTEGRATED POWER MODULES


6.4
TECHNOLOGY/PRODUCT ROADMAP


6.4.1
SHORT-TERM (2026–2028) | MATERIAL DEVELOPMENT & PRODUCT ENHANCEMENT


6.4.2
MID-TERM (2028–2031) | HIGH-POWER DENSITY & ADVANCED POWER ELECTRONICS


6.4.3
LONG-TERM (2031–2035+) | SMART, INTEGRATED & NEXT-GENERATION POWER DISTRIBUTION


6.5
PATENT ANALYSIS


6.6
FUTURE APPLICATIONS


6.7
IMPACT OF AI/GEN AI ON BUSBAR MARKET


6.7.1
TOP USE CASES AND MARKET POTENTIAL


6.7.2
BEST PRACTICES FOLLOWED BY OEMS IN EUROPE BUSBAR MARKET


6.7.3
CASE STUDIES RELATED TO AI/GEN AI IMPLEMENTATION IN BUSBAR MARKET


6.7.4
INTERCONNECTED ECOSYSTEM AND IMPACT ON MARKET PLAYERS


6.7.5
CLIENTS’ READINESS TO ADOPT AI/GEN AI-INTEGRATED BUSBARS


6.8
SUCCESS STORIES AND REAL-WORLD APPLICATIONS


7
REGULATORY LANDSCAPE AND SUSTAINABILITY INITIATIVES
Navigate complex regulations to drive impactful sustainability initiatives and secure eco-certifications.


78
 
7.1
REGIONAL REGULATIONS AND COMPLIANCE


7.1.1
REGULATORY BODIES, GOVERNMENT AGENCIES, AND OTHER ORGANIZATIONS


7.1.2
INDUSTRY STANDARDS


7.2
SUSTAINABILITY INITIATIVES


7.3
IMPACT OF REGULATORY POLICIES ON SUSTAINABILITY INITIATIVES


7.4
CERTIFICATIONS, LABELING, AND ECO-STANDARDS


8
CUSTOMER LANDSCAPE AND BUYER BEHAVIOR
Unlocking stakeholder influence and unmet needs to drive profitable customer engagement strategies.


82
 
8.1
DECISION-MAKING PROCESS


8.2
KEY STAKEHOLDERS INVOLVED IN BUYING PROCESS AND THEIR EVALUATION CRITERIA


8.2.1
KEY STAKEHOLDERS IN BUYING PROCESS


8.2.2
BUYING CRITERIA


8.3
ADOPTION BARRIERS AND INTERNAL CHALLENGES


8.4
UNMET NEEDS OF VARIOUS END-USE INDUSTRIES


8.5
MARKET PROFITABILITY


9
EUROPE BUSBAR MARKET, BY MATERIAL
Market Size & Growth Rate Forecast Analysis to 2031 in USD Million | 2 Data Tables


88
 
9.1
INTRODUCTION


9.2
COPPER


9.2.1
HIGH CONDUCTIVITY, THERMAL STABILITY, AND CORROSION RESISTANCE TO DRIVE COPPER BUSBAR GROWTH


9.3
ALUMINUM


9.3.1
LIGHTWEIGHT ECONOMICS AND RENEWABLE INFRASTRUCTURE EXPANSION TO DRIVE ALUMINUM BUSBAR ADOPTION


10
EUROPE BUSBAR MARKET, BY POWER RATING
Market Size & Growth Rate Forecast Analysis to 2031 in USD Million | 2 Data Tables


91
 
10.1
INTRODUCTION


10.2
LOW


10.2.1
BUILDING RENOVATION AND ELECTRIFICATION OF RESIDENTIAL AND COMMERCIAL INFRASTRUCTURE TO SUSTAIN SEGMENTAL GROWTH


10.3
MEDIUM


10.3.1
INDUSTRIAL MODERNIZATION AND COMMERCIAL INFRASTRUCTURE EXPANSION TO DRIVE MEDIUM-POWER BUSBAR DEMAND


10.4
HIGH


10.4.1
ELECTRICITY GRID EXPANSION, RENEWABLE ENERGY INTEGRATION, AND DATA CENTER DEVELOPMENT TO ACCELERATE HIGH-POWER BUSBAR DEMAND


11
EUROPE BUSBAR MARKET, BY INSULATION
Market Size & Growth Rate Forecast Analysis to 2031 in USD Million | 2 Data Tables


96
 
11.1
INTRODUCTION


11.2
LAMINATED


11.2.1
LOW-INDUCTANCE ARCHITECTURE AND EUROPEAN ELECTROMOBILITY DEMAND TO SUPPORT SEGMENT GROWTH


11.3
POWDER-COATED


11.3.1
ELECTRIFICATION, RENEWABLE ENERGY, AND SWITCHGEAR MODERNIZATION TO ACCELERATE POWDER-COATED BUSBAR ADOPTION


11.4
BARE


11.4.1
COST EFFICIENCY AND THERMAL ACCESSIBILITY TO SUSTAIN BARE BUSBAR DEMAND IN SWITCHGEAR AND SUBSTATIONS


12
EUROPE BUSBAR MARKET, BY MANUFACTURING PROCESS
Market Size & Growth Rate Forecast Analysis to 2031 in USD Million | 2 Data Tables


100
 
12.1
INTRODUCTION


12.2
MOLDED


12.2.1
RESIN ENCAPSULATION AND DURABLE INSULATION TO SUPPORT MOLDED BUSBAR DEMAND


12.3
STAMPED


12.3.1
PRECISION AND HIGH-VOLUME MANUFACTURING TO SUSTAIN STAMPED BUSBAR LEADERSHIP


12.4
HYBRID


12.4.1
COPPER–ALUMINUM COMBINATIONS AND INTEGRATED MANUFACTURING TO SUPPORT HYBRID BUSBARS


12.5
FLEXIBLE


12.5.1
EV BATTERY INTEGRATION AND COMPACT POWER DISTRIBUTION TO DRIVE FLEXIBLE BUSBAR GROWTH


13
EUROPE BUSBAR MARKET, BY END-USE APPLICATION
Market Size & Growth Rate Forecast Analysis to 2031 in USD Million | 15 Data Tables


104
 
13.1
INTRODUCTION


13.2
UTILITIES


13.2.1
GRID MODERNIZATION AND NETWORK EXPANSION TO SUSTAIN UTILITIES SEGMENT


13.3
INDUSTRIAL


13.3.1
INDUSTRIAL ELECTRIFICATION AND MANUFACTURING UPGRADES TO SUPPORT BUSBAR DEMAND


13.4
LOCOMOTIVE


13.4.1
RAILWAY ELECTRIFICATION AND TRACTION-SYSTEM UPGRADES TO SUSTAIN BUSBAR DEMAND


13.5
RENEWABLES


13.5.1
WIND AND SOLAR DEPLOYMENT TO INCREASE DEMAND FOR BUSBARS IN GENERATION AND GRID-CONNECTION SYSTEMS


13.6
DATA CENTERS


13.6.1
EXPANSION OF AI AND CLOUD INFRASTRUCTURE TO ACCELERATE DEMAND FOR HIGH-CAPACITY POWER DISTRIBUTION


13.7
AUTOMOTIVE


13.7.1
VEHICLE ELECTRIFICATION AND POWERTRAIN DEVELOPMENT TO SUPPORT SPECIALIZED BUSBAR DEMAND


13.8
RESIDENTIAL & COMMERCIAL


13.8.1
BUILDING ELECTRIFICATION AND RENOVATION TO SUPPORT LOW-VOLTAGE DISTRIBUTION SYSTEMS


14
EUROPE BUSBAR MARKET, BY COUNTRY
Market Size & Growth Rate Forecast Analysis to 2031 in USD Million | 12 Data Tables


114
 
14.1
INTRODUCTION


14.2
GERMANY


14.2.1
GRID REINFORCEMENT, RENEWABLE INTEGRATION, AND DATA CENTER GROWTH TO DRIVE GERMANY BUSBAR SEGMENT


14.3
FRANCE


14.3.1
GRID REINFORCEMENT, NUCLEAR POWER INFRASTRUCTURE, AND DATA CENTER GROWTH TO SUPPORT SUSTAINED BUSBAR DEMAND


14.4
UK


14.4.1
NETWORK INVESTMENT, ELECTRIFICATION, AND DIGITAL INFRASTRUCTURE EXPANSION TO ACCELERATE UK BUSBAR MARKET GROWTH


14.5
ITALY


14.5.1
RENEWABLE INTEGRATION, UTILITY INFRASTRUCTURE, AND DATA CENTER INVESTMENT TO STRENGTHEN ITALY’S BUSBAR MARKET


14.6
REST OF EUROPE


14.6.1
RENEWABLE ENERGY BUILDOUT, GRID REINFORCEMENT, AND EMERGING DATA CENTER HUBS TO SUPPORT GROWTH ACROSS REST OF EUROPE


15
COMPETITIVE LANDSCAPE
Uncover key players' strategic moves shaping market dominance and emerging leaders' rise.


121
 
15.1
OVERVIEW


15.2
KEY PLAYER COMPETITIVE STRATEGIES/RIGHT TO WIN, 2023–2026


15.3
MARKET SHARE ANALYSIS, 2025


15.4
REVENUE ANALYSIS, 2021–2025


15.5
COMPANY EVALUATION MATRIX: KEY PLAYERS, 2025


15.5.1
STARS


15.5.2
EMERGING LEADERS


15.5.3
PERVASIVE PLAYERS


15.5.4
PARTICIPANTS


15.5.5
COMPANY FOOTPRINT: KEY PLAYERS, 2025


15.5.5.1
REGION FOOTPRINT


15.5.5.2
MATERIAL FOOTPRINT


15.5.5.3
INSULATION FOOTPRINT


15.5.5.4
POWER RATING FOOTPRINT


15.6
COMPANY EVALUATION MATRIX: STARTUPS/SMES, 2025


15.6.1
PROGRESSIVE COMPANIES


15.6.2
RESPONSIVE COMPANIES


15.6.3
DYNAMIC COMPANIES


15.6.4
STARTING BLOCKS


15.6.5
COMPETITIVE BENCHMARKING: STARTUPS/SMES, 2025


15.6.5.1
DETAILED LIST OF KEY STARTUPS/SMES


15.6.5.2
COMPETITIVE BENCHMARKING OF KEY STARTUPS/SMES


15.7
COMPANY VALUATION AND FINANCIAL METRICS


15.8
BRAND COMPARISON


15.9
COMPETITIVE SCENARIO


15.9.1
PRODUCT LAUNCHES


15.9.2
DEALS


15.9.3
EXPANSIONS


15.9.4
OTHER DEVELOPMENT


16
COMPANY PROFILES
In-depth Company Profiles of Leading Market Players with detailed Business Overview, Product and Service Portfolio, Recent Developments, and Unique Analyst Perspective (MnM View)


145
 
16.1
KEY PLAYERS


16.1.1
ABB


16.1.1.1
BUSINESS OVERVIEW


16.1.1.2
PRODUCTS/SOLUTIONS/SERVICES OFFERED


16.1.1.3
RECENT DEVELOPMENTS


16.1.1.3.1
DEALS


16.1.1.3.2
EXPANSIONS


16.1.1.3.3
OTHER DEVELOPMENTS


16.1.1.4
MNM VIEW


16.1.1.4.1
KEY STRENGTHS/RIGHT TO WIN


16.1.1.4.2
STRATEGIC CHOICES


16.1.1.4.3
WEAKNESSES/COMPETITIVE THREATS


16.1.2
SCHNEIDER ELECTRIC


16.1.3
LEGRAND


16.1.4
SIEMENS


16.1.5
EATON CORPORATION


16.1.6
RITTAL GMBH & CO. KG


16.1.7
TE CONNECTIVITY


16.1.8
MERSEN SA


16.1.9
WOHNER GMBH & CO. KG


16.1.10
EAE ELECTRIC


16.1.11
TEKNOMEGA S.R.L.


16.1.12
GINDRE


16.1.13
ANORD MARDIX


16.1.14
NAXSO BBT


16.1.15
BKS STROMSCHIENEN AG


16.2
OTHER PLAYERS


16.2.1
SVM


16.2.2
MEGABARRE EUROPE SRL


16.2.3
INCRESOL ENGINEERING SOLUTIONS PVT. LTD.


16.2.4
WENZHOU YOPU GROUP CO., LTD.


16.2.5
TOSUNLUX


16.2.6
YUEQING GAOKE ENVIRONMENTAL ELECTRIC CO., LTD.


16.2.7
G AND N FORTUNE LIMITED


16.2.8
CTX THERMAL SOLUTIONS GMBH


16.2.9
GRAZIADIO & C. S.P.A.


16.2.10
SEFAG COMPONENTS AG


17
RESEARCH METHODOLOGY


203
 
17.1
RESEARCH DATA


17.2
SECONDARY AND PRIMARY RESEARCH


17.2.1
SECONDARY DATA


17.2.1.1
LIST OF KEY SECONDARY SOURCES


17.2.1.2
KEY DATA FROM SECONDARY SOURCES


17.2.2
PRIMARY DATA


17.2.2.1
LIST OF PRIMARY INTERVIEW PARTICIPANTS


17.2.2.2
KEY INDUSTRY INSIGHTS


17.2.2.3
BREAKDOWN OF PRIMARIES


17.2.2.4
KEY DATA FROM PRIMARY SOURCES


17.3
MARKET SIZE ESTIMATION


17.3.1
BOTTOM-UP APPROACH


17.3.2
TOP-DOWN APPROACH


17.3.3
MARKET SIZE CALCULATION FOR BASE YEAR


17.3.3.1
DEMAND-SIDE ANALYSIS


17.3.3.1.1
DEMAND-SIDE ASSUMPTIONS


17.3.3.1.2
DEMAND-SIDE CALCULATIONS


17.3.3.2
SUPPLY-SIDE ANALYSIS


17.4
DATA TRIANGULATION


17.5
RESEARCH LIMITATIONS


17.6
RESEARCH LIMITATIONS


17.7
RISK ANALYSIS


18
APPENDIX


213
 
18.1
INSIGHTS FROM INDUSTRY EXPERTS


18.2
DISCUSSION GUIDE


18.3
KNOWLEDGESTORE: MARKETSANDMARKETS’ SUBSCRIPTION PORTAL


18.4
CUSTOMIZATION OPTIONS


18.5
RELATED REPORTS


18.6
AUTHOR DETAILS


LIST OF TABLES


TABLE 1
INTERCONNECTED MARKETS


TABLE 2
KEY MOVES AND STRATEGIC FOCUS OF TIER-1/2/3 PLAYERS


TABLE 3
IMPACT OF PORTER’S FIVE FORCES ANALYSIS


TABLE 4
GDP TRENDS AND FORECAST OF MAJOR ECONOMIES, 2023–2030 (USD BILLION)


TABLE 5
EUROPE ANNUAL GRID INFRASTRUCTURE INVESTMENT, 2020–2030 (USD BILLION)


TABLE 6
ROLE OF COMPANIES IN EUROPE BUSBAR ECOSYSTEM


TABLE 7
AVERAGE SELLING PRICE TREND OF BUSBARS, BY VOLTAGE, 2022–2025 (USD/KG)


TABLE 8
IMPORT DATA FOR HS CODE 853690 -COMPLIANT PRODUCTS, BY COUNTRY, 2022–2025 (USD THOUSAND)


TABLE 9
EXPORT DATA FOR HS CODE 853690 -COMPLIANT PRODUCTS, BY COUNTRY, 2022–2025 (USD THOUSAND)


TABLE 10
LIST OF KEY CONFERENCES AND EVENTS, 2026–2027


TABLE 11
MERSEN GROUP DEVELOPS SMART BUSBARS FOR NEXT-GENERATION EV BATTERIES OF AUTOMOTIVE CELLS COMPANY


TABLE 12
MOLEX PROVIDES LIQUID-COOLED BUSBAR TO SUPPORT EFFICIENT POWER DISTRIBUTION IN HIGH-POWER AI DATA CENTERS


TABLE 13
MERSEN UNITES WITH F&K DELVOTEC TO DEVELOP INFINI CELL BATTERY ASSEMBLY SOLUTION TO OPTIMIZE EV BATTERY ASSEMBLY


TABLE 14
US-ADJUSTED RECIPROCAL TARIFF RATES


TABLE 15
EXPECTED CHANGE IN PRICES AND POTENTIAL IMPACT ON MARKET PLAYERS DUE TO TARIFFS


TABLE 16
LIST OF KEY PATENTS, 2025–2026


TABLE 17
AI-DRIVEN DATA CENTERS & HIGH-DENSITY COMPUTING


TABLE 18
RENEWABLE ENERGY & POWER CONVERSION SYSTEMS


TABLE 19
MICROGRIDS & VIRTUAL POWER PLANTS (VPPS)


TABLE 20
GRID-SCALE ENERGY STORAGE & BATTERY SYSTEMS


TABLE 21
NEXT-GENERATION INDUSTRIAL & POWER ELECTRONICS


TABLE 22
MAJOR USE CASES AND MARKET POTENTIAL


TABLE 23
BEST PRACTICES FOLLOWED BY COMPANIES


TABLE 24
CASE STUDIES RELATED TO AI/GEN AI IMPLEMENTATION


TABLE 25
INTERCONNECTED ECOSYSTEM AND IMPACT ON EUROPE BUSBAR MARKET PLAYERS


TABLE 26
EUROPE: REGULATORY BODIES, GOVERNMENT AGENCIES, AND OTHER ORGANIZATIONS


TABLE 27
GLOBAL INDUSTRY STANDARDS


TABLE 28
CERTIFICATIONS, LABELING, AND ECO-STANDARDS IN BUSBAR MARKET


TABLE 29
INFLUENCE OF STAKEHOLDERS ON BUYING PROCESS FOR THREE MAJOR END-USE INDUSTRIES (%)


TABLE 30
BUYING CRITERIA FOR THREE MAJOR END-USE INDUSTRIES


TABLE 31
UNMET NEEDS, BY END-USE INDUSTRY


TABLE 32
EUROPE BUSBAR MARKET, BY MATERIAL, 2022–2025 (USD MILLION)


TABLE 33
EUROPE BUSBAR MARKET, BY MATERIAL, 2026–2031 (USD MILLION)


TABLE 34
EUROPE BUSBAR MARKET, BY POWER RATING, 2022–2025 (USD MILLION)


TABLE 35
EUROPE BUSBAR MARKET, BY POWER RATING, 2026–2031 (USD MILLION)


TABLE 36
EUROPE BUSBAR MARKET, BY INSULATION, 2022–2025 (USD MILLION)


TABLE 37
EUROPE BUSBAR MARKET, BY INSULATION, 2026–2031 (USD MILLION)


TABLE 38
BUSBAR MARKET, BY MANUFACTURING PROCESS, 2022–2025 (USD MILLION)


TABLE 39
BUSBAR MARKET, BY MANUFACTURING PROCESS, 2026–2031 (USD MILLION)


TABLE 40
EUROPE BUSBAR MARKET, BY END-USE APPLICATION, 2022–2025 (USD MILLION)


TABLE 41
EUROPE BUSBAR MARKET, BY END-USE APPLICATION, 2026–2031 (USD MILLION)


TABLE 42
UTILITIES : EUROPE BUSBAR MARKET, BY COUNTRY, 2022–2025 (USD MILLION)


TABLE 43
UTILITIES :EUROPE BUSBAR MARKET, BY COUNTRY, 2026–2031 (USD MILLION)


TABLE 44
INDUSTRIAL: EUROPE BUSBAR MARKET, BY COUNTRY, 2022–2025 (USD MILLION)


TABLE 45
INDUSTRIAL: EUROPE BUSBAR MARKET, BY COUNTRY, 2026–2031 (USD MILLION)


TABLE 46
LOCOMOTIVE: EUROPE BUSBAR MARKET, BY COUNTRY, 2022–2025 (USD MILLION)


TABLE 47
LOCOMOTIVE: EUROPE BUSBAR MARKET, BY COUNTRY, 2026–2031 (USD MILLION)


TABLE 48
RENEWABLES: EUROPE BUSBAR MARKET, BY COUNTRY, 2022–2025 (USD MILLION)


TABLE 49
RENEWABLES: EUROPE BUSBAR MARKET, BY COUNTRY, 2026–2031 (USD MILLION)


TABLE 50
DATA CENTERS: EUROPE BUSBAR MARKET, BY COUNTRY, 2022–2025 (USD MILLION)


TABLE 51
DATA CENTERS: EUROPE BUSBAR MARKET, BY COUNTRY, 2026–2031 (USD MILLION)


TABLE 53
AUTOMOTIVE: EUROPE BUSBAR MARKET, BY COUNTRY, 2026–2031 (USD MILLION)


TABLE 54
RESIDENTIAL & COMMERCIAL: EUROPE BUSBAR MARKET, BY COUNTRY, 2022–2025 (USD MILLION)


TABLE 55
RESIDENTIAL & COMMERCIAL: EUROPE BUSBAR MARKET, BY COUNTRY, 2026–2031 (USD MILLION)


TABLE 56
EUROPE BUSBAR MARKET, BY COUNTRY, 2022–2025 (USD MILLION)


TABLE 57
EUROPE BUSBAR MARKET, BY COUNTRY, 2026–2031 (USD MILLION)


TABLE 58
GERMANY BUSBAR MARKET, BY END-USE APPLICATION, 2022–2025 (USD MILLION)


TABLE 59
GERMANY BUSBAR MARKET, BY END-USE APPLICATION, 2026–2031 (USD MILLION)


TABLE 60
FRANCE BUSBAR MARKET, BY END-USE APPLICATION, 2022–2025 (USD MILLION)


TABLE 61
FRANCE BUSBAR MARKET, BY END-USE APPLICATION, 2026–2031 (USD MILLION)


TABLE 62
UK BUSBAR MARKET, BY END-USE APPLICATION, 2022–2025 (USD MILLION)


TABLE 63
UK BUSBAR MARKET, BY END-USE APPLICATION, 2026–2031 (USD MILLION)


TABLE 64
ITALY BUSBAR MARKET, BY END-USE APPLICATION, 2022–2025 (USD MILLION)


TABLE 65
ITALY BUSBAR MARKET, BY END-USE APPLICATION, 2026–2031 (USD MILLION)


TABLE 66
REST OF EUROPE BUSBAR MARKET, BY END-USE APPLICATION, 2022–2025 (USD MILLION)


TABLE 67
REST OF EUROPE BUSBAR MARKET, BY END-USE APPLICATION, 2026–2031 (USD MILLION)


TABLE 68
EUROPEAN BUSBAR MARKET: OVERVIEW OF STRATEGIES ADOPTED BY KEY PLAYERS, JANUARY 2022–OCTOBER 2026


TABLE 69
EUROPE BUSBAR MARKET: DEGREE OF COMPETITION, 2025


TABLE 70
BUSBAR MARKET: REGION FOOTPRINT


TABLE 71
BUSBAR MARKET: MATERIAL FOOTPRINT


TABLE 72
BUSBAR MARKET: INSULATION FOOTPRINT


TABLE 73
BUSBAR MARKET: POWER RATING FOOTPRINT


TABLE 74
EUROPE BUSBAR MARKET: DETAILED LIST OF KEY STARTUPS/SMES


TABLE 75
EUROPE BUSBAR MARKET: COMPETITIVE BENCHMARKING OF KEY STARTUPS/SMES


TABLE 76
EUROPE BUSBAR MARKET: PRODUCT LAUNCHES, JANUARY 2023–JULY 2026


TABLE 77
EUROPE BUSBAR MARKET: DEALS, JANUARY 2023–JULY 2026


TABLE 78
EUROPE BUSBAR MARKET: EXPANSIONS, JANUARY 2023–JULY 2026


TABLE 80
ABB: COMPANY OVERVIEW


TABLE 81
ABB: PRODUCTS/SOLUTIONS/SERVICES OFFERED


TABLE 82
ABB: DEALS


TABLE 83
ABB: EXPANSIONS


TABLE 84
ABB: OTHER DEVELOPMENTS


TABLE 85
SCHNEIDER ELECTRIC: COMPANY OVERVIEW


TABLE 86
SCHNEIDER ELECTRIC: PRODUCTS/SOLUTIONS/SERVICES OFFERED


TABLE 87
SCHNEIDER ELECTRIC: EXPANSIONS


TABLE 88
SCHNEIDER ELECTRIC: OTHER DEVELOPMENTS


TABLE 89
LEGRAND: COMPANY OVERVIEW


TABLE 90
LEGRAND: PRODUCTS/SOLUTIONS/SERVICES OFFERED


TABLE 91
LEGRAND: DEALS


TABLE 92
LEGRAND: EXPANSIONS


TABLE 93
SIEMENS: COMPANY OVERVIEW


TABLE 94
SIEMENS: PRODUCTS/SOLUTIONS/SERVICES OFFERED


TABLE 95
SIEMENS: DEALS


TABLE 96
SIEMENS: EXPANSION


TABLE 97
SIEMENS: DEVELOPMENT TYPE


TABLE 98
EATON CORPORATION: BUSINESS OVERVIEW


TABLE 99
EATON CORPORATION: DEALS


TABLE 100
EATON CORPORATION: EXPANSIONS


TABLE 101
EATON CORPORATION: OTHER DEVELOPMENTS


TABLE 102
RITTAL GMBH & CO. KG: COMPANY OVERVIEW


TABLE 103
RITTAL GMBH & CO. KG: PRODUCTS/SOLUTIONS/SERVICES OFFERED


TABLE 104
RITTAL GMBH & CO. KG: DEALS


TABLE 105
RITTAL GMBH & CO. KG: EXPANSIONS


TABLE 106
TE CONNECTIVITY: COMPANY OVERVIEW


TABLE 107
TE CONNECTIVITY: PRODUCTS/SOLUTIONS/SERVICES OFFERED


TABLE 108
TE CONNECTIVITY: DEALS


TABLE 109
TE CONNECTIVITY: EXPANSIONS


TABLE 110
MERSEN: COMPANY OVERVIEW


TABLE 111
MERSEN: PRODUCTS OFFERED


TABLE 112
MERSEN: EXPANSION


TABLE 113
MERSEN: PRODUCT LAUNCH


TABLE 114
MERSEN: DEALS


TABLE 115
WOHNER GMBH & CO. KG: COMPANY OVERVIEW


TABLE 116
WOHNER GMBH & CO. KG: PRODUCTS/SOLUTIONS/SERVICES OFFERED


TABLE 117
WOHNER GMBH & CO. KG: EXPANSIONS AND DEALS


TABLE 118
EAE ELECTRIC: COMPANY OVERVIEW


TABLE 119
EAE ELECTRIC: PRODUCTS/SOLUTIONS/SERVICES OFFERED


TABLE 120
TEKNOMEGA S.R.L.: COMPANY OVERVIEW


TABLE 121
TEKNOMEGA S.R.L.: PRODUCTS/SOLUTIONS/SERVICES OFFERED


TABLE 122
GINDRE: COMPANY OVERVIEW


TABLE 123
GINDRE: PRODUCTS/SOLUTIONS/SERVICES OFFERED


TABLE 124
ANORD MARDIX: COMPANY OVERVIEW


TABLE 125
ANORD MARDIX: PRODUCTS/SOLUTIONS/SERVICES OFFERED


TABLE 126
NAXSO BBT: COMPANY OVERVIEW


TABLE 127
NAXSO BBT: PRODUCTS/SOLUTIONS/SERVICES OFFERED


TABLE 128
BKS STROMSCHIENEN AG: COMPANY OVERVIEW


TABLE 129
BKS STROMSCHIENEN AG: PRODUCTS/SOLUTIONS/SERVICES OFFERED


TABLE 130
KEY SECONDARY SOURCES


TABLE 131
PRIMARY INTERVIEW PARTICIPANTS


TABLE 132
DATA CAPTURED FROM PRIMARY SOURCES


TABLE 133
EUROPE BUSBAR MARKET: RISK ANALYSIS


LIST OF FIGURES


FIGURE 1
EUROPE BUSBAR MARKET SEGMENTATION AND REGIONAL SCOPE


FIGURE 2
EUROPE BUSBAR MARKET SCENARIO


FIGURE 3
EUROPE BUSBAR MARKET SIZE, 2022–2031 (USD MILLION)


FIGURE 4
DISRUPTIONS INFLUENCING GROWTH OF EUROPE BUSBAR MARKET


FIGURE 5
HIGH-GROWTH SEGMENTS IN EUROPE BUSBAR MARKET, 2026–2031


FIGURE 6
UK TO REGISTER HIGHEST CAGR DURING FORECAST PERIOD


FIGURE 7
POWER GRID MODERNIZATION, RENEWABLE ENERGY INTEGRATION, AND DATA CENTER EXPANSION TO DRIVE EUROPE BUSBAR MARKET GROWTH


FIGURE 8
LOW AND REST OF EUROPE ACCOUNTED FOR LARGEST MARKET SHARE IN 2025


FIGURE 9
COPPER MATERIAL EUROPE BUSBAR SEGMENT TO DOMINATE EUROPE BUSBAR MARKET FROM 2026 TO 2031


FIGURE 10
LOW SEGMENT TO HOLD LARGEST MARKET SHARE IN 2026 AND 2031


FIGURE 11
BARE SEGMENT TO HOLD LARGEST MARKET SHARE IN 2026 AND 2031


FIGURE 12
STAMPED SEGMENT TO HOLD LARGEST MARKET SHARE IN 2026 AND 2031


FIGURE 13
DATA CENTER SEGMENT TO EXHIBIT HIGHEST CAGR BETWEEN 2026 AND 2031


FIGURE 14
UK TO REGISTER HIGHEST CAGR IN EUROPE BUSBAR MARKET DURING FORECAST PERIOD


FIGURE 15
DRIVERS, RESTRAINTS, OPPORTUNITIES, AND CHALLENGES


FIGURE 16
EU DATA CENTER ELECTRICITY DEMAND: 2024 VS. 2030


FIGURE 17
EU FINAL ENERGY CONSUMPTION BY ENERGY TYPE


FIGURE 18
COPPER PRICE FLUCTUATION IN EUROPE, 2025 (USD/METRIC TON)


FIGURE 19
PORTER’S FIVE FORCES ANALYSIS


FIGURE 20
BUSBAR SUPPLY CHAIN ANALYSIS


FIGURE 21
BUSBAR ECOSYSTEM


FIGURE 22
ASP TREND OF BUSBARS, BY VOLTAGE, 2022–2025


FIGURE 23
IMPORT DATA FOR HS CODE 853690 -COMPLIANT PRODUCTS FOR TOP FIVE COUNTRIES, 2022–2025


FIGURE 24
EXPORT DATA FOR HS CODE 853690 -COMPLIANT PRODUCTS FOR TOP FIVE COUNTRIES, 2022–2025


FIGURE 25
TRENDS/DISRUPTIONS INFLUENCING CUSTOMER BUSINESS


FIGURE 26
INVESTMENT AND FUNDING SCENARIO, 2025


FIGURE 27
PATENTS GRANTED AND APPLIED, 2016–2026


FIGURE 28
FUTURE APPLICATIONS OF BUSBARS


FIGURE 29
SUCCESS STORIES AND REAL-WORLD APPLICATIONS OF BUSBARS


FIGURE 30
DECISION-MAKING FACTORS IN BUSBAR MARKET


FIGURE 31
INFLUENCE OF STAKEHOLDERS ON BUYING PROCESS FOR TOP THREE END-USE INDUSTRIES


FIGURE 32
KEY BUYING CRITERIA FOR TOP THREE END-USE INDUSTRIES


FIGURE 33
ADOPTION BARRIERS AND INTERNAL CHALLENGES IN BUSBAR MARKET


FIGURE 34
EUROPE BUSBAR MARKET, BY MATERIAL, 2025


FIGURE 35
BROAD BUILDING-LEVEL DISTRIBUTION USE TO SUSTAIN LOW-POWER BUSBAR LEADERSHIP IN 2025


FIGURE 36
COST EFFICIENCY AND HEAT DISSIPATION TO SUSTAIN BARE BUSBAR LEADERSHIP IN 2025


FIGURE 37
PRECISION, HIGH-VOLUME PRODUCTION TO SUSTAIN STAMPED BUSBAR LEADERSHIP IN 2025


FIGURE 38
GRID MODERNIZATION AND NETWORK INVESTMENT TO SUSTAIN UTILITIES LEADERSHIP IN 2025


FIGURE 39
MARKET SHARE ANALYSIS OF COMPANIES OFFERING BUSBARS IN EUROPE, 2025


FIGURE 40
EUROPEAN BUSBAR MARKET: REVENUE ANALYSIS OF TOP FIVE PLAYERS, 2021–2025


FIGURE 41
EUROPE BUSBAR MARKET: COMPANY EVALUATION MATRIX (KEY PLAYERS), 2025


FIGURE 42
EUROPE BUSBAR MARKET: COMPANY FOOTPRINT


FIGURE 43
EUROPE BUSBAR MARKET: COMPANY EVALUATION MATRIX (STARTUPS/SMES), 2025


FIGURE 44
COMPANY VALUATION


FIGURE 45
FINANCIAL METRICS (EV/EBITDA)


FIGURE 46
BRAND COMPARISON OF KEY VENDORS


FIGURE 47
ABB: COMPANY SNAPSHOT


FIGURE 48
SCHNEIDER ELECTRIC: COMPANY SNAPSHOT


FIGURE 49
LEGRAND: COMPANY SNAPSHOT


FIGURE 50
SIEMENS: COMPANY SNAPSHOT


FIGURE 51
EATON CORPORATION: COMPANY SNAPSHOT


FIGURE 52
TE CONNECTIVITY: COMPANY SNAPSHOT


FIGURE 53
MERSEN: COMPANY SNAPSHOT


FIGURE 54
EUROPE BUSBAR MARKET: RESEARCH DESIGN


FIGURE 55
DATA CAPTURED FROM SECONDARY SOURCES


FIGURE 56
CORE FINDINGS FROM INDUSTRY EXPERTS


FIGURE 57
BREAKDOWN OF PRIMARY INTERVIEWS: BY COMPANY TYPE, DESIGNATION, AND COUNTRY


FIGURE 58
KEY METRICS CONSIDERED TO ANALYZE DEMAND EUROPE BUSBAR MARKET


FIGURE 59
KEY STEPS CONSIDERED FOR ASSESSING SUPPLY OF BUSBARS


FIGURE 60
BUSBAR MARKET ESTIMATION METHODOLOGY (SUPPLY SIDE)


FIGURE 61
EUROPE BUSBAR MARKET: DATA TRIANGULATION


FIGURE 62
EUROPE BUSBAR MARKET: RESEARCH LIMITATIONS


Methodology

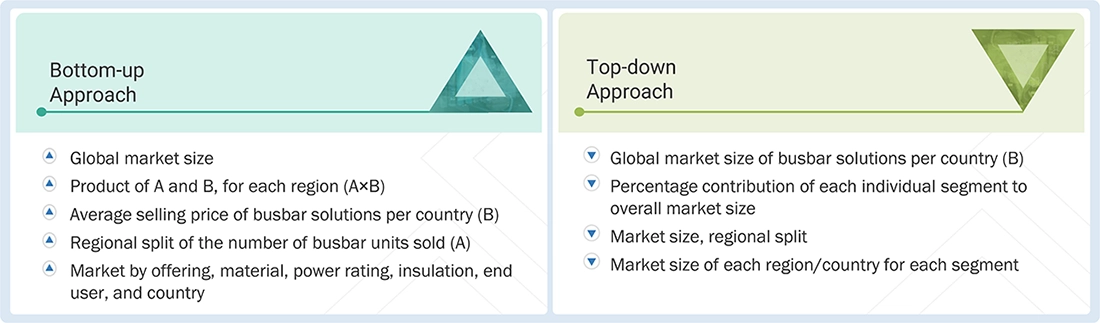
The study involved major activities in estimating the current size of the Europe busbar market. Exhaustive secondary research was done to collect information on the peer and parent markets. The next step was to validate these findings, assumptions, and sizing with industry experts across the value chain through primary research. Both top-down and bottom-up approaches were employed to estimate the complete market size. Thereafter, market breakdown and data triangulation were used to estimate the market size of the segments and subsegments.

Secondary Research

This research study on the Europe busbar market involved the use of extensive secondary sources, directories, and databases, such as Hoovers, Bloomberg, Businessweek, Factiva, International Energy Agency, and BP Statistical Review of World Energy, to identify and collect information useful for a technical, market-oriented, and commercial study of the Europe busbar market. The other secondary sources included annual reports, press releases, and investor presentations of companies, white papers, certified publications, articles by recognized authors, manufacturer associations, trade directories, and databases.

Primary Research

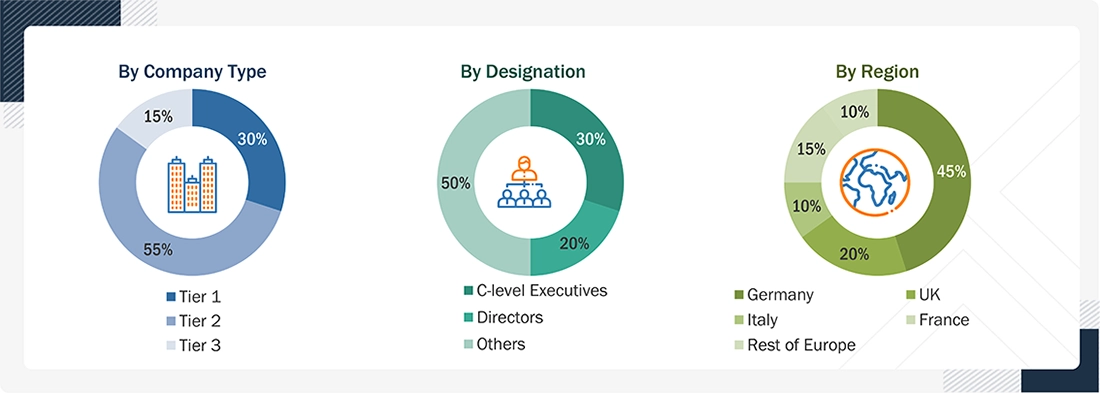
The Europe busbar market comprises stakeholders such as Europe busbar manufacturers, technology providers, and support providers in the supply chain. On the demand side, the market is driven by growing adoption of Europe busbar systems in various sectors, including data centers, renewable energy, industrial, and commercial applications, due to their high energy efficiency, compact design, and superior performance compared to conventional power distribution systems. Rising infrastructure development and urbanization in emerging economies further fuel demand for Europe busbar solutions. On the supply side, manufacturers are witnessing increasing opportunities through contracts from utility and industrial distribution networks, as well as strategic initiatives such as mergers, acquisitions, and partnerships among major players to expand their market presence and technological capabilities. Various primary sources from both the supply and demand sides of the market were interviewed to obtain qualitative and quantitative information. The following is the breakdown of primary respondents:

Europe Busbar Market Size, and Share

Note: “Others” include sales managers, engineers, and regional managers
The tiers of the companies are defined based on their total revenue as of 2025: Tier 1: >USD 1 billion, Tier 2: USD 500 million–1 billion, and Tier 3: <USD 500 million

To know about the assumptions considered for the study, download the pdf brochure

Market Size Estimation

Both the top-down and bottom-up approaches were used to estimate and validate the size of the Europe busbar market and its dependent submarkets. The key players in the market were identified through secondary research, and their market share in the respective regions was obtained through primary and secondary research. The research methodology includes the study of the annual and financial reports of top market players and interviews with industry experts, such as chief executive officers, vice presidents, directors, sales managers, and marketing executives, for key quantitative and qualitative insights related to the Europe busbar market.

Europe Busbar Market: Top-Down and Bottom-Up Approach

Europe Busbar Market Top Down and Bottom Up Approach

Data Triangulation

After arriving at the overall market size from the estimation process explained above, the total market has been split into several segments and subsegments. To complete the overall market engineering process and arrive at the exact statistics for all the segments and subsegments, the data triangulation and market breakdown processes have been employed, wherever applicable. The data has been triangulated by studying various factors and trends from both the demand and supply sides. Along with this, the market has been validated using both the top-down and bottom-up approaches.

Market Definition

A European busbar is an electrical element that makes complex power distributions simpler, more affordable, and more flexible. It is a metallic strip or bar, typically housed inside switchgear, panel boards, and busway enclosures for local high-current power distribution. The busbar system consists of an isolator and a circuit breaker. It allows new circuits to branch off anywhere along the busway route rather than branching the main supply at one location. A Europe busbar is an electrical junction that collects electric power from incoming feeders and distributes it to the outgoing feeders. The main purpose of a Europe busbar is to carry electricity and distribute it. It is used to make the systems more efficient. They can be an excellent solution for complicated electrical systems.

Key Stakeholders

  • Government & research organizations
  • Institutional investors
  • Investors/Shareholders
  • Environmental research institutes
  • Manufacturers’ associations
  • Europe busbar manufacturers, dealers, and suppliers
  • Organizations, forums, alliances, and associations
  • Renewable power generation and equipment manufacturing companies
  • Public & private power generation, transmission & distribution companies (utilities)
  • Substation equipment manufacturing companies
  • Smart grid project developers
  • Switchgear and power cable manufacturing companies
  • State and national regulatory authorities
  • Venture capital firms 

Report Objectives

  • To describe and forecast the Europe busbar market, by material, power rating, insulation, manufacturing process, end-user, and region, in terms of value
  • To describe and forecast the Europe busbar market across key countries and end-use application segments, with country-level analysis covering Germany, the United Kingdom, France, Italy, and the Rest of Europe, in terms of value
  • To describe and forecast the Europe busbar market, by country, in terms of value
  • To provide detailed information regarding drivers, restraints, opportunities, and challenges influencing the growth of the market
  • To provide a detailed overview of the Europe busbar supply chain analysis, use case analysis, key stakeholders and buying criteria, patent analysis, trade analysis, tariff analysis, regulations, macroeconomic outlook, pricing analysis, Porter’s five forces analysis, impact of gen AI/AI, and the 2025 US tariff impact
  • To strategically analyze micromarkets with respect to individual growth trends, prospects, and contributions to the total market
  • To analyze opportunities in the market for various stakeholders by identifying high-growth segments
  • To strategically profile key players and comprehensively analyze their market position in terms of ranking and core competencies, along with detailing the market’s competitive landscape
  • To analyze growth strategies, such as acquisitions, investments, expansions, and product launches, adopted by market players in the Europe busbar market

Available customizations:

MarketsandMarkets offers customizations according to the specific needs of the companies with the given market data.

The following customization options are available for the report:

Product Analysis

  • Product matrix, which gives a detailed comparison of the product portfolio of each company

Regional Analysis

  • Further breakdown of the busbar, by country

Company Informarion

  • Detailed analysis and profiling of additional market players (up to five)


Personalize This Research

  • Triangulate with your Own Data
  • Get Data as per your Format and Definition
  • Gain a Deeper Dive on a Specific Application, Geography, Customer or Competitor
  • Any level of Personalization
Request A Free Customisation

Let Us Help You

  • What are the Known and Unknown Adjacencies Impacting the Europe Busbar Market
  • What will your New Revenue Sources be?
  • Who will be your Top Customer; what will make them switch?
  • Defend your Market Share or Win Competitors
  • Get a Scorecard for Target Partners
Customized Workshop Request

Custom Market Research Services

We Will Customise The Research For You, In Case The Report Listed Above Does Not Meet With Your Requirements

Get 10% Free Customisation

TESTIMONIALS

Growth opportunities and latent adjacency in Europe Busbar Market

THIS REPORT TELLS YOU

How big the Europe Busbar market is, and who leads it.

GROWTHIQ TELLS YOU NEW

Where your company should play next, and who is taking your share.

Get your company's view of this market. Free snapshot.

DMCA.com Protection Status
popup img