
EV Connector Market

EV Connector Market by System (Sealed, Unsealed), Application (ADAS & Safety, Battery Management, Body Control & Interiors), Propulsion (BEV, PHEV, FCEV), Voltage, Connection, Component, and Region - Global Forecast to 2032


OVERVIEW
Source: Secondary Research, Interviews with Experts, MarketsandMarkets Analysis
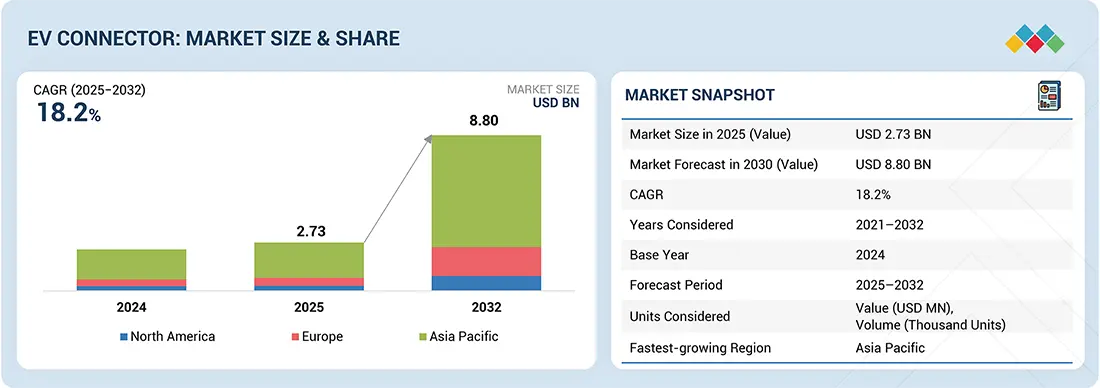
The EV connector market is projected to reach USD 8.80 billion by 2032 from USD 2.73 billion in 2025 at a CAGR of 18.2%. The EV connector market is growing rapidly due to the integration of high-voltage and electronic systems in EVs. As EV architectures evolve, systems like infotainment, body control, ADAS, powertrain, and lighting require advanced connectors that can handle high voltage and environmental stress. This demand drives the need for high-performance solutions, including wire-to-wire, wire-to-board, and board-to-board connectors with compact sizes, durability, and enhanced safety mechanisms such as the high-voltage interlock loop (HVIL).
Market Size and Forecast:
- Market Size Value in 2025: USD 2.73 Billion
- Revenue Forecast in 2032: USD 8.80 Billion
- Growth Rate: CAGR of 18.2% from 2025 to 2032
- Data available from 2021 to 2032
- Base year: 2024
- Forecast period: 2025–2032
Key Market Trends and Insights
- Market Growth: Growth is driven by the increasing integration of high-voltage electrical systems, rising EV production, and growing demand for advanced connectors in battery management, ADAS, infotainment, and vehicle control systems.
-
Technology Impact: Advanced high-voltage connectors, high-speed data transmission technologies, HVIL-enabled safety systems, and compact connector designs are improving EV performance, reliability, and safety.
- Growing Trends: The market is witnessing increased adoption of board-to-board connectors, wire-to-board architectures, zonal E/E architectures, software-defined vehicles, and next-generation battery management systems.
- Growth Opportunities: Opportunities are driven by the scaling of autonomous driving technologies, expansion of EV manufacturing, increasing deployment of connected vehicle systems, and the transition toward advanced electrical/electronic vehicle architectures.
KEY TAKEAWAYS
-
BY APPLICATIONADAS systems require high-speed data connectors for real-time sensor and control unit communication. Growth is driven by increasing vehicle autonomy and advanced safety mandates.
-
BY PROPULSIONEV connectors must support high-power transfer, dual-source management, and specialized hydrogen fuel cell requirements. Market growth is driven by BEV adoption, hybrid versatility, and emerging hydrogen mobility initiatives.
-
BY SYSTEMSealed connectors prevent dust and moisture ingress, ensuring reliability in high-voltage and harsh environments. Unsealed connectors are declining as automotive systems demand higher durability and safety.
-
BY CONNECTIONWire-to-wire connectors ensure reliable high-current connections between wires. Wire-to-Board connectors link wires to circuit boards for power and signal transmission, and Board-to-Board connectors interconnect circuit boards to support complex vehicle electronics. All three types enable efficient, modular, and integrated electric vehicle system architectures.
-
BY REGIONThe Asia Pacific is the largest market for EV connectors, driven by rapid EV adoption, government incentives, expanding local manufacturing, rising disposable incomes, and the development of advanced EV architectures in countries like China, Japan, and India.
-
COMPETITIVE LANDSCAPEKey players such as TE Connectivity, Aptiv, Amphenol, and Yazaki focus on innovations in high-voltage, high-current, and high-speed connectors. Strategies include R&D investments, strategic partnerships, product diversification, and integrating modular, scalable solutions to meet the evolving demands of EV powertrains, battery management, and advanced in-vehicle connectivity systems.
The EV connector market is set for rapid growth, driven by vehicle electrification, advanced powertrains, and zero-emission mandates. High-performance, reliable connectors are critical for battery systems, ADAS, and infotainment, enabling safer and more efficient EV operations. Innovation in compact, high-current, and EMI-shielded designs supports smarter, modular vehicle architectures. With rising adoption across passenger and commercial EVs, connectors are pivotal enablers of performance, sustainability, and long-term competitive advantage.
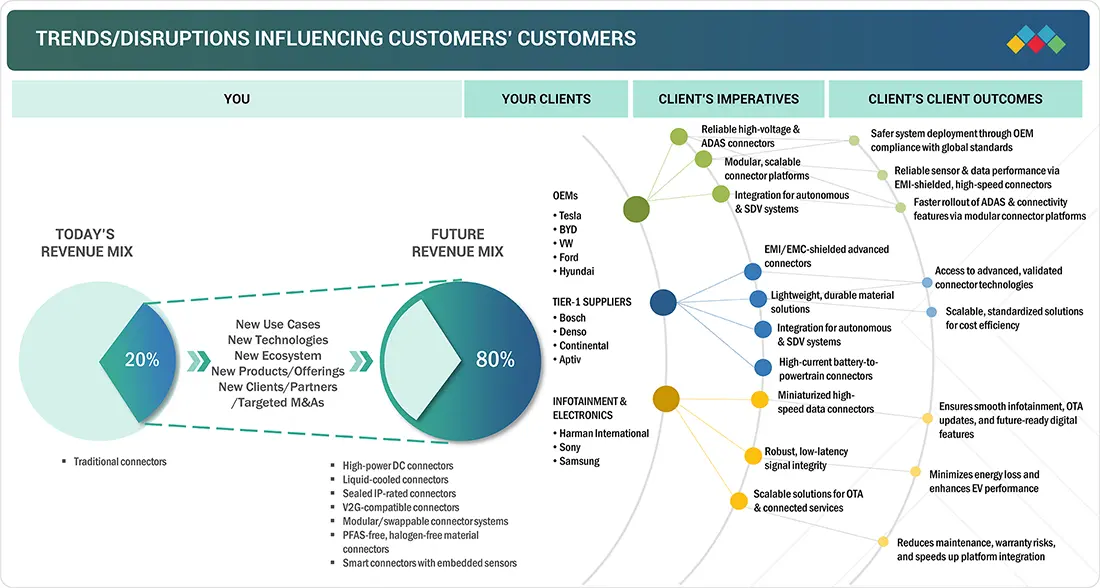
TRENDS & DISRUPTIONS IMPACTING CUSTOMERS' CUSTOMERS
Changes in EV connector demand and technology trends directly impact OEMs and suppliers' businesses. Shifts toward high-speed, modular, and durable connectors influence end-user revenues, which cascade to component suppliers and ultimately affect connector manufacturers’ top-line growth.
Source: Secondary Research, Interviews with Experts, MarketsandMarkets Analysis
MARKET DYNAMICS
Level
-
•OEMs’ emphasis on electrification of mid-segment and luxury vehicles

-
•Rapid integration of ADAS and safety systems

Level
-
•Volatility in raw material prices

Level
-
•Scaling of autonomous driving technologies

-
•Shift toward advanced electrical/electronic (E/E) architecture

Level
-
•Material degradation due to mechanical wear and thermal stresses

-
•Transition from conventional connector systems to modular platform designs

Source: Secondary Research, Interviews with Experts, MarketsandMarkets Analysis
Driver: OEMs' emphasis on electrification of mid-segment and luxury vehicles
Electrification in mid-segment and luxury models accelerates the demand for robust, compact connectors designed for 400V–800V platforms. These connectors must support powertrain, charging, battery management, ADAS, and digital systems, while new zonal architectures increase connector density and requirements for insulation, EMI shielding, thermal resilience, and space efficiency.
Restraint: Volatility in raw material prices
Unstable prices of aluminum and rare earths are adding cost pressures for connector manufacturers. These fluctuations strain supply chains, complicate inventory planning, and disrupt fixed-price contracts, ultimately impacting margins, production economics, and the rollout pace of advanced EV platforms.
Opportunity: Trend of autonomous driving
The shift toward autonomous driving is creating demand for high-speed, high-bandwidth connectors to ensure seamless data transfer across sensors, control units, and networks. ADAS and autonomy require reliable low-latency communication, prompting manufacturers to innovate Ethernet, optical fiber, and coaxial solutions that integrate with modular vehicle architectures.
Challenge: Transition from conventional connector systems to modular designs
While modular connectors enable scalability, standardization, and reduced wiring in compact EV architectures, they pose design challenges. Maintaining mechanical robustness, signal integrity, sealing, EMI protection, and thermal resilience in high-density layouts is critical as vehicles move toward centralized, zonal electronic architectures.
EV Connector Market: COMMERCIAL USE CASES ACROSS INDUSTRIES
| COMPANY | USE CASE DESCRIPTION | BENEFITS |
|---|---|---|
 |
Designing high-voltage, IP-rated connectors for electric vehicles, ensuring safe and reliable power transfer in harsh environments | Enables faster charging, improves safety and reliability, supports OEM electrification strategies, and differentiates through advanced connector technology |
 |
Supplying lithium compounds and specialty metals for EV battery and connector production | Ensures stable material supply, reduces production bottlenecks, and supports high-performance EV components, strengthens sustainability credentials |
 |
Providing integrated wiring harnesses, sensors, and control modules with EV connectors for OEM EV platforms | Enhances vehicle performance & reliability, enables seamless OEM integration, and accelerates EV rollout through standardized components |
 |
Distributing EV connectors, sensors, and related components to OEMs and Tier-1 suppliers globally | Expands market reach, ensures timely delivery & scalability, and supports rapid deployment of EVs with reliable connectivity |
 |
Deploying EVs and charging infrastructure with integrated high-performance connectors and infotainment power delivery | Improves vehicle uptime, reduces maintenance, strengthens brand leadership in electrification, and supports ecosystem interoperability |
Logos and trademarks shown above are the property of their respective owners. Their use here is for informational and illustrative purposes only.
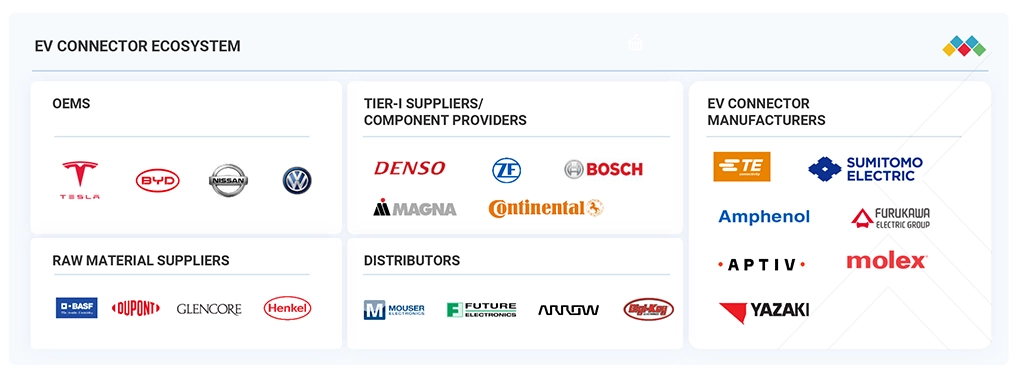
MARKET ECOSYSTEM
The ecosystem mapping highlights various EV connector market players, including raw material suppliers, EV connector manufacturers, EV connector distributors, and automotive OEMs. The leading players in the EV connector market are TE Connectivity (Ireland), Aptiv (Ireland), Yazaki Corporation (Japan), Molex (US), and Hirose Electric Co., Ltd. (Japan), among others, who are shifting toward miniaturization and advancements in EMI shielding connectors.
Logos and trademarks shown above are the property of their respective owners. Their use here is for informational and illustrative purposes only.
MARKET SEGMENTS
Source: Secondary Research, Interviews with Experts, MarketsandMarkets Analysis
EV Connector Market, By Application
Battery management system connectors form the fastest-growing segment during the forecast period. This growth can be attributed to the transition of EV batteries to integrated structural formats. Also, improved creepage, clearance, and EMI shielding ensure reliable signal and power delivery in high-vibration environments, making connector precision a critical enabler for high-performance, safety-focused battery management systems.
EV Connector Market, By Connection Type
Board-to-board connectors are expected to be the fastest-growing and largest market during the forecast period, owing to EVs' shift to centralized computing and digital cockpits, enabling high-speed, low-loss data transfer. Their role in modular architectures and battery control systems makes them critical for software-defined vehicles.
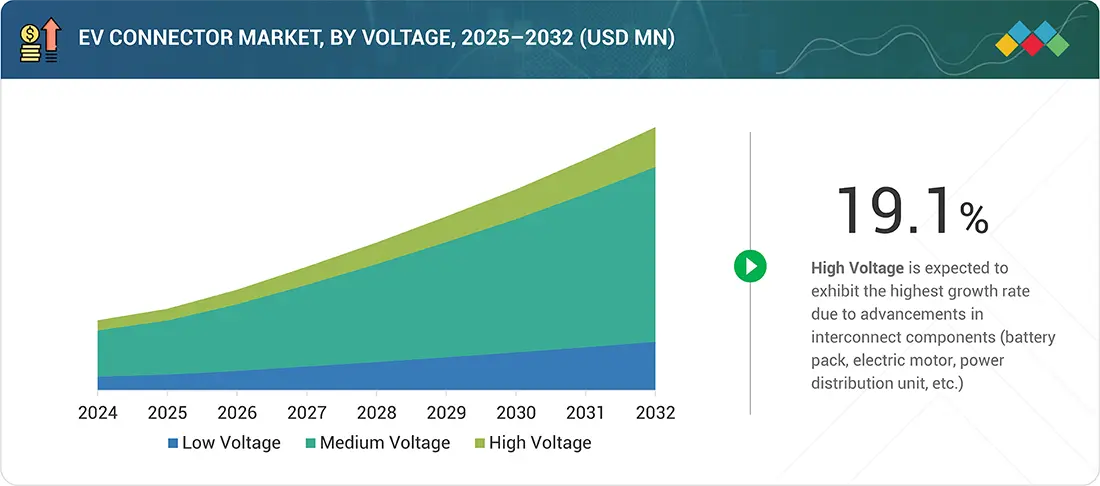
EV Connector Market, By Voltage
The medium-voltage segment is growing as EVs and hybrids demand higher current delivery. These connectors support body control and interior systems such as heated seats, sunroofs, and cooling units. The rising adoption of comfort and efficiency features drives further demand for medium-voltage connectors.
EV Connector Market, By Propulsion
Fuel cell vehicles require advanced, sealed, and chemically resistant connectors for high-voltage stacks, batteries, and drivetrains. Compact, EMI-shielded designs support safety, sensing, and thermal management in harsh environments, while low-voltage connectors manage control units, hydrogen tanks, leak sensors, and cabin systems.
REGION
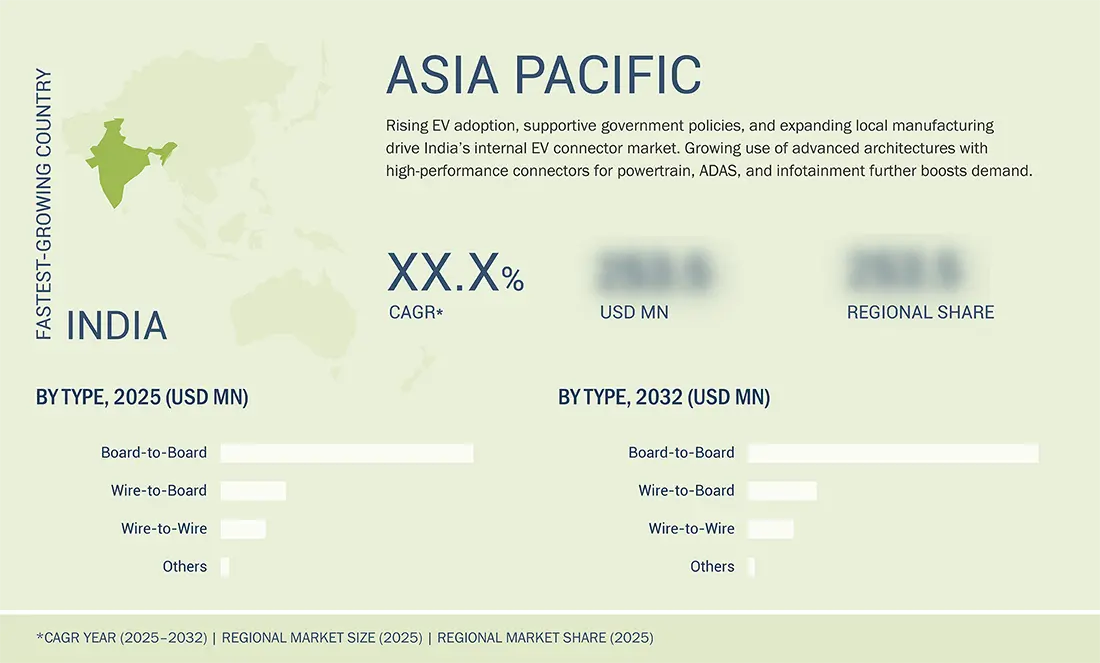
Asia Pacific to be largest region in global EV Connector market during forecast period
The Asia Pacific leads the global EV connector market, driven by robust manufacturing capabilities, increased EV production, and rapid innovation in vehicle electronics. As of 2024, the region accounted for over 55% of global EV output, supported by key automakers such as BYD, SAIC, Geely, Toyota, Hyundai, and Tata Motors. This strong presence fuels consistent demand for connectors, from high-voltage components used in batteries and traction inverters to compact signal connectors for infotainment, ADAS, and zonal control systems in software-defined vehicles (SDVs). In July 2024, Sumitomo Electric began developing fiber-optic connectors to enable high-speed data transfer in SDVs through zonal E/E architectures. Hyundai Mobis also expanded its EV components plant in Ulsan in June 2024 to scale production of integrated connector modules, reinforcing Asia Pacific’s position as the strategic hub for next-generation EV connector development.
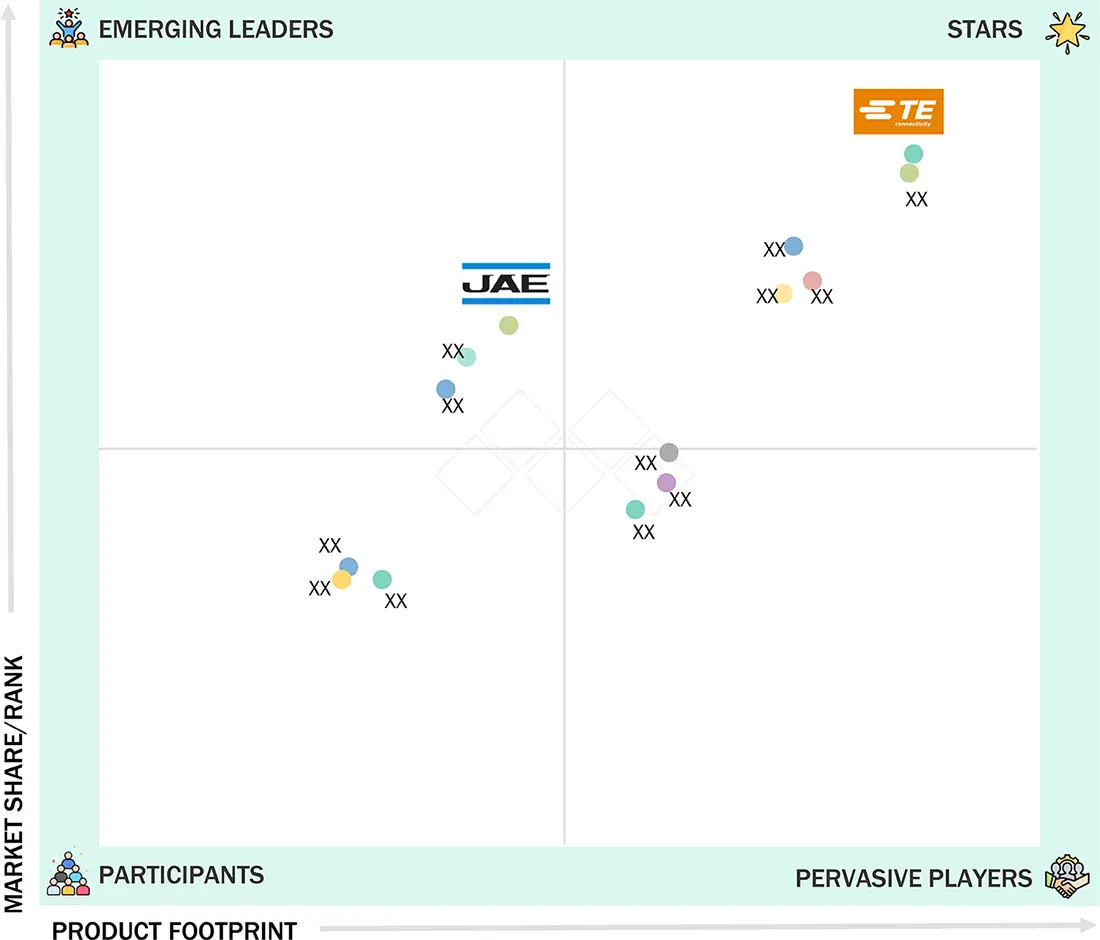
EV Connector Market: COMPANY EVALUATION MATRIX
TE Connectivity Ltd. (Star) leads with a strong market presence and a wide product portfolio, enabling large-scale adoption across automotive, electronics, and industrial applications. Japan Aviation Electronics Industry, Ltd. (Emerging Leader) is gaining traction with advanced EV connector solutions, supporting diverse vehicle architectures and high-reliability applications. While TE Connectivity Ltd. dominates with scale, Japan Aviation Electronics Industry, Ltd. shows strong growth potential to advance toward the leaders' quadrant.
Source: Secondary Research, Interviews with Experts, MarketsandMarkets Analysis
KEY MARKET PLAYERS
MARKET SCOPE
| REPORT METRIC | DETAILS |
|---|---|
| Market Size in 2025 (Value) | 2.73 BN |
| Market Forecast in 2032 (Value) | 8.80 BN |
| Growth Rate | CAGR of 18.2% from 2025-2032 |
| Years Considered | 2021–2032 |
| Base Year | 2024 |
| Forecast Period | 2025–2032 |
| Units Considered | Value (USD Million), Volume (Thousand Units) |
| Report Coverage | Revenue forecast, company ranking, competitive landscape, growth factors, and trends |
| Segments Covered | By application: ADAS & safety systems, body control & interiors, infotainment systems, engine management & powertrain, battery management systems, vehicle lighting, and other applications By Connection: Wire-to-Wire, Wire-to-Board, Board-to-Board, and Oth |
| Regions Covered | Asia Pacific, Europe, and North America |
WHAT IS IN IT FOR YOU: EV Connector Market REPORT CONTENT GUIDE
DELIVERED CUSTOMIZATIONS
We have successfully delivered the following deep-dive customizations:
| CLIENT REQUEST | CUSTOMIZATION DELIVERED | VALUE ADDS |
|---|---|---|
| US-based EV OEMs & Tier-1 Suppliers | Detailed competitor benchmarking (connector specs, IP rating, material choices, production capacity) | Identification of differentiation opportunities in high-voltage, liquid-cooled, and smart in-vehicle connectors |
| Battery & Powertrain Suppliers | Technical evaluation of connector compatibility with emerging EV architectures (48V–800V systems, liquid-cooled vs. air-cooled) | Guidance on connector designs to reduce energy losses, improve thermal management, and enhance battery and inverter safety |
| Global & Regional EV Connector Supply Chain | Mapping of raw material sourcing (copper, aluminum, plastics, PFAS-free alternatives), Tier-1 supplier ecosystems, and distributor networks | Visibility into cost fluctuations, supply risks, and potential strategic partnerships |
RECENT DEVELOPMENTS
- May 2025 : JAE launched the MY05 Series connectors rated at 1,000 V for BMS applications. These compact connectors meet IEC 60664-1 insulation standards, support miniaturization, and are UL94 V-0, halogen-free, PFAS-free, and CTI 600 compliant. They are compatible with MX80 and European standard terminals, come with or without CPA, and have been tested to USCAR-2/37 and LV214/215. Applications include EVs, transportation, and high-voltage industrial systems.
- April 2025 : TE Connectivity finalized the acquisition of Richards Manufacturing, a leading North American provider of utility grid products. Richards specializes in underground distribution equipment and medium-voltage electric connectors used by electric utilities. The acquisition enhances TE’s position in grid modernization and utility-grade connectivity solutions.
- April 2025 : Yazaki opened a 3.16 lakh sq. ft. advanced wire harness manufacturing plant in Chengalpattu Industrial Park, Chennai. This third partnership with Horizon Industrial Parks highlights sustainability through rooftop solar integration. It is expected to create over 2,000 jobs, expanding its operations in India alongside its NCR and Hosur facilities.
- January 2025 : Aptiv announced a demerger of its Electrical Distribution Systems (EDS) business to create two independent companies. EDS will concentrate on low- and high-voltage electrical architecture for automotive and commercial vehicles to target fast-growing markets in ADAS, interconnects, and sensor-to-cloud technology solutions across various industries. The tax-free spin-off is expected to be finalized by March 2026.
Table of Contents
 Exclusive indicates content/data unique to MarketsandMarkets and not available with any competitors.
Methodology
This research study involved the extensive use of secondary sources, such as company annual reports/presentations, industry association publications, automotive magazine articles, directories, technical handbooks, the World Economic Outlook, trade websites, technical articles, and databases, to identify and collect information on the EV connector market. In-depth interviews were conducted with various primary respondents, including key industry participants, subject-matter experts, C-level executives of key market players (EV connector and EV connector component manufacturers), and industry consultants, among other experts, to obtain and verify critical qualitative and quantitative information and assess market prospects.
Secondary Research
In the secondary research process, various secondary sources were used to identify and collect information on the EV connector market for this study. Secondary sources included annual reports, press releases, and investor presentations of companies; whitepapers, certified publications, and articles from recognized authors; directories; databases; and articles from recognized associations and government publishing sources.
Primary Research
Extensive primary research was conducted after understanding the EV connector market scenario through secondary research. Several primary interviews were conducted with market experts from both the demand (OEMs) and supply (connector providers, wire harness providers, and component manufacturers) sides across North America, Europe, and Asia Pacific. Approximately 45% and 55% of primary interviews were conducted from the demand and supply sides. Primary data was collected through questionnaires, emails, and telephonic interviews.
In the canvassing of primaries, various departments within organizations, such as sales, operations, and marketing, were covered to provide a holistic viewpoint in the report. After interacting with industry experts, brief sessions were conducted with highly experienced independent consultants to reinforce the findings from the primaries. This, along with the opinions of in-house subject matter experts, led to the findings, as described in the remainder of this report.

Note 1: Others include sales managers, marketing managers, and product managers.
Note 2: Tier 1 companies’ revenues are more than USD 10 billion; tier 2 companies’ revenues range between USD 1 and 10 billion; and tier 3 companies’ revenues range between USD 500 million and USD 1 billion.
Source: Industry Experts
To know about the assumptions considered for the study, download the pdf brochure
Market Size Estimation
Both top-down and bottom-up approaches were used to estimate and validate the total size of the cell culture market. These methods were also used extensively to estimate the size of various subsegments in the market. The research methodology used to estimate the market size includes the following:
EV Connector Market : Top-Down and Bottom-Up Approach

Data Triangulation
After arriving at the overall market size of the global market through the above-mentioned methodology, this market was split into several segments and subsegments. The data triangulation and market breakdown procedures were employed, wherever applicable, to complete the overall market engineering process and arrive at the exact data for the market by value for the key segments and subsegments. The extrapolated market data was triangulated by studying various macro indicators and regional trends from both the demand and supply-side participants.
Market Definition
An EV connector is an electrical connector designed for use in vehicles. They are essential components that transmit power, data, and signals between various electrical applications such as ADAS and safety systems, body control and interiors, infotainment systems, engine management and powertrain, battery management systems, and vehicle lighting.
Stakeholders
- ADAS Manufacturers
- Authorized and Independent Automobile Service Centers
- Automotive Component Manufacturers
- Automotive Dealers and Distributors
- Automotive Electronic Control Unit Manufacturers
- Automotive OEMs
- Automotive Component Manufacturers
- Autonomous Vehicle Manufacturers
- Autonomous Vehicle System Suppliers
- ECU Manufacturers
- Electrical and Electronic Component Suppliers
- EV Charging Manufacturers and Service Providers
- EV Component Manufacturers
- EV Manufacturers
- EV Connector Manufacturers
- Legal and Regulatory Authorities
- Raw Material Suppliers for Automotive OEMs
- Raw Material Suppliers for EV Connectors or Components
- Vehicle Safety Regulatory Bodies
- Wire Harness Manufacturers
Report Objectives
-
To segment and forecast the size of the EV connector market in terms of volume (million units) and value (USD million) from 2021 to 2032
- To define, describe, and forecast the EV connector market in terms of volume (million units) and value (USD million)
- To define, describe, and forecast the global EV connector market based on application, connection, propulsion, system, voltage, component, and region
- To segment and forecast the market size by application (ADAS & safety systems, body control & interiors, infotainment systems, engine management & powertrain, battery management systems, vehicle lighting, and other applications)
- To segment and forecast the market size by connection(wire-to-wire, wire-to-board, board-to-board, and other connection types)
- To segment and forecast the market size by propulsion (BEV, PHEV, FCEV, and HEV) (HEV is covered qualitatively)
- To segment and forecast the market size by system (sealed and unsealed)
- To segment and forecast the market size by voltage (low voltage, medium voltage, and high voltage)
- To forecast the market size with respect to key regions, namely Asia Pacific, Europe, and North America
- To qualitatively study the market by component (terminal, housing, lock, and other components)
- To provide detailed information regarding the major factors influencing the market growth (drivers, challenges, restraints, and opportunities)
- To strategically analyze markets with respect to individual growth trends, prospects, and contributions to the total market
- To strategically profile key players and comprehensively analyze their market share and core competencies
-
To study the following with respect to the market:
- Supply Chain Analysis
- Ecosystem Analysis
- Technology Analysis
- Trade Analysis
- Case Study Analysis
- Patent Analysis
- Regulatory Landscape
- Conferences and Events
- Pricing Analysis
- Influences of Stakeholders and Buying Criteria
- Impact of AI
- Investment and Funding Scenario
- To analyze opportunities for stakeholders and the competitive landscape for market leaders
- To track and analyze competitive developments such as product developments, deals, and others undertaken by the key industry participants
Available Customizations
With the given market data, MarketsandMarkets offers customizations in accordance with the company’s specific needs.
- Further breakdown of the EV connector market, by component, at the regional level (for regions covered in the scope of the report)
- Further breakdown of the EV connector market, by propulsion, at the country level (for countries covered in the scope of the report)
Additional Company Profile
- Company profiling (up to five)
Key Questions Addressed by the Report
What is the current market size of the EV Connector Market, and how is it expected to grow?
The EV Connector Market is projected to grow from USD 2.73 billion in 2025 to USD 8.80 billion by 2032, at a CAGR of 18.2% during the forecast period.
What are the key factors driving the growth of the EV Connector Market?
The market is driven by rising EV production, increasing integration of high-voltage electrical systems, growing adoption of ADAS and battery management systems, and the demand for high-performance connectors.
Which region is expected to dominate the EV Connector Market during the forecast period?
Asia Pacific is expected to dominate the EV Connector Market due to its strong EV manufacturing base, expanding vehicle electronics ecosystem, and rapid adoption of software-defined vehicle architectures.
What are the latest trends shaping the EV Connector Market?
Key trends include the adoption of high-voltage connectors, board-to-board connector architectures, HVIL-enabled safety systems, zonal E/E architectures, and high-speed data transmission technologies.
Who are the leading companies in the EV Connector Market, and what strategies are they adopting?
Leading companies are focusing on advanced connector technologies, product innovation, strategic collaborations, and expanding high-voltage and high-speed connector portfolios to support next-generation electric vehicles.
Need a Tailored Report?
Customize this report to your needs
Get 10% FREE Customization
Customize This ReportPersonalize This Research
- Triangulate with your Own Data
- Get Data as per your Format and Definition
- Gain a Deeper Dive on a Specific Application, Geography, Customer or Competitor
- Any level of Personalization
Let Us Help You
- What are the Known and Unknown Adjacencies Impacting the EV Connector Market
- What will your New Revenue Sources be?
- Who will be your Top Customer; what will make them switch?
- Defend your Market Share or Win Competitors
- Get a Scorecard for Target Partners

Custom Market Research Services
We Will Customise The Research For You, In Case The Report Listed Above Does Not Meet With Your Requirements
Get 10% Free CustomisationTESTIMONIALS

JIM NAAS
PRODUCT DIRECTOR, WEASLER
Weasler Engineering, a CentroMotion organization
Global Provider of Industrial Actuation & Control Solutionswww.weasler.com
Our organization was interested in learning more about the attractiveness of a particular market space. We contacted MarketsandMarkets to help us based on previous positive experiences we had with them. The results did not disappoint! We discussed our objectives with them, and the team at MarketsandMarkets developed and executed a proposal that met our needs precisely. We were very impressed by their level of expertise, the quality of the analysis and their insightful recommendations. We would not hesitate in working with them again in the future.

Matt Kardel,
Vice President
Aptiv,
A global technology company that develops safer, greener and more connected solutions.www.aptiv.com
We contracted with
MarketsandMarkets to evaluate the value chain and potential go-to-market partners related to our
interest in the Fleet Management space. The team successfully completed the work on time and at the
pricing agreed. MarketsandMarkets listened and understood our objectives and collaborated well with
us to help us get the visibility we needed to make an investment.
We have subsequently used
MarketsandMarkets again related to Smart Cities to good results.


Growth opportunities and latent adjacency in EV Connector Market