
Asia Pacific 3D Digital Asset Market (2024-2029)

The Asia Pacific 3D Digital Asset Market was valued at $6113.3 Million in 2024 and projected to reach to $12440.9 Million by 2029, representing a compound annual growth rate of CAGR 15.3%. The Asia Pacific 3D Digital Asset Market is positioned for exceptional growth through 2029, driven by rapid digital transformation, increasing metaverse investments, and expanding gaming and entertainment industries across the region.


| Market Size in | USD 26.32 MN |
| Market Forecast in | |
| CAGR | |
| Forecast Period | |
| Units Considered | Value (USD MN) |
Asia Pacific 3D Digital Asset Market Trends and Insights
- Asia Pacific's 15.3% compound annual growth rate significantly outpaces the global average of 12.9%, reflecting the region's accelerating digital transformation and adoption of immersive technologies.
- This growth is driven by increasing investments in gaming, entertainment, metaverse development, and enterprise visualization across countries including China, Japan, South Korea, and India. Asia Pacific's dominance in 3D digital asset creation is fueled by a large pool of skilled developers, competitive manufacturing costs, and rising demand from both consumer and B2B sectors.
- The region's gaming industry, particularly in mobile and console segments, continues to be a primary consumer of high-quality 3D assets.
- Additionally, Asia Pacific enterprises are rapidly adopting 3D visualization for product design, architectural rendering, and virtual collaboration, further expanding market opportunities through 2029..
Key Market Statistics
- CAGR (2024-2029) CAGR 15.3%
- Market Size, 2024 ~USD 6113.3 Million
- Forecast, 2029 ~USD 12440.9 Million
- Geography Asia Pacific
Asia Pacific 3D Digital Asset Market Overview
Outpacing Global Growth :
Asia Pacific's 15.3% CAGR significantly exceeds the global average of 12.9%, positioning the region as the fastest-growing market for 3D digital assets and establishing it as a critical hub for immersive technology innovation.
Substantial Market Expansion :
The region's market is projected to nearly double from $6,113.3 million in 2024 to $12,440.9 million by 2029, representing a $6.3 billion growth opportunity driven by digital transformation across enterprise and consumer sectors.
China's Market Leadership :
China dominates Asia Pacific's 3D digital asset market with $4,652.9 million in 2024, leveraging its advanced gaming, metaverse, and entertainment industries to drive regional adoption and innovation.
Emerging Technology Adoption :
Rising investments in AR/VR, gaming, film production, and architectural visualization across Asia Pacific are accelerating demand for high-quality 3D digital assets, supported by improving digital infrastructure and tech-savvy populations.
Asia Pacific 3D Digital Asset Market Dynamics
- China's technological leadership, coupled with growing adoption in Japan, Australia, and emerging Southeast Asian markets, creates a dynamic ecosystem for 3D asset creation and consumption.
- Enterprise adoption is accelerating in architecture, product design, and e-commerce, while consumer demand surges through gaming and social platforms. Key growth catalysts include government digital initiatives, rising venture capital funding for immersive tech startups, and expanding creative talent pools.
- The region's younger demographic and high smartphone penetration rates further amplify market potential.
- However, competition from established Western players and varying regulatory frameworks across countries present challenges.
- Companies investing in localized content, regional partnerships, and emerging market segments will capture significant value in this high-growth region..
Market Ecosystem
Related Ecosystem
Software And Services
- Natural Language Processing (NLP)
- Machine Learning
- Supply Chain Management
- Predictive Analytics
- Image Sensors
- International Business Machines Corporation
- MICROSOFT CORPORATION
- Oracle Corporation
- SAP SE
- Amazon.com, Inc.
Cloud Computing
- Software as A Service (SaaS)
- Natural Language Processing (NLP)
- Platform as A Service (PaaS)
- Machine Learning
- Supply Chain Management
- International Business Machines Corporation
- MICROSOFT CORPORATION
- Oracle Corporation
- Amazon.com, Inc.
Augmented Virtual Reality
- Sensors
- Virtual Reality Devices
- Augmented Reality
- Virtual Reality
- Augmented Reality Devices
- MICROSOFT CORPORATION
- Lenovo
- VIVITEK CORPORATION
- Apple Inc.
Key Takeaways
- Asia Pacific's 3D Digital Asset Market will more than double from $6,113.3M (2024) to $12,440.9M (2029), growing at 15.3% CAGR-outpacing global growth.
- The region's gaming and entertainment sectors remain the largest drivers of 3D asset demand, supported by a mature developer ecosystem and mobile-first consumer base.
- Enterprise adoption of 3D visualization for design, manufacturing, and virtual collaboration is accelerating across Asia Pacific, opening new revenue streams beyond entertainment.
- Asia Pacific's competitive cost structure and talent pool position it as a global hub for 3D asset creation and outsourcing services through 2029.
3D Digital Asset Market Report Scope
| Report Metric | Details |
|---|---|
| Base Year | 2024 |
| Fastest Growing Segment | TRAINING SIMULATION SOFTWARE (Software Type) |
| Forecast Period | 2024-2029 |
| Growth Rate | CAGR of 12.9% from 2024 to 2029 |
| Largest Segment | AR SOFTWARE (Technology Type) |
| Market Size Base Year (Billions) | ~USD 28.24 (2024) |
| Revenue Forecast (Billions) | ~USD 51.8 (2029) |
| Segments Covered | Component, Hardware, Software, Service, Deployment Mode, Vertical, Type, Application, Technology Type, Software Type |
Asia Pacific 3D Digital Asset Market Report Segmentation
10 segment dimensions are covered across the global market.
By Component
- Hardware
- Services
- Software
By Hardware
- 3D Scanners
- Motion Capture Systems
By Software
- 3D Animation
- 3D Modeling
- 3D Rendering & Visualization
- 3D Scanning
- Image Reconstruction
By Service
- Managed Services
- Professional Services
By Deployment Mode
- Cloud
- On-Premises
By Vertical
- Aerospace & Defense
- Architecture & Construction
- Automotive
- Energy & Utilities
- Government
- Government & Defense
- Government & Public Sector
- Healthcare
- Healthcare & Life Sciences
- Manufacturing
- Media & Entertainment
- Other Verticals
- Real Estate
- Retail & E-Commerce
- Retail & Ecommerce
- Training & Education
- Travel & Hospitality
By Type
- Film & Broadcasting
- Gaming
By Application
- Digital Prototyping
- Gaming & Animation
- Marketing & Advertising
- Other Applications
- Simulation
- Virtual Experience
- Visualization
By Technology Type
- Ar Software
- Vr Software
By Software Type
- Content Management System
- Game Engine
- Modeling &Visualization Software
- Other Software
- Software Development Kit
- Training Simulation Software
Target Audience
- 3D Asset Platform Providers : Evaluate Asia Pacific's expanding market opportunity to prioritize regional expansion, localize offerings for Chinese, Japanese, and Southeast Asian markets, and capture share of the rapidly growing digital asset ecosystem.
- Gaming & Entertainment Studios : Understand regional demand for high-quality 3D assets driven by booming gaming and metaverse sectors in Asia Pacific, informing content strategy, outsourcing decisions, and regional partnership development.
- Enterprise & Technology Investors : Identify high-growth investment opportunities in Asia Pacific's 3D digital asset market, with 15.3% CAGR outpacing global averages and substantial capital deployment potential across emerging tech segments.
- Architecture & Design Firms : Access market data on 3D visualization adoption across Asia Pacific's booming construction and real estate sectors, supporting procurement strategies and technology integration planning for architectural visualization tools.
- E-commerce & Retail Businesses : Leverage insights on growing 3D asset adoption in Asia Pacific's e-commerce sector for product visualization, virtual try-on, and immersive shopping experiences to enhance competitive positioning and customer engagement.
Countries within Asia Pacific - compare and drill down
| Country | 2025 size (native) |
|---|---|
| China | USD 4652.9 Million |
| Japan | USD 2948.5 Million |
| Australia & New Zealand | USD 1704.4 Million |
| Rest Of Apac | USD 3135.1 Million |
Country market size visualization
Reasons to Buy this Report
- Regional Growth Intelligence : Gain comprehensive insights into Asia Pacific's 15.3% CAGR trajectory, understanding market dynamics that significantly outpace global averages and identifying high-growth sub-segments within the region.
- Country-Level Market Data : Access detailed market sizing for China ($4.7B), Japan ($2.9B), and Australia & New Zealand ($1.7B), enabling precise market entry strategies and competitive positioning across Asia Pacific's diverse economies.
- Investment & Expansion Planning : Leverage forecasted growth from $6.1B to $12.4B by 2029 to identify optimal investment opportunities, partnership targets, and expansion timelines for 3D asset platforms, studios, and technology providers.
- Competitive Landscape Analysis : Understand regional competitive dynamics, emerging players, and market consolidation trends specific to Asia Pacific's unique regulatory environment and consumer preferences in 3D digital assets.
- Strategic Decision Support : Make data-driven decisions on product localization, resource allocation, and go-to-market strategies tailored to Asia Pacific's distinct market characteristics and growth opportunities through 2029.
Frequently asked questions
What is the projected market size of the 3D Digital Asset Market in Asia Pacific by 2029?
The Asia Pacific 3D Digital Asset Market is projected to reach $12,440.9 million by 2029, more than doubling from $6,113.3 million in 2024.
What is the CAGR for Asia Pacific's 3D Digital Asset Market?
Asia Pacific's 3D Digital Asset Market is expected to grow at a compound annual growth rate of 15.3% from 2024 to 2029, exceeding the global CAGR of 12.9%.
Which industries are driving 3D digital asset demand in Asia Pacific?
Gaming, entertainment, metaverse development, and enterprise sectors including product design, architectural visualization, and manufacturing are the primary drivers of 3D asset demand in Asia Pacific.
Why is Asia Pacific growing faster than the global 3D Digital Asset Market?
Asia Pacific's faster growth is attributed to its large developer talent pool, competitive cost structure, strong gaming industry presence, and increasing enterprise adoption of 3D visualization technologies.
What countries are leading the 3D Digital Asset Market in Asia Pacific?
China, Japan, South Korea, and India are among the leading markets in Asia Pacific, driven by their robust gaming industries, tech infrastructure, and growing enterprise digital transformation initiatives.
RESEARCH METHODOLOGY
The study involved four major activities in estimating the 3d digital asset market. We conducted secondary research to gather information on the market, competitors, and parent market. The next stage was to validate these findings and assumptions and size them with industry professionals across the value chain using primary research. Top-down and bottom-up methodologies were used to determine the total market size. We used the market breakup and data triangulation techniques to estimate the market size of the different segments in the 3d digital asset market.
Secondary Research
Several sources were used to locate and collect information for this study during the secondary research process. Secondary sources included company annual reports, press announcements, investor presentations, white papers, journals, certified publications, and articles from well-known writers, directories, and databases. Data was also gathered from other secondary sources, such as journals, government websites, blogs, and vendor websites.
Primary Research
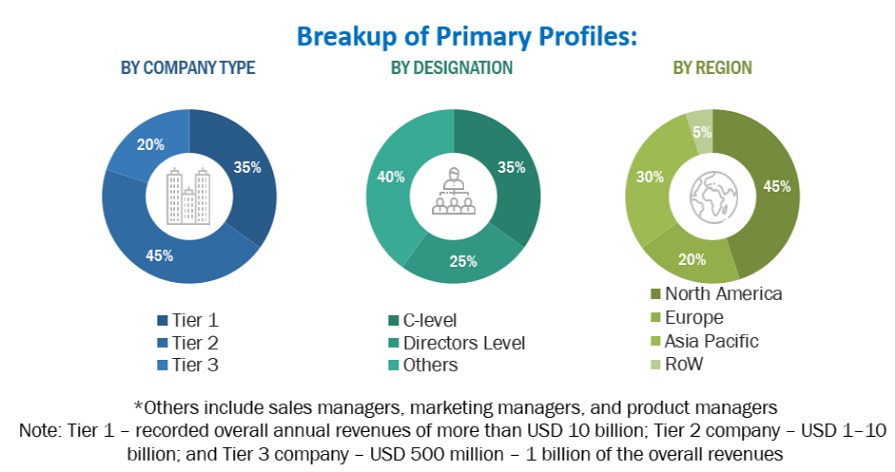
Primary sources included industry experts from the core and associated industries, preferred software suppliers, hardware manufacturers, distributors, service providers, technology developers, alliances, and organizations representing all parts of the industry's value chain. In-depth interviews were conducted with primary respondents, including major industry participants, subject-matter experts, C-level executives of important market companies, and industry consultants, to acquire and verify critical qualitative and quantitative data and analyze the market's potential.
We performed primary interviews to gain insights such as market statistics, the current trends disrupting the industry, new use cases applied, revenue data collected from products and services, market breakdowns, market size projections, market predictions, and data triangulation. Primary research also helped me grasp different technology trends, segmentation types, industry trends, and geographies. Demand-side stakeholders, such as Chief Information Officers (CIOs), Chief Technology Officers (CTOs), and Chief Security Officers (CSOs); installation teams of governments/end users using 3d digital asset solutions and services; and digital initiatives project teams, were interviewed to understand the buyer's perspective on suppliers, products, service providers, and their current use of services, which will affect the overall data center networking market.
To know about the assumptions considered for the study, download the pdf brochure
Market Size Estimation
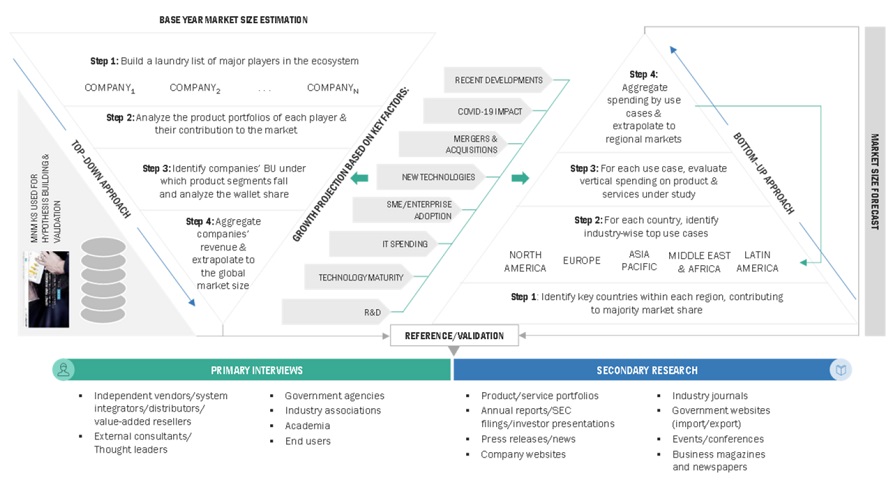
We estimated and forecasted 3d digital asset and other related submarkets using top-down and bottom-up methodologies. We used a bottom-up approach to calculate the overall market size by analyzing the revenues and offerings of significant market players. This study used data triangulation methods and validation through primary interviews to determine and confirm the precise worth of the whole parent market. We used the overall market size in the top-down process to estimate the size of other particular markets using percentage splits of market segments.
We used top-down and bottom-up approaches to estimate and validate the 3d digital asset market and other dependent subsegments.
The research methodology used to estimate the market size included the following details:
- We identified key players in the market through secondary research. We then determined their revenue contributions in the respective countries through primary and secondary research.
- This procedure included studying top market players' annual and financial reports and extensive interviews for key insights from industry leaders, such as Chief Executive Officers (CEOs), VPs, directors, and marketing executives.
- All percentage splits and breakups were determined using secondary sources and verified through primary sources.
We estimated and forecasted 3d digital asset and other related submarkets using top-down and bottom-up methodologies. We used a bottom-up approach to calculate the overall market size by analyzing the revenues and offerings of significant market players. This study used data triangulation methods and validation through primary interviews to determine and confirm the precise worth of the whole parent market. We used the overall market size in the top-down process to estimate the size of other particular markets using percentage splits of market segments.
3d digital asset market: Top-down and Bottom-up approaches
To know about the assumptions considered for the study, Request for Free Sample Report
Data Triangulation
After determining the overall market size, the market was divided into segments and subsegments using the previously described market size estimating techniques. Where applicable, data triangulation and market breakup methods were used to complete the whole market engineering process and ascertain the exact numbers for each market segment and subsegment. The data was triangulated by evaluating many elements and trends on the demand and supply sides of the 3d digital asset market.
Market Definition
"The creation, distribution, and monetization of three-dimensional digital content used in various industries such as entertainment, gaming, e-commerce, architecture, education, and manufacturing. This market includes 3D models, textures, materials, animations, and environments created using software like Maya and Photoshop and distributed through platforms like Unity Asset Store and Sketchfab. Key applications range from immersive experiences in VR and AR to product visualization in e-commerce and architectural visualizations."
Key Stakeholders
- 3D Artists and Designers
- Software Developers
- Marketplace Platforms
- Game Developers
- Film and Animation Studios
- Virtual and Augmented Reality Companies
- Architectural and Engineering Firms
- Education and Training Providers
- Manufacturers and Product Designers
- Advertising and Marketing Agencies
Report Objectives
- To define, describe, and forecast the global 3D Digital Asset market based on component, application, deployment mode, vertical, and region
- To forecast the market size of the five major regional segments: North America, Europe, Asia Pacific, Middle East & Africa, and Latin America
- To strategically analyze the market subsegments concerning individual growth trends, prospects, and contributions to the total market
- To provide detailed information related to the major factors influencing the growth of the market (drivers, restraints, opportunities, and challenges)
- To strategically analyze macro and micro markets concerning growth trends, prospects, and their contributions to the overall market
- To analyze industry trends, patents and innovations, and pricing data related to the 3D Digital Asset market
- To analyze the opportunities in the market for stakeholders and provide details of the competitive landscape for prominent players
- To profile key players in the market and comprehensively analyze their market share/ranking and core competencies
- To track and analyze competitive developments, such as mergers & acquisitions, product developments, and partnerships & collaborations in the market
Available Customizations
With the given market data, MarketsandMarkets offers customizations per the company's specific needs. The following customization options are available for the report:
Product Analysis
- The product matrix provides a detailed comparison of each company's product portfolio.
Geographic Analysis
- Further breakup of the Asia Pacific market into countries contributing 75% to the regional market size
- Further breakup of the North American market into countries contributing 75% to the regional market size
- Further breakup of the Latin American market into countries contributing 75% to the regional market size
- Further breakup of the Middle Eastern & African market into countries contributing 75% to the regional market size
- Further breakup of the European market into countries contributing 75% to the regional market size
Company Information
- Detailed analysis and profiling of additional market players (up to 5)
Get the Full 3D Digital Asset Market Report
Full forecast, segment splits, and company analysis for all 3D Digital Asset Market.
- Canada 3D Digital Asset Market
- US 3D Digital Asset Market
- UK 3D Digital Asset Market
- Germany 3D Digital Asset Market
- France 3D Digital Asset Market
- Italy 3D Digital Asset Market
- China 3D Digital Asset Market
- Japan 3D Digital Asset Market
- South Africa 3D Digital Asset Market
- Brazil 3D Digital Asset Market
- Mexico 3D Digital Asset Market
- Rest Of Europe 3D Digital Asset Market
- Rest Of Apac 3D Digital Asset Market
- Rest Of Latin America 3D Digital Asset Market
- GCC 3D Digital Asset Market
- Rest Of Mea 3D Digital Asset Market
- Rest Of GCC 3D Digital Asset Market
- Saudi Arabia 3D Digital Asset Market
- UAE 3D Digital Asset Market
Need a Tailored Report?
Customize this report to your needs
Get 10% FREE Customization
Customize This Report
