
Europe Cloud FinOps Market (2025-2030)

The Europe Cloud FinOps Market was valued at $2455.8 Million in 2025 and projected to reach to $4157 Million by 2030, representing a compound annual growth rate of 11.1%. Europe's Cloud FinOps market is poised for sustained growth as enterprises across the region intensify their focus on cloud cost management and financial accountability.


| Market Size in | USD 26.32 MN |
| Market Forecast in | |
| CAGR | |
| Forecast Period | |
| Units Considered | Value (USD MN) |
Europe Cloud FinOps Market Trends and Insights
- This 11.1% compound annual growth rate reflects Europe's increasing adoption of cloud cost optimization solutions as enterprises across the region prioritize financial efficiency in their cloud infrastructure spending.
- Europe's mature cloud ecosystem and stringent regulatory environment are driving demand for sophisticated FinOps platforms that enable organizations to manage multi-cloud expenses and optimize resource allocation. The European market benefits from strong digital transformation initiatives and heightened focus on cost governance across financial services, manufacturing, and technology sectors.
- Between 2025 and 2030, Europe is expected to capture significant market share as organizations implement FinOps practices to combat cloud cost overruns and improve operational visibility.
- Europe's emphasis on data sovereignty and compliance further accelerates adoption of localized FinOps solutions that meet regional regulatory requirements..
Key Market Statistics
- CAGR (2025-2030) 11.1% CAGR
- Market Size, 2025 ~USD 2455.8 Million
- Forecast, 2030 ~USD 4157 Million
- Geography Europe
Europe Cloud FinOps Market Overview
Market Valuation & Growth :
Europe's Cloud FinOps market is valued at $2,455.8 million in 2025, with a projected expansion to $4,157.0 million by 2030, representing an 11.1% CAGR. This growth trajectory underscores the region's commitment to optimizing cloud spending across enterprises.
Mature Cloud Infrastructure :
Europe benefits from a mature and well-established cloud ecosystem with widespread enterprise adoption. This foundation enables rapid deployment of FinOps solutions as organizations seek to maximize ROI on existing cloud investments.
Financial Efficiency Priority :
European enterprises increasingly prioritize cloud cost optimization as a strategic initiative. Rising energy costs and regulatory pressures drive demand for sophisticated FinOps tools that provide visibility and control over cloud infrastructure spending.
Regional Market Leadership :
Germany and the UK lead Europe's Cloud FinOps adoption with significant market shares, reflecting strong digital transformation initiatives and enterprise cloud maturity in Western Europe's largest economies.
Europe Cloud FinOps Market Dynamics
- The 11.1% CAGR reflects increasing recognition that FinOps is essential for maintaining competitive advantage in an increasingly cloud-dependent business environment.
- Regulatory compliance requirements, particularly around data governance and financial reporting, further accelerate adoption across sectors. The market expansion is driven by enterprises transitioning from reactive cost-cutting to proactive financial management of cloud resources.
- European organizations are investing in FinOps platforms to achieve better visibility into cloud spending, optimize resource allocation, and align cloud costs with business outcomes.
- This shift positions Europe as a key growth market within the global Cloud FinOps landscape..
Market Ecosystem
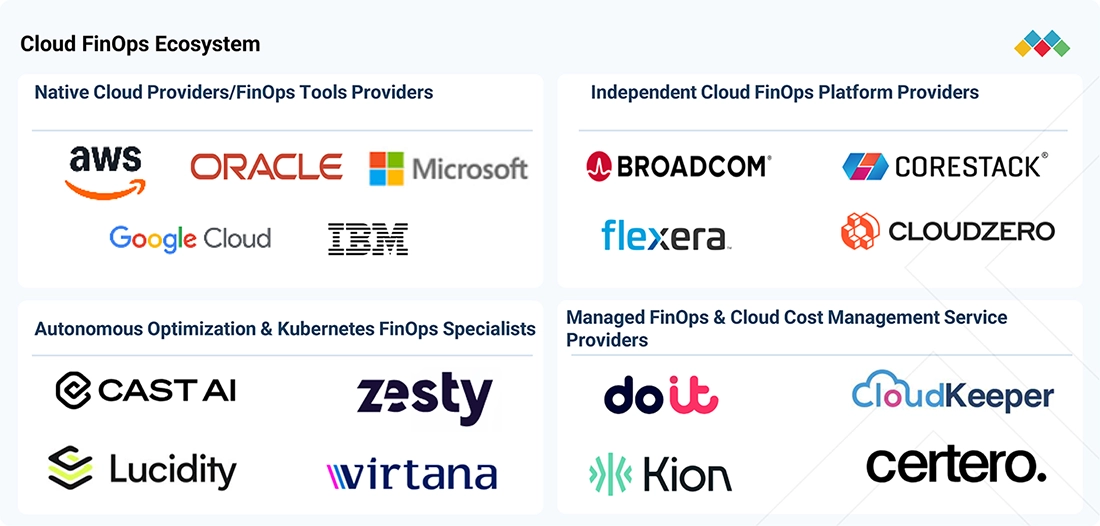
CLOUD FINOPS MARKET: COMMERCIAL USE CASES ACROSS INDUSTRIES
| COMPANY | USE CASE DESCRIPTION | BENEFITS |
|---|---|---|
 |
PicPay linked cloud expenses across 20 business units to accountable engineering teams and business performance metrics using CloudZero's cost intelligence platform. | USD 18.6 million in annualized cloud savings across 2024–2025 | 350+ monthly engineering users | Reduced waste through rightsizing, early intervention, and rate optimization |
 |
InCred Finance deployed CAST AI's automated Kubernetes rebalancing, workload autoscaling, and instance selection capabilities within an already optimized cloud environment. | Approximately 30% monthly compute savings | Operational tasks shortened from seven to three–four days | Additional savings from automated Spot selection |
 |
A major North American financial institution used an AWS FinOps acceleration workshop to translate cost visibility into repeatable team-level optimization actions. | More than USD 1.4 million in annual recurring savings reported | Demonstrates the operational benefit of standardized execution across extensive account estates |
Logos and trademarks shown above are the property of their respective owners. Their use here is for informational and illustrative purposes only.
Related Ecosystem
Cloud Computing
- Software as A Service (SaaS)
- Natural Language Processing (NLP)
- Platform as A Service (PaaS)
- Machine Learning
- Supply Chain Management
- International Business Machines Corporation
- MICROSOFT CORPORATION
- Oracle Corporation
- Amazon.com, Inc.
Software And Services
- Natural Language Processing (NLP)
- Machine Learning
- Supply Chain Management
- Predictive Analytics
- Image Sensors
- International Business Machines Corporation
- MICROSOFT CORPORATION
- Oracle Corporation
- SAP SE
- Amazon.com, Inc.
Key Takeaways
- Europe's Cloud FinOps market will grow from $2,455.8M (2025) to $4,157.0M (2030) at an 11.1% CAGR.
- Europe's mature cloud infrastructure and regulatory compliance requirements drive strong FinOps adoption across the region.
- European enterprises prioritize multi-cloud cost management and financial governance as key drivers of FinOps investment.
- Europe's data sovereignty and GDPR compliance mandates create demand for region-specific FinOps solutions.
Cloud FinOps Market Report Scope
| Report Metric | Details |
|---|---|
| Base Year | 2025 |
| Fastest Growing Segment | HYBRID (Deployment Mode) |
| Forecast Period | 2025–2030 |
| Growth Rate | CAGR of 12.57% from 2025 to 2030 |
| Largest Segment | SOLUTIONS (Offering) |
| Market Size Base Year (Billions) | ~USD 14.89 (2025) |
| Revenue Forecast (Billions) | ~USD 26.91 (2030) |
| Segments Covered | Offering, Solution, Service, Professional Service, Application/Capability, Deployment Environment, Deployment Mode, Service Model, Organization Size, Vertical, Application |
Europe Cloud FinOps Market Report Segmentation
11 segment dimensions are covered across the global market.
By Offering
- Services
- Solutions
By Solution
- Native Solutions
- Third-Party Solutions
By Service
- Managed Services
- Professional Services
By Professional Service
- Finops Advisory & Strategy Services
- Implementation & Integration
- Support & Maintenance
By Application/Capability
- Budgeting & Forecasting
- Cost Allocation & Chargeback
- Cost Management & Optimization
- Other Applications
- Reporting & Analytics
- Workload Management & Optimization
By Deployment Environment
- Multi Cloud
- Single Cloud
By Deployment Mode
- Hybrid
- Private
- Public
By Service Model
- IaaS
- PaaS
- SaaS
By Organization Size
- Large Enterprise
- Large Enterprises
- Smes
By Vertical
- Bfsi
- Government & Public Sector
- Healthcare & Life Sciences
- It & Ites
- Manufacturing
- Media & Entertainment
- Other Verticals
- Retail & Consumer Goods
- Telecommunications
By Application
- Budgeting & Forecasting
- Cost Allocation & Chargeback
- Cost Management & Optimization
- Other Applications
- Reporting & Analytics
- Workload Management & Optimization
EUROPE: CLOUD FINOPS MARKET, BY APPLICATION, 2025–2030
| Segment | 2025 | 2026 | 2027 | 2028 | 2029 | 2030 | CAGR (%) |
|---|---|---|---|---|---|---|---|
| BUDGETING & FORECASTING | 742.6 | 823.6 | 920.9 | 1041.7 | 1197.2 | 1381.3 | 13.2 |
| COST ALLOCATION & CHARGEBACK | 599.7 | 660.7 | 733.8 | 824.7 | 941.6 | 1081.6 | 12.5 |
| COST MANAGEMENT & OPTIMIZATION | 942.2 | 1005.6 | 1080.3 | 1171.9 | 1289.1 | 1450.5 | 9 |
| OTHER APPLICATIONS | 181.9 | 191.1 | 202.5 | 217 | 236.3 | 254 | 6.9 |
| REPORTING & ANALYTICS | 350.7 | 396.4 | 451.7 | 520.8 | 610.1 | 709.6 | 15.1 |
| WORKLOAD MANAGEMENT & OPTIMIZATION | 443.1 | 475.8 | 515.1 | 564.2 | 627.9 | 701.9 | 9.6 |
| TOTAL | 3260.2 | 3553.2 | 3904.3 | 4340.3 | 4902.3 | 5578.9 | 11.3 |
Target Audience
- Cloud FinOps Solution Providers : Vendors and SaaS companies need detailed European market insights to refine product positioning, identify high-growth segments, and develop localized go-to-market strategies for maximum market penetration.
- Enterprise IT & Finance Leaders : CIOs, CFOs, and cloud architects require market intelligence to justify FinOps investments, benchmark spending against peers, and align cloud cost management initiatives with organizational financial goals.
- Management Consulting Firms : Consultants advising European enterprises on cloud transformation need regional market data to provide credible recommendations on FinOps adoption, vendor selection, and cost optimization strategies.
- Investment & Private Equity Firms : Investors evaluating opportunities in the European cloud technology sector require market sizing and growth forecasts to assess portfolio companies, identify acquisition targets, and evaluate market attractiveness.
- System Integrators & Resellers : Implementation partners need regional market insights to identify customer segments, understand demand drivers, and develop service offerings that address Europe's specific cloud cost optimization challenges.
Key Companies in the Europe Cloud FinOps Market
| Company | HQ | Ownership | Strongest segments |
|---|---|---|---|
| MICROSOFT | United States | Public Company | Intelligent Cloud (Azure, server products, GitHub, Nuance, enterprise services),Productivity and Business Processes (Microsoft 365, LinkedIn, Dynamics),Personal Computing (Windows, devices, gaming, search and news advertising), |
| United States | Public Company | Search & Other Ads,YouTube Ads & Subscriptions,Google Cloud (incl. Workspace), | |
| ORACLE | United States | Public Company | Cloud applications (Fusion ERP/EPM/SCM/HCM, NetSuite, Oracle Health, CX),Database and infrastructure technologies (Oracle Database, MySQL, autonomous DB, middleware, Java),Cloud infrastructure (compute, storage, networking, AI/ML, digital assistant, IoT, blockchain), |
| IBM | United States | Public Company | Software (Hybrid Cloud and AI Platforms),Consulting (Strategy, Technology, Managed Services),Infrastructure (Servers, Storage, Lifecycle Services), |
| HITACHI | Japan | Public Company | Digital Systems & Services (IT, cloud, integration),Green Energy & Mobility (power grids, energy, rail),Connective Industries (industrial, automotive, e-mobility), |
| VMWARE | United States | Private Company | Compute & Core Virtualization (vSphere),Hyperconverged & Private Cloud Platform (vSAN, VxRail, VMware Cloud Foundation),Networking & Security (NSX, SASE, Carbon Black), |
| SERVICENOW | United States | Public Company | IT Service & Operations Management,Customer & Field Service Management,Risk, Security & OT / Mission-Critical Operations, |
| DATADOG | United States | Public Company | Infrastructure & APM observability core,Log management & observability pipelines,Digital experience & app analytics (synthetics, RUM, product analytics), |
| NUTANIX | United States | Public Company | Nutanix Cloud Infrastructure (AOS, AHV, core HCI),Nutanix Cloud Manager & Central (operations, cost, security),Data & Storage Services (Unified Storage, Files, Objects, Volumes, Data Lens), |
| AMDOCS | United States | Public Company | CES25 and Customer Engagement / CRM,Monetization and Charging Suites,Intelligent Networking and eSIM / Network Services, |
| BMC SOFTWARE | United States | Private Company | Enterprise Service Management (ITSM, ITOM, ITAM),Mainframe Service Management,Control-M and Enterprise Workload Automation, |
| HCL | India | Public Company | IT and Business Services,Engineering and R&D Services,HCL Software and IP-led Offerings, |
MICROSOFT
Microsoft is a public company founded in 1975 in the United States and employs 228,000 people.
Google is a public company founded in 1998 in the United States with 194,668 employees.
ORACLE
Oracle is a public company founded in 1977 in the United States and has 141,000 employees.
IBM
IBM is a public company founded in 1911 in the United States with 264,300 employees.
HITACHI
Hitachi is a public company founded in 1910 in Japan and employs 287,901 people.
VMWARE
VMware is a private company founded in 1998 in the United States with 38,300 employees.
SERVICENOW
ServiceNow is a public company founded in 2004 in the United States and has 29,187 employees.
DATADOG
Datadog is a public company founded in 2010 in the United States with 8,100 employees.
NUTANIX
Nutanix is a public company founded in 2009 in the United States with 7,800 employees.
AMDOCS
Amdocs is a public company founded in 1982 in the United States and has 26,969 employees.
BMC SOFTWARE
BMC Software is a private company founded in 1980 in the United States with 6,700 employees.
HCL
HCL is a public company founded in 1976 and headquartered in India.
Countries within Europe - compare and drill down
| Country | 2025 size (native) |
|---|---|
| UK | USD 960.6 Million |
| Germany | USD 1074.7 Million |
| France | USD 560.7 Million |
| Italy | USD 414 Million |
| Rest Of Europe | USD 2568.9 Million |
Country market size visualization
Reasons to Buy this Report
- Regional Market Sizing & Forecasts : Obtain precise market valuations for Europe's Cloud FinOps sector with detailed projections through 2030, enabling accurate business planning and investment decisions specific to the European market.
- Country-Level Breakdown Analysis : Access granular market data for key European markets including Germany, UK, France, and Italy, allowing targeted go-to-market strategies and competitive positioning within specific high-value regions.
- Growth Trend Identification : Understand Europe's 11.1% CAGR trajectory and identify emerging opportunities in cloud cost optimization, helping stakeholders capitalize on the region's accelerating FinOps adoption.
- Competitive Landscape Intelligence : Benchmark your organization against regional market dynamics and identify competitive gaps in Europe's Cloud FinOps ecosystem to inform product development and market entry strategies.
- Strategic Investment Guidance : Make informed decisions on resource allocation, partnerships, and expansion plans within Europe by understanding market maturity levels, growth drivers, and regional variations in cloud adoption.
Frequently asked questions
What is the projected size of Europe's Cloud FinOps market by 2030?
Europe's Cloud FinOps market is projected to reach $4,157.0 million by 2030, growing from $2,455.8 million in 2025.
What is the CAGR for Europe's Cloud FinOps market?
Europe's Cloud FinOps market is expected to grow at a compound annual growth rate of 11.1% between 2025 and 2030.
Which industries in Europe are driving Cloud FinOps adoption?
Financial services, manufacturing, and technology sectors in Europe are leading Cloud FinOps adoption due to digital transformation initiatives and cost optimization priorities.
How do regulatory requirements impact Europe's Cloud FinOps market?
Europe's stringent data sovereignty and GDPR compliance requirements drive demand for localized FinOps solutions that meet regional regulatory standards.
What market value growth is expected in Europe between 2025 and 2030?
Europe's Cloud FinOps market is expected to grow by $1,701.2 million, representing a 69.3% increase from 2025 to 2030.
RESEARCH METHODOLOGY
This research study on the cloud FinOps market incorporates extensive secondary research, structured market sizing, and primary research validation. Secondary sources include company annual reports, regulatory filings, investor presentations, earnings transcripts, product documentation, pricing disclosures, acquisition announcements, technical publications, government sources, and industry associations. Research also examines cloud expenditure patterns, FinOps adoption, commitment utilization, AI infrastructure costs, and enterprise financial governance requirements. The primary research framework covers cloud service providers, independent FinOps platform vendors, managed service providers, technology consultants, and enterprise cloud consumers. Supply- and demand-side research is designed to validate market boundaries, revenue attribution, pricing models, adoption patterns, competitive positioning, and growth assumptions. Top-down and bottom-up approaches are used to assess market revenue, followed by data triangulation across offerings, applications, service models, deployment environments, organization sizes, verticals, and geographic markets.
Secondary Research
During the secondary research process, multiple authoritative sources were reviewed to establish the cloud FinOps market's competitive structure, revenue potential, and technology landscape. These sources include company annual reports, regulatory filings, investor presentations, earnings transcripts, product portfolios, subscription pricing, customer case studies, acquisition announcements, partnership disclosures, and official technical documentation. Additional information was gathered from cloud service providers, the FinOps Foundation, FOCUS specifications, government publications, and recognized technology standards organizations. Research examined cloud cost management adoption, enterprise cloud expenditure, multi-cloud financial governance, Reserved Instance and Savings Plan utilization, Kubernetes optimization, AI infrastructure economics, and managed FinOps service delivery. Product-level analysis distinguished native cloud financial management functionality from independently monetized FinOps software and directly associated professional and managed services. Secondary research established the vendor universe, market inclusion and exclusion criteria, revenue estimation assumptions, competitive benchmarks, regional demand indicators, and the initial market-sizing framework.
Primary Research
The primary research framework incorporates supply- and demand-side participants to validate qualitative and quantitative assumptions concerning the cloud FinOps market. Supply-side participants include product directors, FinOps practice leaders, cloud economics specialists, engineering managers, solution architects, business development executives, and commercial strategy professionals. Target organizations include hyperscale cloud providers, independent FinOps software vendors, Kubernetes optimization specialists, managed cloud service providers, system integrators, and technology consulting firms. Demand-side participants include enterprise FinOps practitioners, cloud infrastructure managers, platform engineering leaders, financial planning professionals, IT procurement managers, cloud architects, and technology finance decision-makers. Primary discussions examine purchasing criteria, software pricing, managed service engagement models, commitment optimization, cloud cost allocation, automation maturity, and measurable savings realization. Findings are used to assess customer adoption, vendor differentiation, market segmentation, geographic demand, and the reasonableness of revenue and growth assumptions. Interview-derived findings should be incorporated into the final study only after the corresponding primary interviews are completed and documented.
Breakup of Primary Profiles:
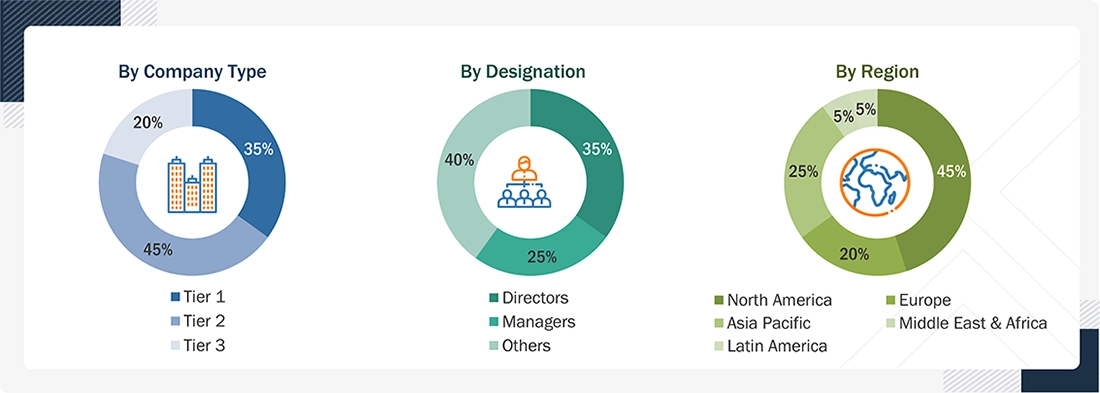
Note: Tier 1 companies have annual revenues of more than USD 1 billion; Tier 2 companies have annual revenues between USD 100 million and USD 1 billion; and Tier 3 companies have annual revenues below USD 100 million. Other designations include professionals working across sales, marketing, engineering, product management, operations, research, cloud architecture, and storage infrastructure.
Source: Industry Experts
To know about the assumptions considered for the study, download the pdf brochure
Market Size Estimation
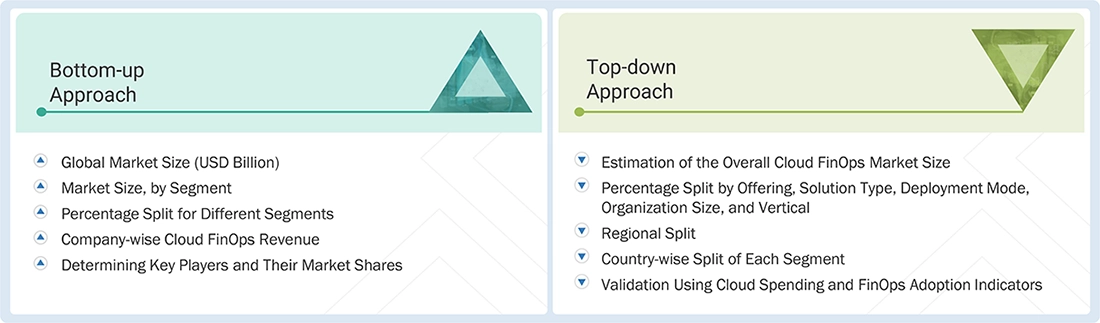
Multiple approaches were used to develop the cloud FinOps market-sizing framework. The bottom-up approach evaluated revenue attributable to cloud financial management software, native and third-party FinOps solutions, managed FinOps services, and associated professional services. Company revenues were assessed using financial disclosures, product-level monetization models, customer references, pricing information, and relevant business segment performance. Revenue estimates were allocated based on supported FinOps capabilities, deployment characteristics, target customers, and geographic exposure. Broader cloud infrastructure consumption, general observability, unrelated IT management software, cloud resale pass-through revenue, and savings delivered to customers were excluded to avoid market overstatement. Estimates were evaluated against cloud expenditure, enterprise FinOps adoption, addressable workloads, provider pricing structures, commitment management requirements, and regional cloud consumption patterns. Market growth assumptions were further assessed using increasing AI infrastructure demand, financial governance requirements, adoption of automated optimization, and the expansion of managed FinOps services.
Market Size Estimation Methodology: Top-down Approach
The top-down approach began by establishing the addressable revenue opportunity for cloud financial management software and directly related services. Global cloud infrastructure expenditure, enterprise software investments, vendor financial disclosures, and cloud financial management adoption indicators were analyzed to identify the portion associated with commercially monetized FinOps capabilities. Particular attention was given to cloud cost visibility, financial planning, anomaly management, commitment optimization, workload rightsizing, and business-value measurement. FinOps spending was distinguished from the underlying cloud consumption it manages, ensuring that cloud infrastructure revenue was not directly classified as FinOps market revenue. The resulting market envelope was assessed using enterprise adoption rates, pricing and licensing structures, managed service penetration, workload complexity, and geographic cloud maturity. The estimates were then distributed across offerings, applications, service models, deployment environments, deployment modes, organization sizes, verticals, regions, and countries. Results were cross-validated against company-level revenue estimates and available evidence on customer adoption and commercial contracts.
Market Size Estimation Methodology: Bottom-up Approach
The bottom-up approach involved developing a comprehensive universe of companies providing cloud FinOps solutions, cloud cost intelligence platforms, as well as commitment optimization, workload optimization, and directly associated managed and professional services. Each company's attributable revenue was assessed using annual reports, regulatory filings, investor disclosures, pricing information, product documentation, customer deployments, acquisition disclosures, and other official sources. For diversified vendors, relevant product and segmental revenues were identified before applying FinOps-specific revenue attribution assumptions. Pure-play vendors were assessed using available revenue disclosures, subscription pricing, customer adoption, product penetration, and estimated contract values. Native cloud provider tools were evaluated separately to distinguish monetized functionality from free capabilities bundled within cloud infrastructure services.
Company-level estimates were aggregated to establish the addressable supply-side revenue pool, with adjustments for reseller pass-through, overlapping product portfolios, acquisitions, and potential revenue duplication. Software and services were separated according to the underlying commercial transaction, while revenue attributable to unrelated infrastructure, general IT management, and non-FinOps services was excluded. The resulting estimates were allocated across applications, service models, deployment categories, customer sizes, verticals, and geographic markets. Regional allocations were assessed using vendor customer distribution, enterprise cloud maturity, purchasing patterns, financial governance requirements, and demand for advanced optimization capabilities.
Cloud FinOps Market: Top-Down and Bottom-Up Approach
Data Triangulation
After establishing the preliminary market size through top-down and bottom-up approaches, data triangulation was applied to reconcile supply-side estimates with demand-side indicators. Company-level FinOps revenues, product portfolios, subscription pricing, customer deployments, managed service penetration, cloud expenditure patterns, and regional adoption indicators were compared to identify inconsistencies. Particular attention was given to preventing double counting between native cloud platforms, third-party solutions, managed service engagements, and cloud resale arrangements. Revenue from acquired products was attributed to the appropriate economic owner, while customer savings, purchasing commitments, and cloud consumption were distinguished from FinOps vendor revenue.
The market estimates were further assessed against cloud infrastructure consumption, enterprise FinOps adoption, AI workload expansion, commitment utilization, cost management maturity, and financial governance requirements. Revenue allocations were reconciled across offerings, applications, service models, deployment environments, organization sizes, verticals, and geographic markets. Historical trends and forecast assumptions were evaluated for consistency with technology adoption, changes in monetization, and increasing automation. Final market figures were established through reconciliation of available evidence and model assumptions, ensuring consistency between global, regional, country-level, and segment estimates.
Market Definition
The cloud FinOps market comprises software solutions and directly associated services that enable organizations to manage, allocate, forecast, govern, and optimize expenditure across cloud-based technology environments. It includes native cloud financial management solutions, independent FinOps platforms, managed FinOps services, and professional services supporting financial visibility, operational efficiency, and cloud spending accountability. Core capabilities include cost and usage reporting, allocation and tagging, budgeting and forecasting, anomaly detection, commitment optimization, workload rightsizing, Kubernetes cost optimization, automated governance, chargeback, and business-value measurement.
Cloud FinOps capabilities support financial management across IaaS, PaaS, and SaaS consumption, including cloud-native applications, distributed infrastructure, and AI workloads. The market excludes underlying cloud infrastructure consumption, cloud resale pass-through revenue, free native billing functionality without separate attributable monetization, unrelated observability and IT management products, customer cost savings, and general consulting services without a direct FinOps component. Revenue is included only where it is attributable to commercial FinOps functionality or directly associated service delivery.
Key Stakeholders
- Hyperscale cloud service providers
- Native cloud financial management solution providers
- Independent and third-party FinOps platform vendors
- Cloud cost visibility and allocation software providers
- Cloud budgeting and forecasting solution providers
- Cloud cost anomaly detection and governance vendors
- Reserved Instance and Savings Plan optimization providers
- Cloud commitment and discount management specialists
- Kubernetes and container cost optimization vendors
- AI infrastructure and GPU cost optimization providers
- Automated workload rightsizing and scheduling vendors
- Managed cloud FinOps service providers
- Cloud financial management consulting firms
- Cloud system integrators and technology service providers
- Enterprise FinOps practitioners and cloud centers of excellence
- Enterprise cloud infrastructure and platform engineering teams
- IT financial management and enterprise procurement teams
Report Objectives
- To define and describe the cloud FinOps market by offering, application, service model, deployment environment, deployment mode, organization size, vertical, and region
- To provide detailed information on major factors influencing market growth, including drivers, restraints, opportunities, and challenges across the cloud FinOps ecosystem
- To strategically analyze micro-markets based on cloud spending patterns, FinOps adoption maturity, workload optimization requirements, and their contribution to overall market growth
- To assess market opportunities for stakeholders and evaluate the competitive landscape across native cloud providers, third-party FinOps platforms, automated optimization specialists, and managed FinOps service providers
- To estimate market size and forecast revenue across North America, Europe, Asia Pacific, Middle East & Africa, and Latin America
- To analyze major countries within each region based on enterprise cloud expenditure, multi-cloud adoption, AI infrastructure investments, financial governance requirements, and FinOps platform adoption
- To strategically profile leading companies and evaluate their FinOps product portfolios, optimization capabilities, geographic presence, business strategies, and competitive positioning
- To examine competitive developments, including product launches, AI-driven optimization capabilities, strategic partnerships, platform integrations, acquisitions, and geographic expansions
- To assess the impact of AI infrastructure spending, Kubernetes adoption, automated cost governance, commitment optimization, and evolving cloud pricing models on market development
Available customizations:
Based on the market data provided, customization can be tailored to specific research requirements. The following customization options can be offered for the cloud FinOps market report.
Product Analysis
-
A detailed product comparison matrix covering native and third-party FinOps solutions, financial management capabilities, commitment optimization, Kubernetes cost management, AI workload cost attribution, automation maturity, pricing structures, deployment models, and geographic availability.
Geographic Analysis Based On Feasibility
- Further breakdown of the North American cloud FinOps market
- Further breakdown of the European cloud FinOps market
- Further breakdown of the Asia Pacific cloud FinOps market
- Further breakdown of the Middle Eastern & African cloud FinOps market
- Further breakdown of the Latin American cloud FinOps market
Company Information
- Detailed analysis and profiling of additional market players (up to five)
Get the Full Cloud FinOps Market Report
Full forecast, segment splits, and company analysis for all Cloud FinOps Market.
- US Cloud FinOps Market
- Canada Cloud FinOps Market
- UK Cloud FinOps Market
- Germany Cloud FinOps Market
- France Cloud FinOps Market
- Italy Cloud FinOps Market
- China Cloud FinOps Market
- India Cloud FinOps Market
- Japan Cloud FinOps Market
- Saudi Arabia Cloud FinOps Market
- UAE Cloud FinOps Market
- South Africa Cloud FinOps Market
- Brazil Cloud FinOps Market
- Mexico Cloud FinOps Market
- Rest Of Europe Cloud FinOps Market
- Rest Of Apac Cloud FinOps Market
Need a Tailored Report?
Customize this report to your needs
Get 10% FREE Customization
Customize This Report