
Asia Pacific Compression Therapy Market (2025-2030)

The Asia Pacific Compression Therapy Market was valued at $911.9 Million in 2025 and projected to reach to $1280.5 Million by 2030, representing a compound annual growth rate of 7.0%. Asia Pacific's compression therapy market is positioned for sustained expansion through 2030, driven by demographic shifts, rising healthcare spending, and increased awareness of venous disease management.


| Market Size in | USD 26.32 MN |
| Market Forecast in | |
| CAGR | |
| Forecast Period | |
| Units Considered | Value (USD MN) |
Asia Pacific Compression Therapy Market Trends and Insights
- Asia Pacific's 7.0% compound annual growth rate outpaces the global average, driven by rising prevalence of chronic venous diseases, increasing geriatric populations, and expanding healthcare infrastructure across the region.
- Asia Pacific's growing awareness of compression therapy benefits and improving reimbursement policies are accelerating market adoption among both healthcare providers and patients. Asia Pacific's compression therapy market is characterized by strong demand from emerging economies and established healthcare systems alike.
- The region's expanding middle class and rising disposable incomes in Asia Pacific are enabling greater access to compression garments and devices.
- Between 2025 and 2030, Asia Pacific is expected to see significant innovation in product design, increased clinical validation studies, and strategic partnerships among manufacturers seeking to capture this high-growth market..
Key Market Statistics
- CAGR (2025-2030) 7.0% CAGR
- Market Size, 2025 ~USD 911.9 Million
- Forecast, 2030 ~USD 1280.5 Million
- Geography Asia Pacific
Asia Pacific Compression Therapy Market Overview
Outpacing Global Growth :
Asia Pacific's compression therapy market grows at 7.0% CAGR, significantly exceeding the global average of 5.5%, reflecting strong regional demand and market maturation.
Aging Demographics Drive Demand :
Rapidly expanding geriatric populations across China, Japan, and India are increasing prevalence of chronic venous diseases, creating sustained demand for compression therapy solutions.
Healthcare Infrastructure Expansion :
Emerging economies in Asia Pacific are investing heavily in healthcare infrastructure, improving access to compression therapy products and clinical services across urban and semi-urban areas.
Market Scale & Opportunity :
Valued at $911.9 million in 2025 and projected to reach $1,280.5 million by 2030, Asia Pacific represents a $368.6 million growth opportunity over five years.
Asia Pacific Compression Therapy Market Dynamics
- China, Japan, and India lead regional growth, supported by improving healthcare accessibility and growing middle-class populations seeking preventive and therapeutic solutions.
- The region's 7.0% CAGR reflects both developed market maturity in Japan and Australia, and emerging market potential in India and Southeast Asia, creating diverse opportunities across product segments and distribution channels..
Market Ecosystem
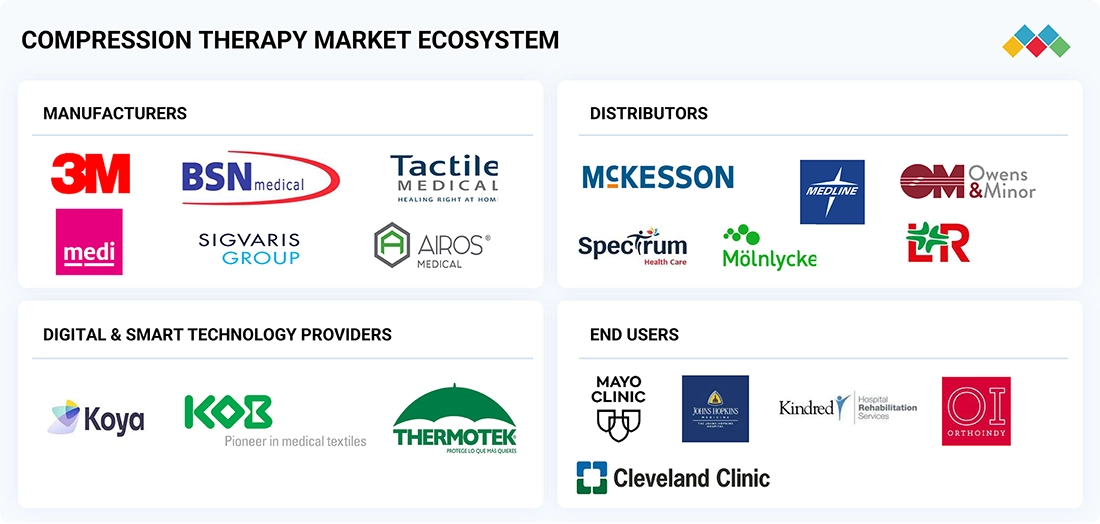
Compression Therapy Market: COMMERCIAL USE CASES ACROSS INDUSTRIES
| COMPANY | USE CASE DESCRIPTION | BENEFITS |
|---|---|---|
 |
Use of graduated compression stockings to manage chronic venous insufficiency (CVI) in elderly patients | Enhances venous circulation, alleviates leg swelling, improves mobility, and elevates overall quality of life. |
 |
Implementation of compression therapy for lymphedema management in post-cancer care patients. | Decreased limb volume, prevention of infection, pain reduction, and improved lymph drainage |
 |
Utilization of compression garments for the prevention of deep vein thrombosis (DVT) in post-operative patients | Reduced incidence of DVT, enhanced blood flow, shortened recovery time |
 |
Application of multi-layer compression bandaging in the treatment of venous leg ulcers. Application of multi-layer compression bandaging in the treatment of venous leg ulcers. | Accelerated wound healing, reduced edema, and improved patient compliance |
Logos and trademarks shown above are the property of their respective owners. Their use here is for informational and illustrative purposes only.
Related Ecosystem
Medical Devices
Key Takeaways
- Asia Pacific compression therapy market will grow from $911.9M (2025) to $1,280.5M (2030) at a 7.0% CAGR, outpacing global growth.
- Asia Pacific's aging population and rising chronic disease prevalence are primary drivers of compression therapy demand through 2030.
- Asia Pacific's emerging economies offer untapped growth potential as healthcare infrastructure and reimbursement frameworks improve.
- Asia Pacific manufacturers are investing in product innovation and regional partnerships to capitalize on the expanding market opportunity.
Compression Therapy Market Report Scope
| Report Metric | Details |
|---|---|
| Base Year | 2025 |
| Fastest Growing Segment | LYMPHEDEMA TREATMENT (Application) |
| Forecast Period | 2025–2030 |
| Growth Rate | CAGR of 5.5% from 2025 to 2030 |
| Largest Segment | STATIC COMPRESSION THERAPY (Technique) |
| Market Size Base Year (Billions) | ~USD 4.51 (2025) |
| Revenue Forecast (Billions) | ~USD 5.9 (2030) |
| Segments Covered | Product, Technique, Application, Distribution Channel, Type |
Asia Pacific Compression Therapy Market Report Segmentation
5 segment dimensions are covered across the global market.
By Product
- Compression Bandages
- Compression Braces
- Compression Stockings
- Compression Tapes
- Compression Wraps
- Other Compression Garments
- Pneumatic Compression Devices
By Technique
- Dynamic Compression Therapy
- Static Compression Therapy
By Application
- Deep Vein Thrombosis Treatment
- Leg Ulcer Treatment
- Lymphedema Treatment
- Other Applications
- Varicose Vein Treatment
By Distribution Channel
- E-Commerce Platforms
- Home Care Settings
- Hospitals & Clinics
- Pharmacies & Retailers
By Type
- Class I
- Class Ii
- Class Iii
- Intermittent Compression Devices
- Sequential Compression Devices
Target Audience
- Medical Device Manufacturers : Compression therapy companies need Asia Pacific market data to expand product distribution, identify high-growth countries, and develop region-specific clinical and commercial strategies.
- Healthcare Investors & PE Firms : Investment professionals require detailed regional market sizing and forecasts to evaluate acquisition targets, fund allocation decisions, and portfolio company growth opportunities in Asia Pacific.
- Hospital & Clinic Operators : Healthcare facility managers need market insights to justify compression therapy program investments, understand patient demand trends, and optimize inventory and service offerings.
- Pharmaceutical & Distribution Partners : Distributors and pharmaceutical partners require country-level market data to negotiate supply agreements, forecast demand, and prioritize market entry or expansion in Asia Pacific regions.
- Market Research & Strategy Consultants : Consulting firms need comprehensive Asia Pacific data to support client strategy development, competitive analysis, and market entry planning for compression therapy and related healthcare sectors.
Key Companies in the Asia Pacific Compression Therapy Market
| Company | HQ | Ownership | Strongest segments |
|---|---|---|---|
| DEVON MEDICAL PRODUCTS | United States | Private Company | Pneumatic compression (dynamic),Stockings (static),Wraps and bandages (static), |
| KINDRED HEALTHCARE INC. | United States | Private Company | Bandage,Wraps,Stockings, |
| BEIERSDORF AG | Germany | Public Company | Bandages,Wraps,Stockings, |
| SOLVENTUM CORPORATION (3M) | United States | ||
| ENOVIS CORPORATION | United States | Public Company | Static compression (bandages, wraps, stockings, tapes),Braces with integrated compression,Dynamic/pneumatic compression systems, |
| BSN MEDICAL (A SUBSIDIARY OF ESSITY) | Sweden | ||
| CARDINAL HEALTH | United States | Public Company | Bandages & Wraps,Stockings,Tapes, |
| TACTILE MEDICAL | United States | Public Company | Pneumatic compression systems (Flexitouch Plus, Entre Plus, Nimbl),Software and digital engagement (Kylee app, connectivity, services),Non-compression respiratory therapy (AffloVest), |
| CONVATEC INC. | United Kingdom | Public Company | Static compression (bandages, wraps, stockings, tapes, braces),Dynamic compression (pneumatic devices), |
| MEDI GMBH & CO. KG | Taiwan | Public Company | Stockings (Static),Wraps & Braces (Static),Bandages & Tapes (Static), |
| PAUL HARTMANN | Germany | Public Company | Bandages (compression, universal, zinc paste, padding),Wraps and Stockings,Tapes and Braces, |
| SMITH+NEPHEW | United Kingdom | Public Company | Bandage,Wraps,Stockings, |
DEVON MEDICAL PRODUCTS
Devon Medical Products is a private medical products company founded in 2005 and based in the United States.
KINDRED HEALTHCARE INC.
Kindred Healthcare Inc. is a private healthcare company founded in 1985 in the United States with 64,200 employees.
BEIERSDORF AG
Beiersdorf AG is a German public company founded in 1882 with 21,589 employees, operating in the healthcare and consumer goods sectors.
SOLVENTUM CORPORATION (3M)
Insufficient data available to provide a business description for Solventum Corporation (3M).
ENOVIS CORPORATION
Enovis Corporation is a public medical technology company founded in 1995 in the United States with 7,802 employees.
BSN MEDICAL (A SUBSIDIARY OF ESSITY)
Insufficient data available to provide a business description for BSN Medical (a subsidiary of Essity).
CARDINAL HEALTH
Cardinal Health is a public healthcare services and pharmaceutical distribution company founded in 1979 in the United States with 55,392 employees.
TACTILE MEDICAL
Tactile Medical is a public medical device company founded in 1995 in the United States with 1,086 employees.
CONVATEC INC.
ConvaTec Inc. is a public medical products and healthcare company founded in 1978 in the United Kingdom with 10,910 employees.
MEDI GMBH & CO. KG
Medi GmbH & Co. KG is a public medical device company founded in 1997 based in Taiwan with 17,449 employees.
PAUL HARTMANN
Paul Hartmann is a German public healthcare company founded in 1818 with 10,066 employees.
SMITH+NEPHEW
Smith+Nephew is a public medical devices and healthcare company founded in 1856 in the United Kingdom with 16,988 employees.
Countries within Asia Pacific - compare and drill down
| Country | 2025 size (native) |
|---|---|
| China | USD 91.7 Million |
| Japan | USD 88 Million |
| India | USD 75.3 Million |
| Australia | USD 59.3 Million |
| South Korea | USD 35.8 Million |
| Rest Of Asia Pacific | USD 40.5 Million |
Country market size visualization
Reasons to Buy this Report
- Regional Growth Intelligence : Gain detailed insights into Asia Pacific's 7.0% CAGR and understand market dynamics that outpace global averages, enabling strategic positioning in high-growth territories.
- Country-Level Market Data : Access granular market sizing for China, Japan, India, Australia, and South Korea to identify priority markets and tailor go-to-market strategies by geography.
- Demographic & Healthcare Trends : Understand aging population dynamics and healthcare infrastructure expansion driving compression therapy adoption across Asia Pacific's diverse economies.
- Competitive Landscape Clarity : Benchmark regional market performance against global trends and identify competitive opportunities in emerging versus mature Asia Pacific markets.
- 5-Year Forecast Planning : Leverage 2025-2030 projections to develop long-term business strategies, investment decisions, and product development roadmaps aligned with regional growth trajectories.
Frequently asked questions
What is the current size of the Asia Pacific compression therapy market?
The Asia Pacific compression therapy market is valued at $911.9 million in 2025 and is projected to reach $1,280.5 million by 2030.
What is the growth rate for compression therapy in Asia Pacific?
Asia Pacific's compression therapy market is growing at a compound annual growth rate (CAGR) of 7.0% from 2025 to 2030.
What factors are driving growth in the Asia Pacific compression therapy market?
Key drivers include rising prevalence of chronic venous diseases, an aging population, expanding healthcare infrastructure, improved reimbursement policies, and increasing awareness of compression therapy benefits across Asia Pacific.
How does Asia Pacific's compression therapy market compare to global growth?
Asia Pacific's 7.0% CAGR exceeds the global compression therapy market CAGR of 5.5%, indicating stronger regional growth momentum.
Which countries in Asia Pacific are expected to drive market growth?
Emerging economies in Asia Pacific with expanding middle classes and improving healthcare systems are expected to be key growth drivers, alongside established markets with aging populations.
RESEARCH METHODOLOGY
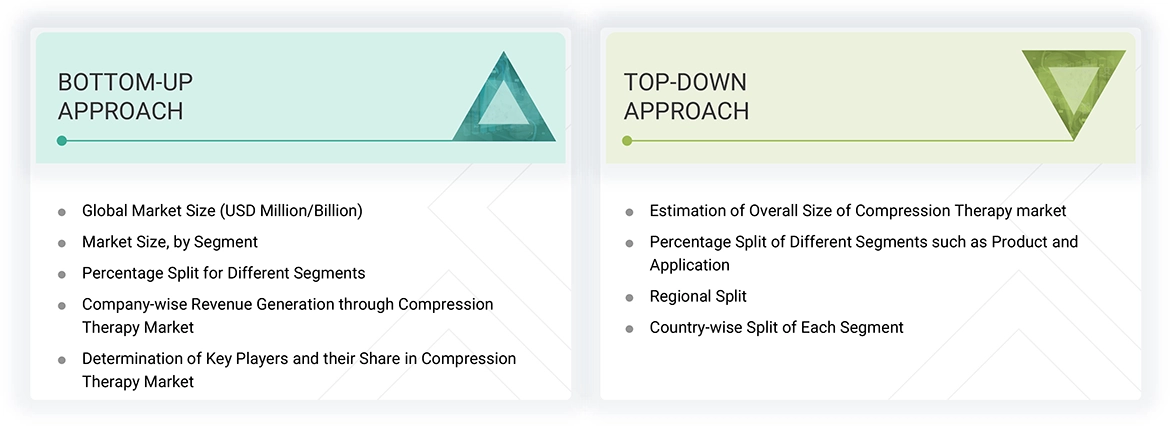
The size of the compression therapy market was based on four primary studies to ensure accuracy. Initial data for the compression therapy market and related sectors was gathered from 3 to 5 secondary sources. This information was then validated through primary research to confirm the assumptions and overall market sizing. Both top-down and bottom-up approaches were employed to determine the total market size, which was subsequently refined into segment and subsegment sizes. Finally, data triangulation was conducted to verify the accuracy of the findings.
Secondary Research
Secondary research sources included directories, Factiva, white papers, Bloomberg Business, annual reports, SEC filings, business filings, and investor presentations. These sources offered valuable insights into market leaders, sector divisions, and technological differences within various segments of the compression therapy industry.
Primary Research
Primary research consisted of both quantitative and qualitative insights gathered through interviews with key stakeholders. On the demand side, participants included physicians, researchers, department heads, and staff from diagnostic centers, hospitals, and research institutes. On the supply side, interviews were conducted with CEOs, area sales managers, territory and regional sales managers, and other top executives from relevant companies. These direct conversations helped validate the findings from secondary research and provided an opportunity to directly question and confirm assumptions.
A breakdown of the primary respondents is provided below.
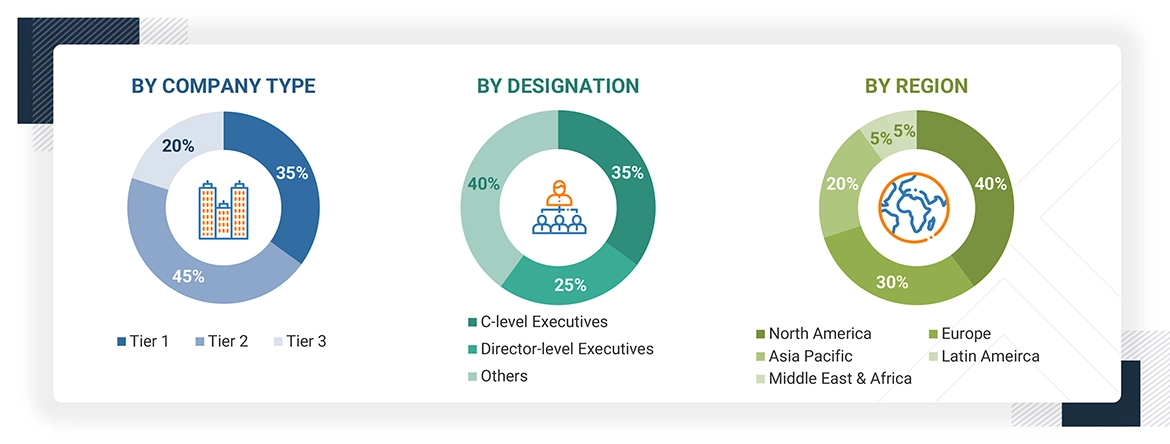
Note q: Others include sales managers, marketing managers, business development managers, product managers, distributors, and suppliers.
Note 2: Companies are classified into tiers based on their total revenue. As of 2024, Tier 1 = >USD 1 billion, Tier 2 = < USD 500 million, and Tier 3 = < USD 100 million.
To know about the assumptions considered for the study, download the pdf brochure
Market Size Estimation
This report utilized the revenue share analysis of major companies to evaluate the size of the global compression therapy market. This analysis involved identifying key market participants and calculating their revenue from compression therapy using a variety of data collected during both primary and secondary research phases. One aspect of the secondary research included reviewing the annual and financial reports of leading market players. Conversely, primary research consisted of detailed interviews with influential thought leaders, including directors, CEOs, and key marketing executives.
To determine the overall market value, the segmental revenue was calculated by mapping the revenue of the leading solution and service providers. The process involved several steps.
- Making a list of leading international companies in the compression therapy industry
- Charting annual profits made by leading companies in the compression therapy sector (or the closest stated business unit/product category)
- 2024 revenue mapping of leading companies to cover a significant portion of the global market
- Calculating the global value of the compression therapy industry
Global Compression Therapy Market: Bottom-up and Top-down Approach
Data Triangulation
To ensure accurate data, the compression therapy market was divided into various segments and subsegments. A data triangulation process that used both top-down and bottom-up approaches was applied. This involved analyzing factors and trends from both the demand and supply sides to validate the findings for each segment. The combination of this segmentation with the triangulation process helps ensure that the market data is both accurate and reliable.
Market Definition
Compression therapy is the process of applying controlled pressure to the lower extremities to increase and improve blood flow to the heart. This mode of treatment utilizes the elastic properties of compression garments or the pneumatic force of compression devices to address specific clinical requirements as part of disease management. The compression therapy market is primarily used for managing venous disorders, lymphedema, wound care, post-surgical recovery, and sports injuries. It enhances blood circulation, reduces swelling, and promotes healing, commonly through compression garments, bandages, and devices like pneumatic pumps. Key settings include hospitals, clinics, and home care.
Stakeholders
- Manufacturers of compression garments, bandages, and devices
- Healthcare providers such as hospitals, clinics, and rehabilitation centers
- Patients using compression therapy for various conditions
- Healthcare professionals, including physicians, surgeons, and physiotherapists
- Insurance companies involved in reimbursement and coverage
- Regulatory bodies overseeing product standards and safety
- Suppliers and distributors of compression therapy products
- Research & development firms focusing on innovation and technology in compression therapy
Report Objectives
- To define, describe, and forecast the compression therapy market based on product, application, technique, distribution channel, and region
- To provide detailed information regarding the major factors influencing the growth of the market (drivers, restraints, opportunities, and industry-specific challenges)
- To strategically analyze micromarkets with respect to individual growth trends, prospects, and contributions to the total market
- To analyze opportunities in the market for stakeholders and provide details of the competitive landscape for market leaders
- To forecast the revenue of the market segments with respect to five regions: North America, Europe, the Asia Pacific, Latin America, and the Middle East & Africa
- To profile the key players and comprehensively analyze their market ranking and core competencies
- To benchmark players within the market using a proprietary Company Evaluation Matrix framework, which analyzes market players on various parameters within the broad categories of business strategy excellence and strength of product portfolio
- To analyze competitive developments such as product launches, agreements, expansions, collaborations, and acquisitions in the compression therapy market
Get the Full Compression Therapy Market Report
Full forecast, segment splits, and company analysis for all Compression Therapy Market.
- US Compression Therapy Market
- Canada Compression Therapy Market
- Germany Compression Therapy Market
- France Compression Therapy Market
- UK Compression Therapy Market
- Italy Compression Therapy Market
- Spain Compression Therapy Market
- China Compression Therapy Market
- Japan Compression Therapy Market
- India Compression Therapy Market
- Australia Compression Therapy Market
- South Korea Compression Therapy Market
- Brazil Compression Therapy Market
- Mexico Compression Therapy Market
- Rest Of Europe Compression Therapy Market
- Rest Of Asia Pacific Compression Therapy Market
- Rest Of Latin America Compression Therapy Market
Need a Tailored Report?
Customize this report to your needs
Get 10% FREE Customization
Customize This Report
