
Asia Pacific Drylab Photo Printing Market (2024-2029)

The Asia Pacific Drylab Photo Printing Market was valued at $136.5 Million in 2024 and projected to reach to $184.6 Million by 2029, representing a compound annual growth rate of 6.2%. The Asia Pacific drylab photo printing market is positioned for sustained growth through 2029, driven by increasing digitalization of photography services and growing consumer demand for high-quality printed images.


| Market Size in | USD 26.32 MN |
| Market Forecast in | |
| CAGR | |
| Forecast Period | |
| Units Considered | Value (USD MN) |
Asia Pacific Drylab Photo Printing Market Trends and Insights
- Asia Pacific's market expansion is driven by rising demand for high-quality digital imaging solutions across professional photography, retail, and commercial printing sectors.
- The region's growing middle class and increasing adoption of digital photography technologies are accelerating market penetration in Asia Pacific. Asia Pacific is witnessing accelerated investment in printing infrastructure and technological advancement in drylab systems.
- The 6.2% compound annual growth rate in Asia Pacific outpaces the global average, reflecting strong regional demand dynamics.
- Key markets within Asia Pacific, including China, Japan, and India, are contributing significantly to this growth trajectory through 2029..
Key Market Statistics
- CAGR (2024-2029) 6.2% CAGR
- Market Size, 2024 ~USD 136.5 Million
- Forecast, 2029 ~USD 184.6 Million
- Geography Asia Pacific
Asia Pacific Drylab Photo Printing Market Overview
Market Valuation & Growth :
Asia Pacific drylab photo printing market valued at $136.5 million in 2024, expanding at 6.2% CAGR to reach $184.6 million by 2029, outpacing the global growth rate of 5.4%.
China's Market Dominance :
China leads the Asia Pacific region with $84.7 million market share, representing over 62% of the regional market and driving significant growth through advanced manufacturing and digital imaging adoption.
Emerging Growth Drivers :
Rising middle-class populations across Asia Pacific, increased professional photography demand, and expanding retail and commercial printing sectors are fueling robust market expansion in the region.
Key Regional Players :
Japan ($31.8M) and India ($32.3M) represent secondary growth markets, with South Korea ($16.8M) contributing to the region's technological advancement in drylab printing solutions.
Asia Pacific Drylab Photo Printing Market Dynamics
- The region's expanding e-commerce platforms and retail photography services are creating new opportunities for drylab technology adoption across professional and commercial segments. Key growth catalysts include rising disposable incomes, urbanization trends, and technological innovations in digital imaging.
- Investment in photography infrastructure and the proliferation of professional photography studios across major cities will continue to support market expansion.
- Asia Pacific's competitive manufacturing landscape and cost advantages position the region as a critical hub for drylab equipment production and service delivery..
Market Ecosystem
Related Ecosystem
Electronics System And Components
- Sensors
- Temperature Sensors
- Pressure Sensors
- Actuators
- Image Sensors
- Lenovo
- Samsung
- Texas Instruments Incorporated
- HONEYWELL INTERNATIONAL INC.
- Teledyne Technologies Incorporated
Digitalization And Iot
- Sensors
- Remote Monitoring
- Supply Chain Management
- Passenger Information System (PIS)
- Platform as A Service (PaaS)
- International Business Machines Corporation
- Cisco Systems, Inc.
- MICROSOFT CORPORATION
- Oracle Corporation
- HUAWEI TECHNOLOGIES CO LTD
Key Takeaways
- Asia Pacific drylab photo printing market valued at $136.5M in 2024, growing to $184.6M by 2029 at 6.2% CAGR
- Asia Pacific's growth rate exceeds global average, driven by digital photography adoption and infrastructure investment
- Professional photography and retail printing segments are primary growth drivers in Asia Pacific
- Asia Pacific represents a high-potential market with expanding middle-class consumer base and technological modernization
Drylab Photo Printing Market Report Scope
| Report Metric | Details |
|---|---|
| Base Year | 2024 |
| Fastest Growing Segment | NON-COMMERCIAL (End User) |
| Forecast Period | 2024-2029 |
| Growth Rate | CAGR of 5.4% from 2024 to 2029 |
| Largest Segment | COMMERCIAL (End User) |
| Market Size Base Year (Billions) | ~USD 0.31 (2024) |
| Revenue Forecast (Billions) | ~USD 0.4 (2029) |
| Segments Covered | Offering, End User, Connectivity, Print Width |
Asia Pacific Drylab Photo Printing Market Report Segmentation
4 segment dimensions are covered across the global market.
By Offering
- After-Sales Services
- Printers
By End User
- Commercial
- Non-Commercial
By Connectivity
- Wired
- Wireless
By Print Width
- 4 To 6 Inches
- Above 6 Inches
- Below 4 Inches
Target Audience
- Equipment Manufacturers : Drylab equipment producers need Asia Pacific market data to identify expansion opportunities, assess competitive positioning in China and Japan, and develop region-specific product strategies.
- Photography Service Providers : Professional photography studios and retail printing services require market insights to understand demand trends, investment opportunities, and technology adoption patterns across Asia Pacific regions.
- Technology Investors : Private equity and venture capital firms targeting digital imaging and printing technology need comprehensive Asia Pacific market analysis to evaluate investment returns and growth potential.
- Distribution & Retail Partners : Distributors and retailers of drylab solutions require country-level market data to optimize inventory, identify high-demand regions, and develop targeted go-to-market strategies in Asia Pacific.
- Market Consultants & Analysts : Business consultants and research firms need detailed Asia Pacific cutout data to support client advisory services, competitive benchmarking, and strategic planning initiatives in the region.
Countries within Asia Pacific - compare and drill down
| Country | 2025 size (native) |
|---|---|
| China | USD 84.7 Million |
| Japan | USD 31.8 Million |
| India | USD 32.3 Million |
| South Korea | USD 16.8 Million |
| Rest Of Asia Pacific | USD 19 Million |
Country market size visualization
Reasons to Buy this Report
- Regional Market Intelligence : Gain comprehensive insights into Asia Pacific's $136.5M drylab photo printing market with country-level breakdowns for China, Japan, India, and South Korea to identify high-potential investment zones.
- Growth Trajectory Analysis : Understand the 6.2% CAGR expansion dynamics specific to Asia Pacific, outperforming global growth rates and revealing emerging opportunities in professional and retail photography segments.
- Competitive Landscape Mapping : Identify key market players and competitive positioning across major Asia Pacific economies, enabling strategic market entry and partnership development in high-growth segments.
- Demand Driver Insights : Access detailed analysis of region-specific growth catalysts including rising middle-class adoption, digital imaging trends, and commercial printing expansion across Asia Pacific markets.
- Forecast-Driven Strategy : Leverage 2029 market projections ($184.6M) to develop long-term business strategies, resource allocation plans, and market expansion roadmaps tailored to Asia Pacific dynamics.
Frequently asked questions
What is the current market size of drylab photo printing in Asia Pacific?
The Asia Pacific drylab photo printing market was valued at $136.5 million in 2024 and is expected to reach $184.6 million by 2029.
What is the growth rate for drylab photo printing in Asia Pacific?
Asia Pacific is experiencing a compound annual growth rate (CAGR) of 6.2% from 2024 to 2029, outpacing the global average.
Which countries drive the Asia Pacific drylab photo printing market?
Key markets in Asia Pacific include China, Japan, and India, which are major contributors to regional growth through increased digital photography adoption and commercial printing demand.
What factors are driving growth in Asia Pacific's drylab photo printing market?
Growth in Asia Pacific is driven by rising digital photography adoption, expanding middle-class consumers, increased investment in printing infrastructure, and technological advancement in drylab systems.
How does Asia Pacific's market growth compare to global trends?
Asia Pacific's 6.2% CAGR exceeds the global average of 5.4%, indicating stronger regional demand and market potential through 2029.
RESEARCH METHODOLOGY
The research report includes four major activities, estimating the size of the drylab photo printing market. Secondary research has been done to gather important information about the market and peer markets. To validate the findings, assumptions, and sizing with the primary research with industry experts across the supply chain is the next step. Both bottom-up and top-down approaches have been used to estimate the market size. After this, the market breakdown and data triangulation have been adopted to estimate the market sizes of segments and sub-segments.
Secondary Research
Revenues of companies offering drylab photo printing across the world have been obtained based on the secondary data made available through paid and unpaid sources. They have also been derived by analyzing the product portfolios of key companies and rated according to the performance and quality of their products.
In the secondary research process, various sources have been referred to for identifying and collecting information for this study on the drylab photo printing market. Secondary sources considered for this research study include government sources, corporate filings (such as annual reports, investor presentations, and financial statements), and trade, business, and professional associations. Secondary data has been collected and analyzed to determine the overall market size, further validated through primary research.
Secondary research has been mainly used to obtain key information about the supply chain of the drylab photo printing industry to identify the key players based on their products and the prevailing industry trends in the drylab photo printing market based on offering, connectivity, print width, end-user, and region. It also includes information about the key developments undertaken from both market- and technology-oriented perspectives.
Primary Research
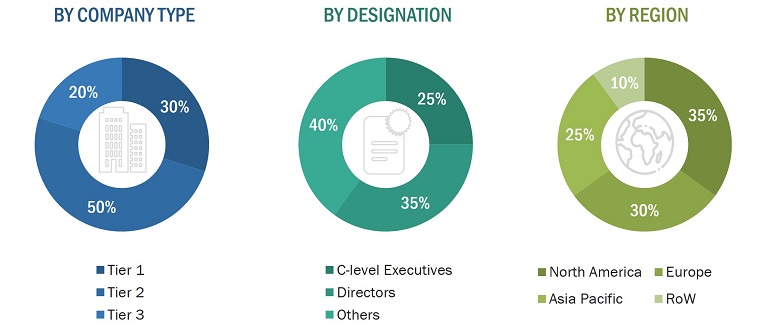
In the primary research process, various primary sources have been interviewed to obtain qualitative and quantitative information related to the market across four main regions-North America, Europe, Asia Pacific, and Row (Rest of the World). Primary sources from the supply side include industry experts such as CEOs, vice presidents, marketing directors, technology directors, and a few other related key executives from major companies and organizations operating in the drylab photo printing market or related markets.
After the completion of market engineering, primary research has been conducted to gather information and verify and validate critical numbers obtained from other sources. Primary research has also been conducted to identify various market segments, industry trends, key players, competitive landscape, and key market dynamics, such as drivers, restraints, opportunities, and challenges, along with the key strategies market players adopt. Most of the primary interviews have been conducted with the supply side of the market. This primary data has been collected through questionnaires, emails, and telephonic interviews.
To know about the assumptions considered for the study, download the pdf brochure
Market Size Estimation
In the market engineering process, both the top-down and bottom-up approaches have been used, along with several data triangulation methods, to perform market estimation and forecasting for the overall market segments and subsegments listed in this report. Extensive qualitative and quantitative analyses have been performed on the market engineering process to list key information/insights.
Key market players have been identified through secondary research, and their market shares have been determined through primary and secondary research. This involves studying their annual and financial reports and interviews with industry experts (such as CEOs, VPs, directors, and marketing executives) for key insights—both quantitative and qualitative.
All percentage shares, splits, and breakdowns have been determined using secondary sources and verified through primary sources. All possible parameters that may affect the markets covered in this research study have been accounted for, viewed in extensive detail, verified through primary research, and analyzed to obtain the final quantitative and qualitative data. This data has been consolidated and supplemented with detailed input and analysis from MarketsandMarkets and presented in the report.
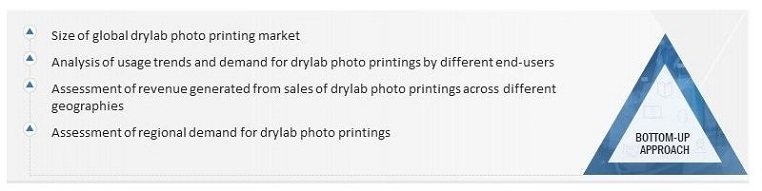
Market Size Estimation Methodology-Bottom-up Approach
A bottom-up approach has been employed to arrive at the overall size of the drylab photo printing market from the calculations based on the revenues of the key players and their shares in the market. Key players in the drylab photo printing market have been studied. The market size estimations have been carried out considering the market size of their drylab photo printing offerings
Market Size Estimation Methodology-Top Down Approach
In the top-down approach, the overall market size has been used to estimate the size of individual markets through percentage splits from secondary and primary research.
The most appropriate parent market size has been used to implement the top-down approach for the calculation of specific market segments.
The revenue shares used earlier in the bottom-up approach were verified by identifying and estimating the market share for each company. The overall parent market size and individual market sizes have been determined and confirmed in this study through the data triangulation process and data validation through the primary interviews.

Data Triangulation
After arriving at the overall market size from the market size estimation process explained above, the total market has been then splits into several segments and sub-segments. Data triangulation has been employed to complete the market engineering process and arrive at the exact statistics for all segments and sub-segments. The data has been triangulated by studying various factors and trends from both the demand and supply sides. Along with this, the market has been validated using both the top-down and bottom-up approaches.
Market Definition
A drylab photo printing system represents an advanced printing solution that employee’s thermal dye-sublimation technology, ensuring the creation of high-quality and long-lasting photo prints. Diverging from the conventional approach employed by traditional photo printers utilizing wet chemicals, drylab printing offers a range of notable advantages. These include but are not limited to, superior print quality, accelerated printing speeds, compatibility with various media types, scalability to meet varying production demands, operational efficiency, cleanliness due to the absence of wet chemicals, and a user-friendly interface that facilitates seamless functionality.
These drylab printers offer a compelling amalgamation of premium printing output, rapid production speeds, versatility in handling diverse media formats, and operational efficiency. This convergence positions them as the preferred choice for professionals and businesses seeking top-notch photo prints with the added benefit of expedited turnaround times. The comprehensive features of drylab photo printing contribute to an elevated standard in image reproduction, providing a reliable and efficient solution for those with discerning requirements in the realm of photography and print production.
Key Stakeholders
- Original device manufacturers (ODMs)
- Drylab photo printing hardware and solution providers
- Component suppliers
- Research organizations and consulting companies
- Sub-component manufacturers
- Technology providers
- Drylab photo printing-related associations, organizations, forums, and alliances
- Investors
- Retailers
- Photography professionals
The main objectives of this study are as follows:
- To describe and forecast the drylab photo printing market based on offering, connectivity, print width, end user, and region in terms of value.
- To describe and forecast the market, in terms of value, for various segments in four key regions, namely, North America, Europe, Asia Pacific, and Rest of the World (RoW).
- To provide detailed information regarding the drivers, restraints, opportunities, and challenges influencing the growth of the market
- To analyze the micromarkets1 with respect to individual growth trends, prospects, and contribution to the total market.
- To provide a detailed overview of the drylab photo printing supply chain and its industry trends.
- To analyze opportunities in the market for various stakeholders by identifying the high-growth segments of the market.
- To profile the key players and comprehensively analyze their market position in terms of the market share and core competencies2, along with a detailed competitive landscape for the market leaders.
- To analyze competitive developments such as partnerships, collaborations, acquisitions, and product launches in the drylab photo printing market.
Available Customizations:
With the given market data, MarketsandMarkets offers customizations according to the specific requirements of companies. The following customization options are available for the report:
- Country-wise Information for Asia Pacific
- Detailed analysis and profiling of additional market players (up to five)
Get the Full Drylab Photo Printing Market Report
Full forecast, segment splits, and company analysis for all Drylab Photo Printing Market.
- Germany Drylab Photo Printing Market
- China Drylab Photo Printing Market
- Japan Drylab Photo Printing Market
- US Drylab Photo Printing Market
- Canada Drylab Photo Printing Market
- Mexico Drylab Photo Printing Market
- France Drylab Photo Printing Market
- Rest Of Europe Drylab Photo Printing Market
- UK Drylab Photo Printing Market
- India Drylab Photo Printing Market
- Rest Of Asia Pacific Drylab Photo Printing Market
- South Korea Drylab Photo Printing Market
- GCC Countries Drylab Photo Printing Market
Need a Tailored Report?
Customize this report to your needs
Get 10% FREE Customization
Customize This Report
