
India Microplastic Detection Market (2024-2029)

The India Microplastic Detection Market was valued at $548.1 Million in 2024 and projected to reach to $757 Million by 2029, representing a compound annual growth rate of 6.7%. India's microplastic detection market is poised for sustained growth driven by heightened environmental consciousness and stringent water quality regulations.


| Market Size in | USD 26.32 MN |
| Market Forecast in | |
| CAGR | |
| Forecast Period | |
| Units Considered | Value (USD MN) |
India Microplastic Detection Market Trends and Insights
- This expansion in India reflects increasing regulatory scrutiny on water quality, rising awareness of microplastic contamination in aquatic ecosystems, and growing investments in environmental monitoring infrastructure across the country.
- India's market growth is driven by government initiatives addressing plastic pollution, industrial demand for detection technologies, and heightened consumer consciousness regarding microplastic presence in drinking water and food products. The forecast period through 2029 indicates India will continue to strengthen its position in microplastic detection capabilities, supported by technological advancements and expanded laboratory testing facilities.
- India's market dynamics are shaped by both domestic environmental concerns and alignment with international standards for microplastic measurement and reporting.
- As India advances its environmental compliance frameworks, demand for sophisticated detection instruments and analytical services is expected to accelerate across municipal water treatment, food and beverage, and pharmaceutical sectors..
Key Market Statistics
- CAGR (2024-2029) 6.7% CAGR
- Market Size, 2024 ~USD 548.1 Million
- Forecast, 2029 ~USD 757 Million
- Country India
India Microplastic Detection Market Overview
Market Valuation :
India's microplastic detection market is valued at USD 548.1 million in 2024, with projections reaching USD 757.0 million by 2029, demonstrating robust growth in environmental monitoring infrastructure.
Regulatory Drivers :
Increasing regulatory scrutiny from Indian environmental agencies on water quality standards and pollution control is accelerating demand for advanced microplastic detection technologies across municipal and industrial sectors.
Awareness & Investment :
Growing awareness of microplastic contamination in India's aquatic ecosystems, coupled with government investments in water treatment facilities and environmental research, is fueling market expansion.
Growth Trajectory :
With a CAGR of 6.7% through 2029, India's market is outpacing the global average of 6.4%, indicating accelerated adoption of detection solutions in the region.
India Microplastic Detection Market Dynamics
- The government's focus on clean water initiatives and pollution monitoring is creating significant opportunities for detection technology providers.
- Industrial sectors including textiles, pharmaceuticals, and food processing are increasingly investing in microplastic detection systems to comply with emerging standards and protect water resources. The market expansion is further supported by growing collaboration between research institutions and private enterprises to develop cost-effective detection solutions tailored to Indian conditions.
- Rising consumer awareness about microplastic contamination in drinking water and aquatic life is compelling both public and private organizations to adopt advanced monitoring technologies, positioning India as a key growth market in the Asia-Pacific region..
Market Ecosystem
Related Ecosystem
Equipment Machine And Tooling
- Wastewater Treatment
- Air Cooled Heat Exchangers
- Diaphragm Pumps
- Fiberglass
- HVAC System
- Alfa Laval Corporate AB
- Johnson Controls International plc
- Veolia
- Daikin Industries,Ltd.
- Carrier Global Corporation
Key Takeaways
- India's microplastic detection market is valued at USD 548.1 million in 2024 and is forecast to reach USD 757.0 million by 2029, growing at a CAGR of 6.7%.
- India's market expansion is driven by regulatory pressure, water quality concerns, and government initiatives targeting plastic pollution reduction.
- India's detection technology adoption is accelerating across water treatment, food and beverage, and pharmaceutical industries.
- India's alignment with international microplastic measurement standards is creating demand for advanced analytical instruments and laboratory services.
Microplastic Detection Market Report Scope
| Report Metric | Details |
|---|---|
| Base Year | 2024 |
| Fastest Growing Segment | POLYETHYLENE (Type) |
| Forecast Period | 2024-2029 |
| Growth Rate | CAGR of 6.4% from 2024 to 2029 |
| Largest Segment | WATER (Medium) |
| Market Size Base Year (Billions) | ~USD 4.76 (2024) |
| Revenue Forecast (Billions) | ~USD 6.49 (2029) |
| Segments Covered | Type, Medium, Size, Technology, End-Use Industry, End-Use Industry 2020-2023 |
India Microplastic Detection Market Report Segmentation
6 segment dimensions are covered across the global market.
By Type
- Other Types
- Polyethylene
- Polypropylene
- Polystyrene
- Polytetrafluoroethylene
- Ptfe
By Medium
- Air
- Soil
- Water
By Size
- 1-3 Mm
- 1-3 Mm
- 3-5 Mm
- 3-5 Mm
- <1 Mm
By Technology
- Flow Cytometry
- Ftir Spectroscopy
- Liquid Chromatography (Lc) With Mass Spectrometry (Ms)
- Micro-Raman Spectroscopy
- Other Technologies
- Pyrolysis-Gas Chromatography-Mass Spectrometry (Py-Gc-Ms)
- Scanning Electron Microscopy (Sem)
By End-Use Industry
- Cosmetics And Personal Care
- Food & Beverage
- Other End-Use Industries
- Packaging
- Textiles
- Water Treatment
By End-Use Industry 2020-2023
- Cosmetics And Personal Care
- Food & Beverage
- Other End-Use Industries
- Packaging
- Textiles
- Water Treatment
INDIA: MICROPLASTIC DETECTION MARKET, BY END-USE INDUSTRY, 2024–2029
| Segment | 2024 | 2025 | 2026 | 2027 | 2028 | 2029 | CAGR (%) |
|---|---|---|---|---|---|---|---|
| COSMETICS AND PERSONAL CARE | 81.2 | 86.3 | 91.8 | 97.8 | 104.3 | 111.3 | 6.5 |
| FOOD & BEVERAGE | 134.5 | 143.4 | 153 | 163.4 | 174.7 | 187 | 6.8 |
| OTHER END-USE INDUSTRIES | 23.8 | 24.9 | 26.1 | 27.4 | 28.8 | 30.3 | 5 |
| PACKAGING | 58.5 | 62 | 65.9 | 70.1 | 74.6 | 79.5 | 6.3 |
| TEXTILES | 88.8 | 94.5 | 100.8 | 107.5 | 114.8 | 122.6 | 6.7 |
| WATER TREATMENT | 161.4 | 172.4 | 184.3 | 197.2 | 211.2 | 226.4 | 7 |
| TOTAL | 548.1 | 583.6 | 621.9 | 663.4 | 708.4 | 757 | 6.7 |
Target Audience
- Environmental Regulators & Government Agencies : Need market intelligence to develop water quality standards, allocate resources for pollution monitoring programs, and evaluate detection technology adoption across Indian municipalities and industrial zones.
- Detection Technology Manufacturers : Require India-specific market data to assess demand potential, identify growth segments, plan product localization, and develop competitive strategies for the rapidly expanding detection equipment market.
- Water Treatment & Environmental Service Providers : Need market insights to expand service offerings, justify investments in microplastic detection capabilities, and position themselves as solution providers to industrial and municipal clients in India.
- Industrial & Manufacturing Companies : Require market analysis to understand regulatory compliance requirements, benchmark detection technology investments, and make informed decisions about implementing microplastic monitoring systems.
- Research Institutions & Consultants : Need comprehensive India market data to support environmental studies, inform policy recommendations, guide client advisory services, and contribute to academic research on microplastic contamination.
Reasons to Buy this Report
- Market Size & Growth Data : Access precise valuation figures for India's microplastic detection market with verified 2024 baseline (USD 548.1M) and 2029 forecasts, enabling accurate business planning and investment decisions.
- Regulatory Landscape Insights : Understand India-specific environmental regulations and water quality standards driving market demand, helping you align product development and compliance strategies with local requirements.
- Competitive Positioning : Identify growth opportunities and market gaps specific to India's detection technology sector, allowing you to benchmark against regional competitors and optimize market entry strategies.
- Sector-Specific Trends : Gain insights into which Indian industries (textiles, pharmaceuticals, food processing) are investing most heavily in microplastic detection, enabling targeted sales and partnership approaches.
- Investment & Expansion Planning : Leverage India-focused market data to support funding proposals, expansion decisions, and resource allocation for detection technology companies and environmental service providers.
Frequently asked questions
What is the current market size of microplastic detection in India?
India's microplastic detection market was valued at USD 548.1 million in 2024.
What is the projected market size for microplastic detection in India by 2029?
India's microplastic detection market is projected to reach USD 757.0 million by 2029.
What is the growth rate of India's microplastic detection market?
India's microplastic detection market is expected to grow at a CAGR of 6.7% from 2024 to 2029.
Which industries in India are driving microplastic detection demand?
India's primary demand drivers include municipal water treatment facilities, food and beverage manufacturers, pharmaceutical companies, and environmental monitoring agencies.
What regulatory factors are influencing India's microplastic detection market?
India's market is influenced by government plastic pollution initiatives, water quality standards, international measurement protocols, and increasing environmental compliance requirements.
RESEARCH METHODOLOGY
The study involved four major activities in estimating the market size of the Microplastic Detections market. Exhaustive secondary research was done to collect information on the market, the peer market, and the parent market. The next step was to validate these findings, assumptions, and sizing with industry experts across the value chain through primary research. Both top-down and bottom-up approaches were employed to estimate the complete market size. Thereafter, the market breakdown and data triangulation procedures were used to estimate the market size of the segments and subsegments.
Secondary Research
In the secondary research process, various secondary sources have been referred to for identifying and collecting information for this study. These secondary sources include annual reports, press releases, investor presentations of companies, white papers, certified publications, trade directories, certified publications, articles from recognized authors, gold standard and silver standard websites, and databases.
Secondary research has been used to obtain key information about the value chain of the industry, monetary chain of the market, the total pool of key Microplastic Detections, market classification and segmentation according to industry trends to the bottom-most level, and regional markets. It was also used to obtain information about the key developments from a market-oriented perspective.
Primary Research
The Microplastic Detections market comprises several stakeholders in the value chain, which include raw material suppliers, manufacturers, and end users. Various primary sources from the supply and demand sides of the Microplastic Detections market have been interviewed to obtain qualitative and quantitative information. The primary interviewees from the demand side include key opinion leaders in end-use sectors. The primary sources from the supply side include manufacturers, associations, and institutions involved in the Microplastic Detections industry.
Primary interviews were conducted to gather insights such as market statistics, data of revenue collected from the products and services, market breakdowns, market size estimations, market forecasting, and data triangulation. Primary research also helped in understanding the various trends related to chemistry, application, and region. Stakeholders from the demand side, such as CIOs, CTOs, and CSOs were interviewed to understand the buyer’s perspective on the suppliers, products, component providers, and their current usage of Microplastic Detections and future outlook of their business which will affect the overall market.
The breakdown of profiles of the primary interviewees is illustrated in the figure below:
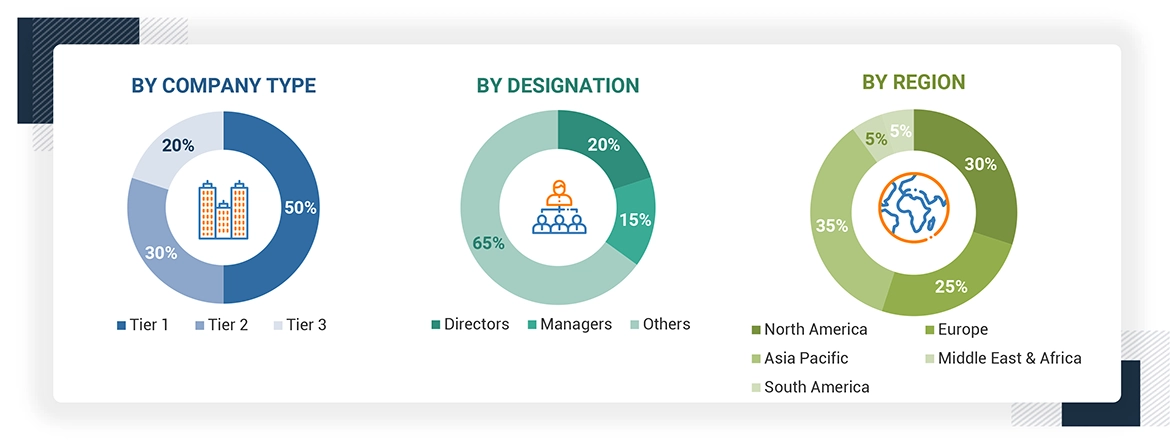
Note: Tier 1, Tier 2, and Tier 3 companies are classified based on their market revenue in 2023 available in the public domain, product portfolios, and geographical presence.
Other designations include sales representatives, production heads, and technicians.
To know about the assumptions considered for the study, download the pdf brochure
Market Size Estimation
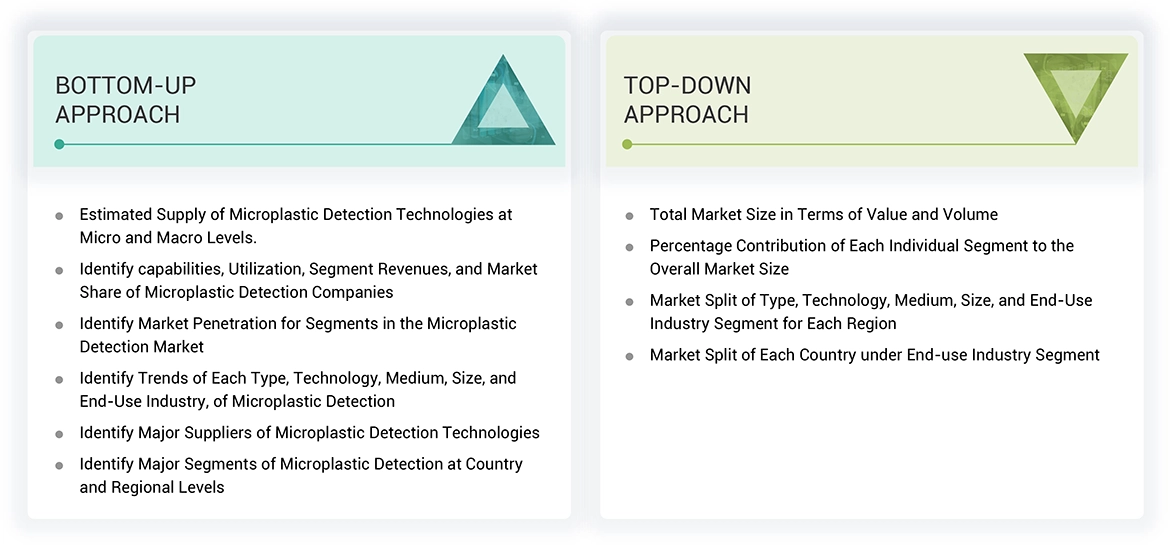
The top-down approach was used to estimate and validate the size of various submarkets for Microplastic Detections for each region. The research methodology used to estimate the market size included the following steps:
- The key players in the industry have been identified through extensive secondary research.
- The supply chain of the industry has been determined through primary and secondary research.
- The global market was then segmented into five major regions and validated by industry experts.
- All percentage shares, splits, and breakdowns based on type, technology, medium, size, end-use industry, and regions were determined using secondary sources and verified through primary sources.
- All possible parameters that affect the markets covered in this research study were accounted for, viewed in extensive detail, verified through primary research, and analyzed to get the final quantitative and qualitative data. This data was consolidated and added with detailed inputs and analysis and presented in this report.
Top-down Approach
Data Triangulation
After arriving at the total market size from the estimation process Microplastic Detections above, the overall market has been split into several segments and sub-segments. To complete the overall market engineering process and arrive at the exact statistics for all the segments and sub-segments, the data triangulation and market breakdown procedures have been employed, wherever applicable. The data has been triangulated by studying various factors and trends from both the demand and supply sides. Along with this, the market size has been validated by using both the top-down and bottom-up approaches and primary interviews. Hence, for every data segment, there have been three sources—top-down approach, bottom-up approach, and expert interviews. The data was assumed correct when the values arrived from the three sources matched.
Market Definition
Microplastic detection is a relatively new, rapidly developing field focused on the development and application of technologies and methodologies for identifying and quantifying microplastic particles in ecosystems, industries, and consumer products. Detection of microplastics is extremely challenging due to the complexity of the task and the necessitates the use of advanced analytical techniques: spectroscopy, chromatography, microscopy, and emerging technologies such as sensor-based automated systems and machine learning algorithms. These tools are capable of identifying and quantifying the presence of microplastics in a wide variety of matrices, running from marine and fresh environments, soil, air, and human tissues. This is accompanied by a demand from environmental agency, research institutions, water treatment facilities, and manufacturing industries that can help manage microplastic pollution and comply with regulatory standards.
Stakeholders
- Microplastic Detections Manufacturers
- Microplastic Detections Traders, Distributors, and Suppliers
- Raw Type Suppliers
- Government and Private Research Organizations
- Associations and Industrial Bodies
- R&D Institutions
- Environmental Support Agencies
Report Objectives
- To define, describe, and forecast the size of the Microplastic Detections market, in terms of value and volume.
- To provide detailed information regarding the major factors (drivers, opportunities, restraints, and challenges) influencing the growth of the market.
- To estimate and forecast the market size based on type, technology, medium, size, end-use industry, and region.
- To forecast the size of the market with respect to major regions, namely, Europe, North America, Asia Pacific, Middle East & Africa, and South America, along with their key countries.
- To strategically analyze micromarkets1 with respect to individual growth trends, prospects, and their contribution to the overall market.
- To analyze opportunities in the market for stakeholders and provide a competitive landscape of market leaders.
- To track and analyze recent development such as announcement in the market.
- To strategically profile key market players and comprehensively analyze their core competencies.
Get the Full Microplastic Detection Market Report
Full forecast, segment splits, and company analysis for all Microplastic Detection Market.
- Canada Microplastic Detection Market
- Mexico Microplastic Detection Market
- US Microplastic Detection Market
- Germany Microplastic Detection Market
- Italy Microplastic Detection Market
- France Microplastic Detection Market
- UK Microplastic Detection Market
- Spain Microplastic Detection Market
- Russia Microplastic Detection Market
- South Africa Microplastic Detection Market
- Argentina Microplastic Detection Market
- Brazil Microplastic Detection Market
- Rest Of Europe Microplastic Detection Market
- Rest Of Asia Pacific Microplastic Detection Market
- GCC Countries Microplastic Detection Market
- -Rest Of GCC Microplastic Detection Market
- Rest Of South America Microplastic Detection Market
- China Microplastic Detection Market
- Japan Microplastic Detection Market
- South Korea Microplastic Detection Market
Need a Tailored Report?
Customize this report to your needs
Get 10% FREE Customization
Customize This Report
