
Brazil Observability Tools & Platforms Market (2026-2031)

The Brazil Observability Tools & Platforms Market was valued at $265.5 Million in 2026 and projected to reach to $499.8 Million by 2031, representing a compound annual growth rate of 13.5%. Brazil's observability tools and platforms market is poised for sustained expansion as enterprises prioritize operational visibility and performance monitoring across increasingly complex IT environments.


| Market Size in | USD 26.32 MN |
| Market Forecast in | |
| CAGR | |
| Forecast Period | |
| Units Considered | Value (USD MN) |
Brazil Observability Tools & Platforms Market Trends and Insights
- This 13.5% compound annual growth rate reflects Brazil's increasing digital transformation initiatives and the rising complexity of cloud-native infrastructure across enterprises.
- Brazil is emerging as a key market within Latin America, driven by heightened demand for real-time monitoring, application performance management, and infrastructure visibility among financial services, e-commerce, and technology sectors. The observability market in Brazil is being propelled by accelerating cloud adoption, DevOps maturation, and regulatory compliance requirements in highly regulated industries.
- Brazil's tech-savvy workforce and growing startup ecosystem are fueling innovation in observability solutions tailored to local market needs.
- Between 2026 and 2031, Brazil is expected to see increased investment in AI-driven monitoring, distributed tracing, and unified observability platforms as organizations prioritize operational resilience and customer experience optimization..
Key Market Statistics
- CAGR (2026-2031) 13.5% CAGR
- Market Size, 2026 ~USD 265.5 Million
- Forecast, 2031 ~USD 499.8 Million
- Country Brazil
Brazil Observability Tools & Platforms Market Overview
Market Valuation Growth :
Brazil's observability tools market is valued at USD 265.5 million in 2026 and is projected to reach USD 499.8 million by 2031, representing an 88% increase over the five-year forecast period.
Strong CAGR Performance :
With a 13.5% CAGR through 2031, Brazil's market growth slightly outpaces regional trends, driven by accelerating digital transformation and enterprise cloud adoption across the country.
Digital Transformation Catalyst :
Brazilian enterprises are increasingly investing in observability solutions to manage complex cloud-native architectures, microservices deployments, and hybrid infrastructure environments.
Regional Market Leadership :
Brazil represents a significant portion of Latin America's observability market, positioning the country as a key growth engine for technology vendors and service providers in the region.
Brazil Observability Tools & Platforms Market Dynamics
- The country's growing adoption of cloud-native technologies, containerization, and DevOps practices is driving demand for advanced monitoring and analytics solutions.
- Financial services, e-commerce, and telecommunications sectors are leading adoption, with mid-market and enterprise organizations investing heavily in observability infrastructure to ensure application reliability and user experience optimization.
- Government digitalization initiatives and regulatory compliance requirements further accelerate market growth, creating opportunities for both established vendors and emerging solution providers..
Market Ecosystem
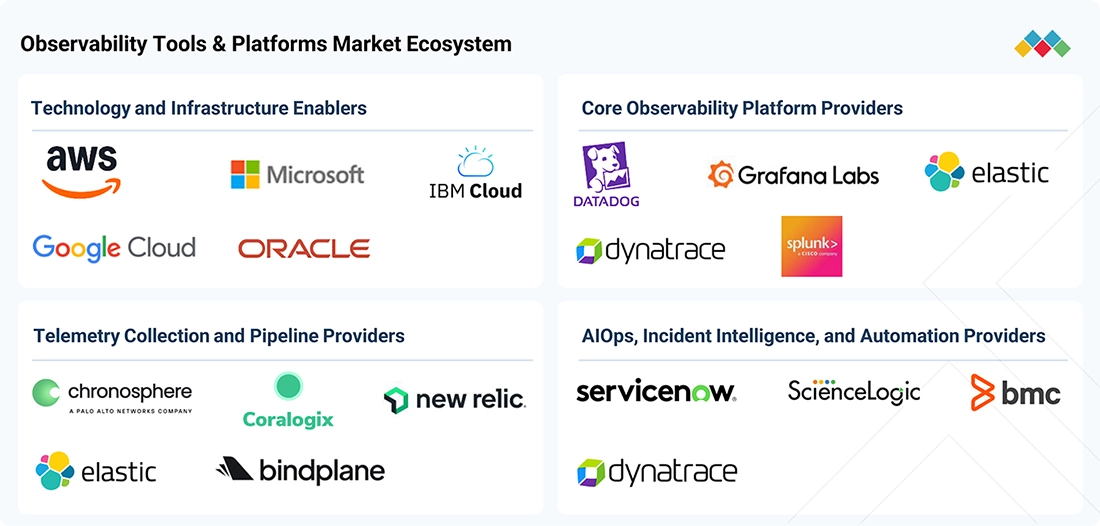
OBSERVABILITY TOOLS AND PLATFORMS MARKET: COMMERCIAL USE CASES ACROSS INDUSTRIES
| COMPANY | USE CASE DESCRIPTION | BENEFITS |
|---|---|---|
 |
Dynatrace Enabled National Grid To Modernize Observability Across Its Hybrid Multicloud Environment | Reduced observability TCO by 18% | Improved MTTR by more than 50% | Completed SaaS migration within six months | Enabled secure, real-time collaboration with vendors and partners |
 |
Elastic Enabled Comcast To Unify Observability Across Its Complex Technology Infrastructure | Processes around 400 TB of telemetry daily | Supports more than 50,000 software builds each day | Enables earlier issue detection and faster engineering feedback | Reduces observability ownership costs |
 |
Datadog Enabled Forbes To Improve Cloud Performance And Digital Experience Reliability | Reduced cloud spending by 2–3% through workload right-sizing | Maintained more than 99.5% uptime | Improved root-cause analysis time by 10% | Strengthened visibility and collaboration across engineering teams |
Logos and trademarks shown above are the property of their respective owners. Their use here is for informational and illustrative purposes only.
Related Ecosystem
Software And Services
- Natural Language Processing (NLP)
- Machine Learning
- Supply Chain Management
- Predictive Analytics
- Image Sensors
- International Business Machines Corporation
- MICROSOFT CORPORATION
- Oracle Corporation
- SAP SE
- Amazon.com, Inc.
Key Takeaways
- Brazil's observability market will nearly double from USD 265.5M (2026) to USD 499.8M (2031), representing a 13.5% CAGR.
- Cloud-native adoption and DevOps transformation are primary growth catalysts driving observability tool demand across Brazil's enterprise sector.
- Brazil's financial services and e-commerce industries are leading adopters of advanced observability platforms for compliance and customer experience.
- AI-powered monitoring and unified observability solutions are expected to dominate Brazil's market landscape through 2031.
Observability Tools & Platforms Market Report Scope
| Report Metric | Details |
|---|---|
| Base Year | 2026 |
| Fastest Growing Segment | AIOPS & INCIDENT INTELLIGENCE (Solution) |
| Forecast Period | 2026-2031 |
| Growth Rate | CAGR of 14.1% from 2026 to 2031 |
| Largest Segment | SOLUTIONS (Offering) |
| Market Size Base Year (Billions) | ~USD 11.89 (2026) |
| Revenue Forecast (Billions) | ~USD 22.99 (2031) |
| Segments Covered | Offering, Solution, Service, Telemetry Type, Deployment Mode, Organization Size, Vertical |
Brazil Observability Tools & Platforms Market Report Segmentation
7 segment dimensions are covered across the global market.
By Offering
- Services
- Solutions
By Solution
- Aiops & Incident Intelligence
- Application Performance Monitoring (Apm)
- Distributed Tracing
- Infrastructure Observability
- Log Management & Analytics
- Other Solutions
By Service
- Managed Services
- Professional Services
By Telemetry Type
- Logs
- Metrics
- Other Telemetry Types
By Deployment Mode
- Hybrid
- SaaS/Cloud-Hosted
- Self-Managed (On-Premises)
By Organization Size
- Large Enterprises
- Smes
By Vertical
- Bfsi
- Energy & Utilities
- Government & Public Sector
- Healthcare & Life Sciences
- It & Ites
- Manufacturing
- Media & Entertainment
- Other Vertical
- Other Verticals
- Retail & Ecommerce
- Telecommunications
- Transportation & Logistics
Target Audience
- Technology Vendors & Solution Providers : Observability platform vendors need Brazil-specific market data to develop localized strategies, identify partnership opportunities, and optimize product positioning for regional enterprises.
- Enterprise IT Decision Makers : CIOs and IT directors in Brazil require market insights to benchmark observability investments, evaluate vendor options, and align technology strategies with industry best practices.
- Management Consulting Firms : Consultants advising Brazilian enterprises on digital transformation need market intelligence to recommend appropriate observability solutions and validate technology investment decisions.
- Investment & Private Equity Firms : Investors evaluating opportunities in Brazil's tech sector need comprehensive market data to assess growth potential, competitive dynamics, and exit opportunities in observability.
- System Integrators & Resellers : Brazilian SIs and resellers require detailed market forecasts and customer insights to develop service offerings, identify growth segments, and build effective go-to-market strategies.
Reasons to Buy this Report
- Localized Market Intelligence : Gain deep insights into Brazil-specific market dynamics, including regional vendor landscape, customer preferences, and adoption patterns unique to South America's largest economy.
- Growth Opportunity Identification : Identify high-potential segments and verticals within Brazil's market, including financial services, e-commerce, and telecommunications sectors driving observability adoption.
- Competitive Positioning Strategy : Understand competitive dynamics, market share distribution, and strategic positioning of key players in Brazil to inform go-to-market and partnership strategies.
- Investment & Expansion Planning : Make informed decisions on market entry, resource allocation, and expansion strategies with comprehensive Brazil-specific forecasts and trend analysis through 2031.
- Customer Segmentation Insights : Access detailed analysis of enterprise, mid-market, and SMB segments in Brazil to tailor product offerings, pricing models, and sales approaches for maximum market penetration.
Frequently asked questions
What is the current size of Brazil's observability tools market?
Brazil's observability tools and platforms market is valued at USD 265.5 million in 2026 and is projected to reach USD 499.8 million by 2031.
What is the expected growth rate for observability solutions in Brazil?
Brazil's observability market is expected to grow at a compound annual growth rate (CAGR) of 13.5% from 2026 to 2031.
Which industries in Brazil are driving observability adoption?
Financial services, e-commerce, and technology sectors in Brazil are the primary drivers of observability tool adoption due to regulatory requirements and operational complexity.
What technologies are shaping Brazil's observability market?
AI-driven monitoring, distributed tracing, unified observability platforms, and cloud-native infrastructure solutions are key technologies transforming Brazil's observability landscape.
How does Brazil's observability market compare to the global market?
Brazil's 13.5% CAGR is slightly below the global average of 14.1%, reflecting regional market maturity and localized adoption patterns within Latin America.
RESEARCH METHODOLOGY
This research study on the observability tools & platforms market involved extensive secondary and primary research. Secondary sources included company annual reports, SEC filings, investor presentations, product documentation, press releases, white papers, technology journals, government publications, cloud adoption databases, CNCF resources, OpenTelemetry documentation, and paid databases. Primary sources included industry experts from observability software vendors, cloud service providers, managed service providers, system integrators, consulting organizations, enterprise users, and related technology companies. In-depth interviews with market participants and subject-matter experts were conducted to gather and validate critical qualitative and quantitative information and assess the market’s growth prospects.
Secondary Research
During the secondary research process, multiple sources were reviewed to identify and collect information relevant to the study. These sources included annual reports, regulatory filings, investor presentations, earnings transcripts, press releases, product portfolios, acquisition announcements, pricing pages, and technology documentation from observability vendors. Additional information was gathered from recognized journals, industry associations, cloud provider publications, CNCF resources, OpenTelemetry materials, government websites, technical blogs, and certified publications. Data relating to cloud spending, application modernization, Kubernetes adoption, DevOps maturity, telemetry generation, artificial intelligence adoption, and observability software expenditure across major countries was also extracted from relevant secondary sources.
Primary Research
During the primary research process, respondents from the supply and demand sides were interviewed to obtain qualitative and quantitative information about the market. Supply-side participants included chief executive officers, vice presidents, directors, product managers, engineering leaders, business development executives, marketing executives, and observability specialists. Interviews also covered executives from observability platform vendors, hyperscalers, managed service providers, system integrators, professional service providers, telemetry pipeline providers, cloud consulting firms, industry associations, and other key opinion leaders. Demand-side participants included CIOs, CTOs, application owners, DevOps leaders, Site Reliability Engineering teams, platform engineering teams, cloud operations teams, security operations teams, and enterprise IT decision-makers.
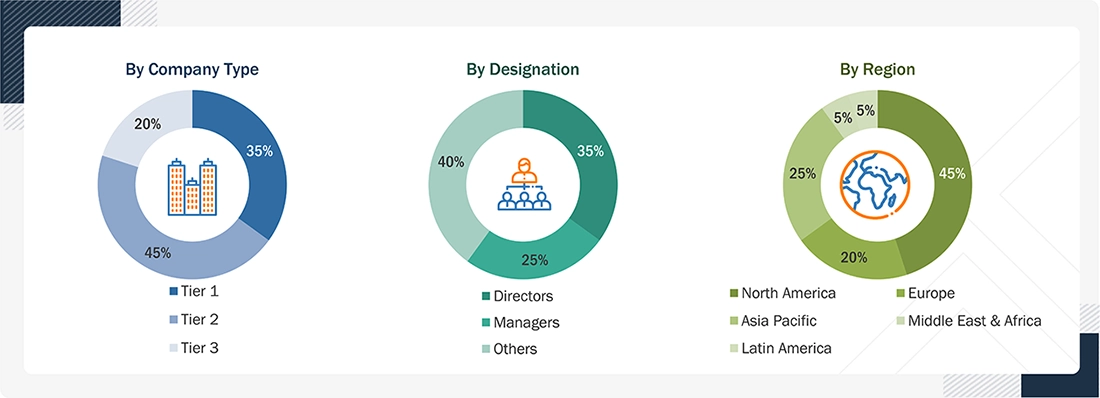
Note: Tier 1 companies’ revenues are more than USD 1 billion; tier 2 companies’ revenues range between USD 500 million and 100 million; and tier 3 companies’ revenues range between USD 10 million and USD 100 million. Other designations include sales, marketing, engineering, product, operations, and research managers.
To know about the assumptions considered for the study, download the pdf brochure
Market Size Estimation
Multiple approaches were used to estimate and forecast the observability tools & platforms market. The first approach involved estimating the market size based on revenues generated by companies from observability software products, related platform capabilities, and associated services. Vendor revenues were allocated across relevant market segments based on product functionality, deployment models, customer profiles, vertical exposure, telemetry coverage, and regional presence. The estimates were then validated using adoption indicators, enterprise technology spending, cloud infrastructure growth, telemetry volumes, customer deployments, product pricing, and primary interviews.
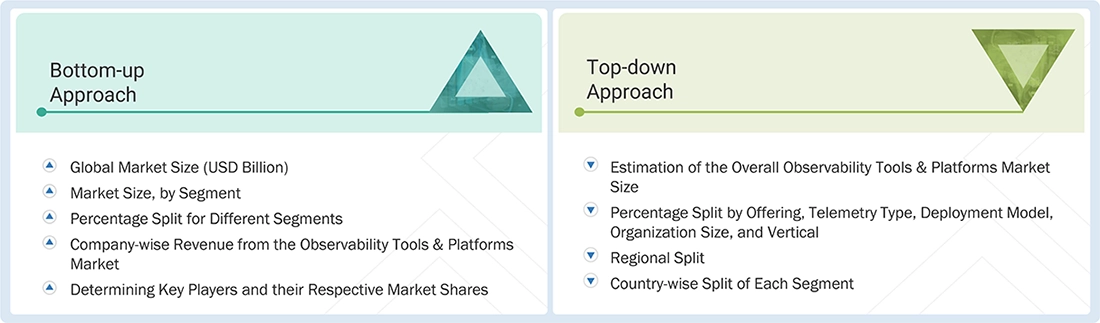
Market Size Estimation Methodology: Top-down Approach
The top-down approach involved preparing an exhaustive list of vendors offering observability platforms, monitoring tools, telemetry management capabilities, and related services. Vendor revenue contributions were estimated using annual reports, regulatory filings, investor presentations, press releases, funding information, acquisition disclosures, paid databases, product pricing, customer references, and primary interviews. Each vendor’s offerings were evaluated across offering, solution, telemetry type, deployment model, organization size, vertical, and region. The market estimates were triangulated through secondary and primary research. Primary validation included interviews with CIOs, CTOs, vice presidents, directors, engineering leaders, product executives, and marketing professionals. The resulting market estimates were further cross-validated against the existing MarketsandMarkets repository and related ICT market databases.
Market Size Estimation Methodology: Bottom-up Approach
The bottom-up approach assessed the adoption of observability platforms across major verticals and countries contributing significantly to the market. Enterprise deployments were evaluated across application performance monitoring, infrastructure observability, log management, distributed tracing, digital experience monitoring, AIOps, incident intelligence, and AI observability use cases. Adoption levels across large enterprises and SMEs were estimated and extrapolated using cloud maturity, application complexity, telemetry volumes, monitored hosts, containers, services, users, and digital workloads.
Regional splits were determined through primary and secondary sources. The process included analysis of regional observability penetration, cloud infrastructure spending, enterprise software expenditure, DevOps adoption, Kubernetes deployment, OpenTelemetry usage, cybersecurity investment, and application modernization activity. Strategic analysis of major global and regional observability vendors, together with their organic and inorganic developments, was also incorporated into the market estimates.
Data Triangulation
After determining the overall market size using the top-down and bottom-up estimation processes, the market was divided into segments and subsegments. Data triangulation and market breakup procedures were applied to validate each market segment and subsegment. Vendor revenues, customer adoption patterns, deployment models, telemetry coverage, regional indicators, pricing structures, and primary interview findings were compared to identify inconsistencies. The final market size was then used to estimate individual segments by applying validated percentage splits across the market segmentation. The resulting figures were cross-checked against supply-side revenues, demand-side adoption indicators, technology spending, and regional economic conditions.
Market Definition
The observability tools & platforms market comprises software solutions and associated services that enable organizations to collect, process, correlate, visualize, and analyze telemetry generated across applications, infrastructure, networks, databases, cloud platforms, containers, Kubernetes environments, digital experiences, and artificial intelligence workloads. These platforms ingest and analyze metrics, logs, traces, events, and profiles to provide visibility into system performance, service dependencies, application behavior, infrastructure health, user experience, and operational incidents.
Observability platforms include capabilities such as application performance monitoring, infrastructure observability, log management and analytics, distributed tracing, digital experience monitoring, AIOps, incident intelligence, service-level monitoring, telemetry pipelines, anomaly detection, root-cause analysis, workflow automation, and AI/LLM observability. The market includes SaaS/cloud-hosted, self-managed, and hybrid deployment models and supports enterprises operating cloud-native, multi-cloud, hybrid-cloud, on-premises, and edge environments.
Key Stakeholders
- Observability platform providers
- Application performance monitoring providers
- Infrastructure monitoring and observability vendors
- Log management and analytics providers
- Distributed tracing solution providers
- Digital experience monitoring providers
- AIOps and incident intelligence platform providers
- AI and LLM observability providers
- Telemetry pipeline and OpenTelemetry solution providers
- Cloud infrastructure providers and hyperscalers
- Kubernetes, container, network, and database monitoring providers
- Managed observability service providers and system integrators
- Cloud consulting and professional service providers
- DevOps, Site Reliability Engineering, and platform engineering teams
- Enterprise software and IT operations management vendors
- Large enterprises, SMEs, and digital-native businesses
Report Objectives
- To define and describe the observability tools & platforms market by offering, solution, telemetry type, deployment model, organization size, vertical, and region
- To provide detailed information on major factors influencing market growth, including drivers, restraints, opportunities, and challenges across the observability ecosystem
- To strategically analyze micro-markets with respect to individual growth trends, adoption patterns, and their contribution to the overall observability tools & platforms market
- To analyze market opportunities for stakeholders and present the competitive landscape of observability platform vendors, hyperscalers, enterprise software providers, and service providers
- To project the market size and its submarkets in terms of value across North America, Europe, Asia Pacific, the Middle East & Africa, and Latin America
- To analyze major countries within each region based on cloud adoption, enterprise IT spending, digital maturity, telemetry volumes, and observability deployment
- To strategically profile leading companies and evaluate their product portfolios, platform capabilities, geographic presence, growth strategies, and market positioning
- To examine competitive developments, including product launches, platform enhancements, partnerships, integrations, acquisitions, funding activities, and regional expansions
- To assess the impact of OpenTelemetry, artificial intelligence, cloud-native applications, Kubernetes, microservices, DevOps, and Site Reliability Engineering on market development
- To analyze market adoption across application performance monitoring, infrastructure observability, log management, distributed tracing, digital experience monitoring, AIOps, and AI observability
- To evaluate the market by telemetry type, including logs, metrics, and others comprising traces, events, and profiles
- To assess deployment trends across SaaS/cloud-hosted, self-managed, and hybrid environments
- To identify high-growth segments, emerging use cases, and evolving technology requirements across the observability tools & platforms market
Available customizations:
With the given market data, MarketsandMarkets offers customizations as per the company’s specific needs. The following customization options are available for the report:
Product Analysis
- The product matrix provides a detailed comparison of the product portfolios, platform capabilities, deployment models, telemetry coverage, and integrations of each company.
Geographic Analysis based on feasibility
- Further breakup of the North American observability tools & platforms market
- Further breakup of the European observability tools & platforms market
- Further breakup of the Asia Pacific observability tools & platforms market
- Further breakup of the Middle East & African observability tools & platforms market
- Further breakup of the Latin American observability tools & platforms market
Company Information
- Detailed analysis and profiling of additional market players (up to five)
Get the Full Observability Tools & Platforms Market Report
Full forecast, segment splits, and company analysis for all Observability Tools & Platforms Market.
- US Observability Tools & Platforms Market
- Canada Observability Tools & Platforms Market
- UK Observability Tools & Platforms Market
- Germany Observability Tools & Platforms Market
- France Observability Tools & Platforms Market
- Italy Observability Tools & Platforms Market
- China Observability Tools & Platforms Market
- Japan Observability Tools & Platforms Market
- India Observability Tools & Platforms Market
- Australia Observability Tools & Platforms Market
- Saudi Arabia Observability Tools & Platforms Market
- UAE Observability Tools & Platforms Market
- South Africa Observability Tools & Platforms Market
- Mexico Observability Tools & Platforms Market
- Rest Of Europe Observability Tools & Platforms Market
- Rest Of Asia Pacific Observability Tools & Platforms Market
- Rest Of Latin America Observability Tools & Platforms Market
- GCC Countries Observability Tools & Platforms Market
- Rest Of GCC Countries Observability Tools & Platforms Market
Need a Tailored Report?
Customize this report to your needs
Get 10% FREE Customization
Customize This Report
