
Asia Pacific Spatial Genomics & Transcriptomics Market (2024-2029)

The Asia Pacific Spatial Genomics & Transcriptomics Market was valued at $82.1 Million in 2024 and projected to reach to $148.9 Million by 2029, representing a compound annual growth rate of 12.6%. The Asia Pacific spatial genomics and transcriptomics market is poised for significant growth through 2029, with the region's expanding biotechnology ecosystem and increasing healthcare investments creating substantial opportunities.


| Market Size in | USD 26.32 MN |
| Market Forecast in | |
| CAGR | |
| Forecast Period | |
| Units Considered | Value (USD MN) |
Asia Pacific Spatial Genomics & Transcriptomics Market Trends and Insights
- Asia Pacific is emerging as a critical hub for advanced genomic research and precision medicine adoption, driven by increasing investments in biotechnology infrastructure and rising demand for personalized healthcare solutions.
- The region's market growth outpaces global trends, reflecting strong government support for life sciences innovation and expanding research capabilities across leading economies. Asia Pacific's spatial genomics market benefits from a growing population of research institutions, pharmaceutical companies, and diagnostic centers seeking to integrate spatial analysis into their genomic workflows.
- The 12.6% compound annual growth rate demonstrates Asia Pacific's accelerating adoption of these transformative technologies between 2024 and 2029.
- Key drivers include rising cancer prevalence, increased funding for genomic research initiatives, and growing collaboration between academic and commercial entities across Asia Pacific, positioning the region as a strategic growth market for spatial genomics and transcriptomics solutions..
Key Market Statistics
- CAGR (2024-2029) 12.6% CAGR
- Market Size, 2024 ~USD 82.1 Million
- Forecast, 2029 ~USD 148.9 Million
- Geography Asia Pacific
Asia Pacific Spatial Genomics & Transcriptomics Market Overview
Rapid Market Expansion :
Asia Pacific's spatial genomics and transcriptomics market is growing at 12.6% CAGR, outpacing global growth of 12.4%, reflecting the region's accelerating adoption of advanced genomic technologies and precision medicine initiatives.
China's Market Leadership :
China dominates the Asia Pacific market with $62.54 million in 2024, driven by substantial government investments in biotechnology infrastructure, genomic research centers, and the nation's commitment to becoming a global genomics powerhouse.
Emerging Research Hubs :
Japan ($32.01M) and India ($25.18M) are establishing themselves as critical research and innovation centers, with increasing collaborations between academic institutions, biotech companies, and healthcare providers advancing spatial genomics applications.
Personalized Medicine Demand :
Rising healthcare expenditure and growing patient awareness across Asia Pacific are driving demand for personalized treatment solutions, positioning spatial genomics as a key technology for precision oncology and rare disease diagnosis.
Asia Pacific Spatial Genomics & Transcriptomics Market Dynamics
- Government initiatives across China, Japan, and India are accelerating research infrastructure development and talent acquisition, while rising prevalence of chronic diseases and cancer is driving adoption of precision medicine approaches.
- The market's projected growth to $148.9 million reflects growing recognition of spatial genomics' clinical value in drug discovery, biomarker identification, and personalized treatment planning. Key growth drivers include strengthening academic-industry partnerships, increasing venture capital funding for genomics startups, and expanding clinical applications in oncology and immunology.
- Asia Pacific's large patient populations and cost-effective research capabilities are attracting global biotech companies to establish regional centers.
- However, regulatory harmonization challenges and limited reimbursement policies remain barriers.
- Countries like South Korea and Australia are emerging as secondary growth markets, while the broader region benefits from technology transfer and knowledge sharing among leading genomics institutions..
Market Ecosystem
Related Ecosystem
Key Takeaways
- Asia Pacific's spatial genomics market is valued at $82.1 million in 2024 and will nearly double to $148.9 million by 2029, representing a 12.6% CAGR.
- Asia Pacific is outpacing global growth rates, driven by increased biotechnology investments and government support for precision medicine initiatives across the region.
- Rising cancer incidence and demand for personalized diagnostics are accelerating adoption of spatial transcriptomics technologies throughout Asia Pacific.
- Asia Pacific's expanding research infrastructure and academic-commercial collaborations position the region as a key growth market for spatial genomics solutions through 2029.
Spatial Genomics & Transcriptomics Market Report Scope
| Report Metric | Details |
|---|---|
| Base Year | 2024 |
| Fastest Growing Segment | SERVICES (Offering) |
| Forecast Period | 2024-2029 |
| Growth Rate | CAGR of 12.4% from 2024 to 2029 |
| Largest Segment | PRODUCTS (Offering) |
| Market Size Base Year (Billions) | ~USD 0.56 (2024) |
| Revenue Forecast (Billions) | ~USD 0.9957 (2029) |
| Segments Covered | Offering, Type, Technique, Application, End User |
Asia Pacific Spatial Genomics & Transcriptomics Market Report Segmentation
5 segment dimensions are covered across the global market.
By Offering
- Products
- Services
By Type
- Cancer
- Chromatin Accessibility Sequencing
- Consumables
- Data Visualization & Analysis Services
- Genomic Sequencing
- Immunofluorescence
- Immunohistochemistry
- Immunology
- In-Situ Hybridization
- In-Situ Rna Sequencing
- Infectious Diseases
- Instruments & Software
- Laser Capture Microdissection
- Microdissection-Based Sequencing
- Microscopy-Based Rna Imaging
- Microscopy-Based Rna Imaging Techniques
- Neuroscience
- Other Diseases
- Other Genomic Sequencing
- Other Genomic Sequencing \
- Other Rna Sequencing
- Other Spatial Genomics Techniques
- Other Spatial Transcriptomic Techniques
- Other Spatial Transcriptomics Techniques
- Rna Sequencing
- Rna Sequencing Techniques
- Sample Preparation Services
- Sequencing & Analytical Services
- Single-Cell Rna Sequencing
By Technique
- Spatial Genomics
- Spatial Transcriptomics
By Application
- Drug Discovery & Development
- Translational Research
By End User
- Academic & Research Institutes
- Clinical Diagnostic Laboratories
- Cros & Cdmos
- Other End Users
- Pharmaceutical & Biotechnology Companies
Target Audience
- Genomics & Biotech Companies : Manufacturers and developers of spatial genomics platforms need Asia Pacific market data to identify expansion opportunities, assess competitive positioning, and develop region-specific commercialization strategies in high-growth markets like China and India.
- Healthcare & Diagnostic Providers : Hospital networks, diagnostic laboratories, and precision medicine centers require market insights to evaluate spatial transcriptomics adoption potential, understand reimbursement landscapes, and plan technology investments across Asia Pacific regions.
- Pharmaceutical & CRO Organizations : Drug developers and contract research organizations need Asia Pacific market intelligence to identify genomics-enabled drug discovery opportunities, assess clinical trial capabilities, and optimize R&D resource allocation in the region.
- Investment & Private Equity Firms : Investors evaluating genomics sector opportunities in Asia Pacific require detailed market forecasts, growth drivers, and competitive analysis to identify high-potential companies and optimize portfolio allocation decisions.
- Government & Research Institutions : Public health agencies, academic centers, and research councils need market data to inform biotechnology policy, funding priorities, and infrastructure development initiatives supporting spatial genomics advancement across Asia Pacific.
Countries within Asia Pacific - compare and drill down
| Country | 2025 size (native) |
|---|---|
| China | USD 62.54 Million |
| Japan | USD 32.01 Million |
| India | USD 25.18 Million |
| South Korea | USD 10.99 Million |
| Australia | USD 6.7 Million |
| Rest Of Asia Pacific | USD 11.48 Million |
Country market size visualization
Reasons to Buy this Report
- Regional Market Sizing & Forecasts : Detailed market valuations for Asia Pacific and individual countries (China, Japan, India, South Korea, Australia) with 5-year projections enabling accurate budget allocation and investment planning specific to your target markets.
- Competitive Landscape Analysis : Comprehensive assessment of leading spatial genomics players operating in Asia Pacific, including their market positioning, technology platforms, partnerships, and expansion strategies to inform competitive strategy.
- Growth Driver Identification : In-depth analysis of region-specific factors driving adoption—government funding initiatives, healthcare infrastructure development, disease prevalence trends, and regulatory environments—critical for market entry and expansion planning.
- Country-Level Opportunity Assessment : Granular insights into individual Asia Pacific markets highlighting which countries offer highest growth potential, emerging applications, and investment opportunities for spatial genomics solutions and services.
- Strategic Partnership & M&A Intelligence : Identification of acquisition targets, collaboration opportunities, and distribution partnerships across Asia Pacific's genomics ecosystem to accelerate market penetration and technology adoption.
Frequently asked questions
What is the current market size of spatial genomics in Asia Pacific?
The Asia Pacific spatial genomics and transcriptomics market was valued at $82.1 million in 2024 and is expected to grow to $148.9 million by 2029.
What is the projected growth rate for Asia Pacific's spatial genomics market?
Asia Pacific's spatial genomics market is projected to grow at a compound annual growth rate (CAGR) of 12.6% from 2024 to 2029.
What factors are driving growth in Asia Pacific's spatial genomics market?
Key growth drivers in Asia Pacific include rising cancer prevalence, increased government funding for genomic research, expanding biotechnology infrastructure, and growing adoption of precision medicine across the region.
How does Asia Pacific's spatial genomics market compare to global growth?
Asia Pacific's 12.6% CAGR slightly exceeds the global market CAGR of 12.4%, indicating that the region is experiencing faster adoption and investment in spatial genomics technologies.
Which countries in Asia Pacific are leading the spatial genomics market?
Leading Asia Pacific markets include China, Japan, South Korea, and India, which have established strong biotechnology sectors, significant research institutions, and government support for genomic innovation.
RESEARCH METHODOLOGY
This study on the spatial genomics & transcriptomics market employed secondary sources, directories, and databases to gather pertinent information. To gather and validate important qualitative and quantitative data and evaluate market growth prospects, in-depth interviews were conducted with many primary respondents including key industry participants, subject-matter experts (SMEs), C-level executives from key market players, and industry consultants. After estimating the spatial genomics & transcriptomics market using several research strategies, the size of the final market was obtained by triangulating data from primary research.
Secondary Research
The secondary sources referred to for this research study include publications from government sources, such as World Health Organization (WHO), National Institutes of Health (NIH), Organisation for Economic Co-operation and Development (OECD), International Agency for Research on Cancer (IARC), Research!America, Genome Canada, GenomeWeb, South African Medical Research Council (SAMRC), Wellcome Sanger Institute, Genome Research Limited, Labiotech.eu, R&D World Magazine, India Brand Equity Foundation (IBEF), Biotechnology Innovation Organization (BIO), National Center for Biotechnology Information (NCBI), BioPharm International, EvaluatePharma, ScienceDirect, Eurostat. Secondary sources include corporate and regulatory filings, such as annual reports, SEC filings, investor presentations, and financial statements; business magazines & research journals; press releases; and trade, business, and professional associations. Secondary data was collected and analyzed to arrive at the overall size of the global spatial genomics & transcriptomics market, which was validated through primary research.
Primary Research
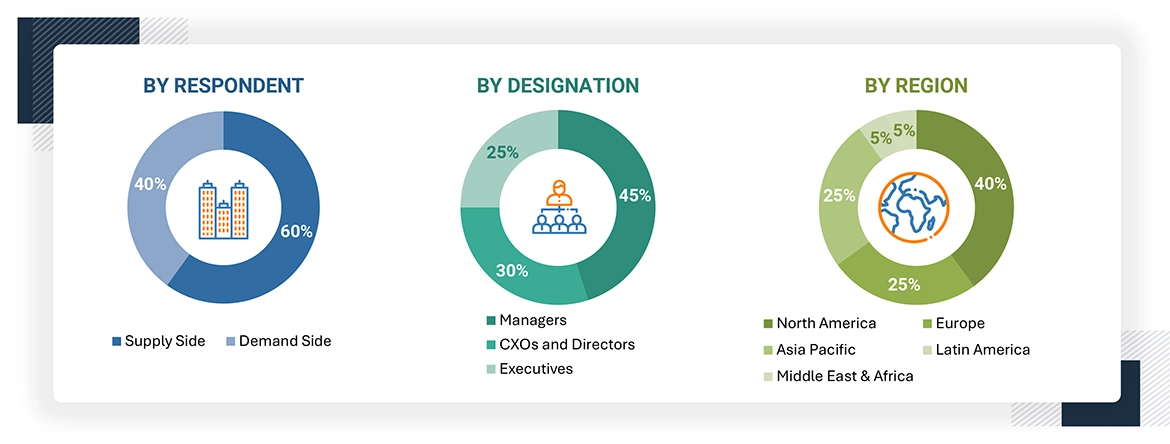
Extensive primary research was conducted after acquiring basic knowledge about the global spatial genomics & transcriptomics market scenario through secondary research. Several primary interviews were conducted with market experts from the supply side, such as C-level and D-level executives, operational managers, marketing & sales managers of key manufacturers, distributors, and channel partners of companies providing gene editing products and services; experts from the demand side, such as personnel from pharmaceutical & biotechnology companies, Academic & research institutes, clinical diagnostic laboratories, and CROs & CDMOs. These interviews were conducted across six major regions, including North America, Europe, the Asia Pacific, Latin America, the Middle East, and Africa. Approximately 70% and 30% of the primary interviews were conducted with supply-side and demand-side participants, respectively. This primary data was collected through questionnaires, e-mails, online surveys, personal interviews, and telephonic interviews.
The following is a breakdown of the primary respondents:
To know about the assumptions considered for the study, download the pdf brochure
Market Size Estimation
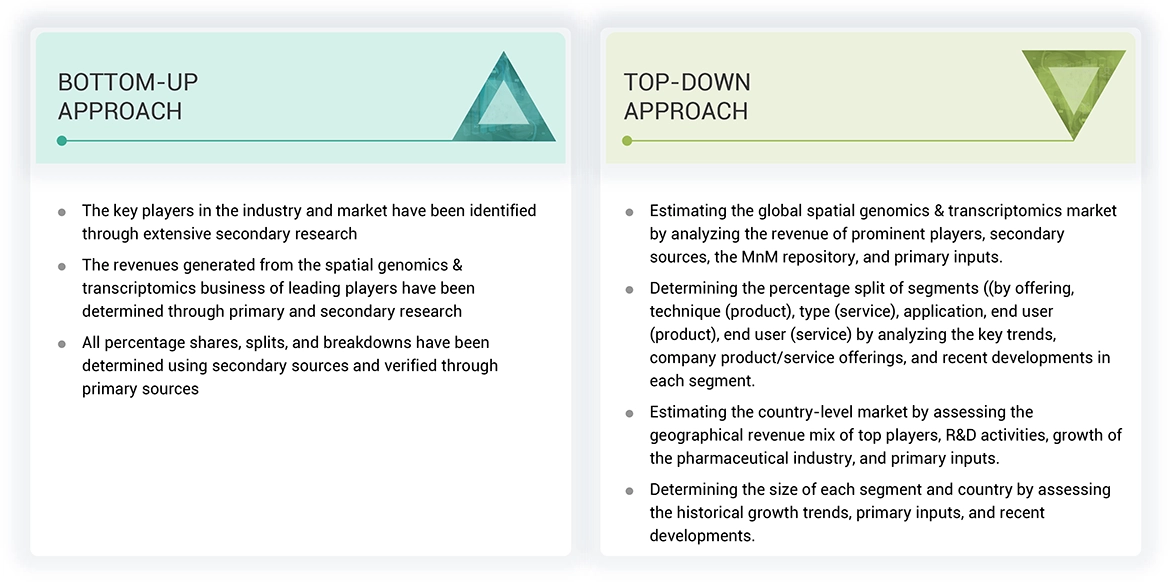
Both top-down and bottom-up approaches were used to estimate and validate the total size of the spatial genomics & transcriptomics market. These methods were also used extensively to estimate the size of various subsegments in the market. The research methodology used to estimate the market size includes the following:
Bottom-up Approach
- The key players in the industry and market have been identified through extensive secondary research.
- The revenues generated from the spatial genomics & transcriptomics market business of leading players have been determined through primary and secondary research.
- All percentage shares, splits, and breakdowns have been determined using secondary sources and verified through primary sources.
Top-down Approach
After arriving at the overall market size from the market size estimation process, the total market was split into several segments and subsegments.
Data Triangulation
To complete the overall market engineering process and arrive at the exact statistics for all segments and subsegments, data triangulation and market breakdown procedures were employed, wherever applicable. The data was triangulated by studying various factors and trends from both the demand and supply sides.
Market Definition
The spatial genomics & transcriptomics market, as covered within the scope of this report, includes products, technologies, and services that facilitate spatial genomics & transcriptomics across various applications. Spatial genomics and transcriptomics are pioneering technologies that allow scientists to measure the gene activity in a tissue sample and map the site of the activity. Spatial transcriptomics helps spatially resolve RNA-seq data and all mRNAs in individual tissue sections. The technology is presently used in translational research and can be used in clinical diagnosis in the future. Spatial genomics also helps map gene expressions across human tissues.
Stakeholders
- Manufacturers and distributors of spatial genomics and transcriptomics products
- Spatial genomics and transcriptomics service providers
- Pharmaceutical and biotechnology companies
- Contract research organizations (CROs)
- Contract Development & Manufacturing Organizations (CDMOs)
- Market research and consulting firms
- R&D centers
- Researchers and scientists
- Academic & research institutes
- Market Research and Consulting Firms
- Regulatory Agencies
- Venture Capitalists
- Government Organizations
- Industry Associations and Professional Societies
- Diagnostic companies
Report Objectives
- To define, describe, segment, and forecast the spatial genomics & transcriptomics market based on offering, technique, application, type (service), end user (product), end user (service), and region
- To provide detailed information about the factors influencing market growth, such as drivers, restraints, opportunities, and challenges
- To strategically analyze micromarkets1 with respect to individual growth trends, prospects, and contributions to the overall gene editing market
- To analyze market opportunities for stakeholders and provide details of the competitive landscape for key players
- To forecast the size of the market segments concerning six main regions: North America, Europe, the Asia Pacific, Latin America, the Middle East, and Africa.
- To strategically profile the key players in the global spatial genomics & transcriptomics market and comprehensively analyze their core competencies2 and market rankings.
- To track and analyze competitive developments, such as product & service launches, acquisitions, collaborations, expansions, and partnerships in the gene editing market.
- To profile the key players in the global spatial genomics & transcriptomics market and comprehensively analyze their product and services portfolios, market positions, and core competencies
- To track and analyze competitive developments such as product & service launches, expansions, agreements, and collaborations in the spatial genomics & transcriptomics market
- To benchmark players within the spatial genomics & transcriptomics market using the ‘Company Evaluation Matrix' framework, which analyzes market players based on various parameters within the broad categories of business and service strategy.
Get the Full Spatial Genomics & Transcriptomics Market Report
Full forecast, segment splits, and company analysis for all Spatial Genomics & Transcriptomics Market.
- US Spatial Genomics & Transcriptomics Market
- Canada Spatial Genomics & Transcriptomics Market
- Germany Spatial Genomics & Transcriptomics Market
- UK Spatial Genomics & Transcriptomics Market
- France Spatial Genomics & Transcriptomics Market
- Italy Spatial Genomics & Transcriptomics Market
- Spain Spatial Genomics & Transcriptomics Market
- China Spatial Genomics & Transcriptomics Market
- Japan Spatial Genomics & Transcriptomics Market
- India Spatial Genomics & Transcriptomics Market
- South Korea Spatial Genomics & Transcriptomics Market
- Australia Spatial Genomics & Transcriptomics Market
- Brazil Spatial Genomics & Transcriptomics Market
- Mexico Spatial Genomics & Transcriptomics Market
- Rest Of Europe Spatial Genomics & Transcriptomics Market
- Rest Of Asia Pacific Spatial Genomics & Transcriptomics Market
- Rest Of Latin America Spatial Genomics & Transcriptomics Market
Need a Tailored Report?
Customize this report to your needs
Get 10% FREE Customization
Customize This Report
