
Asia Pacific Sustainable Manufacturing Market (2024-2029)

The Asia Pacific Sustainable Manufacturing Market was valued at $106851.3 Million in 2024 and projected to reach to $177751.1 Million by 2029, representing a compound annual growth rate of 10.7%. Asia Pacific's sustainable manufacturing market is poised for significant expansion through 2029, driven by the region's concentration of semiconductor and electronics production facilities transitioning to eco-friendly processes.


| Market Size in | USD 26.32 MN |
| Market Forecast in | |
| CAGR | |
| Forecast Period | |
| Units Considered | Value (USD MN) |
Asia Pacific Sustainable Manufacturing Market Trends and Insights
- In 2024, Asia Pacific's sustainable manufacturing market was valued at $106.9 billion USD, driven by rapid industrialization, stringent environmental regulations, and increasing corporate sustainability commitments across the region.
- Asia Pacific is projected to expand significantly through 2029, with the market forecast to reach $177.8 billion USD, reflecting a compound annual growth rate of 10.7%. The region's growth trajectory outpaces many mature markets, fueled by semiconductor manufacturing hubs in China, Taiwan, South Korea, and Japan that are increasingly adopting circular economy principles and energy-efficient production technologies.
- Asia Pacific's sustainable manufacturing adoption is accelerating due to government incentives, supply chain pressures from multinational corporations, and rising consumer demand for environmentally responsible electronics.
- Between 2024 and 2029, Asia Pacific will continue to lead innovation in green manufacturing processes, positioning itself as a critical hub for sustainable electronics production..
Key Market Statistics
- CAGR (2024-2029) 10.7% CAGR
- Market Size, 2024 ~USD 106851.3 Million
- Forecast, 2029 ~USD 177751.1 Million
- Geography Asia Pacific
Asia Pacific Sustainable Manufacturing Market Overview
Market Leadership Position :
Asia Pacific commands the global sustainable manufacturing market in semiconductors and electronics, with a 2024 valuation of $106.9 billion USD, reflecting the region's dominance in electronics production and manufacturing innovation.
Robust Growth Trajectory :
The region is projected to grow from $106.9 billion in 2024 to $177.8 billion by 2029, representing a 10.7% CAGR, outpacing many global markets and driven by accelerating sustainability mandates across supply chains.
China's Manufacturing Dominance :
China leads Asia Pacific's sustainable manufacturing sector with a market size of $112.2 billion, leveraging its position as the world's electronics manufacturing hub while transitioning to cleaner production technologies.
Regulatory & Corporate Drivers :
Stringent environmental regulations, carbon neutrality commitments from major electronics manufacturers, and government sustainability initiatives across Japan, South Korea, and Southeast Asia are accelerating adoption of sustainable manufacturing practices.
Asia Pacific Sustainable Manufacturing Market Dynamics
- Major economies including China, Japan, and India are implementing stricter environmental standards while investing heavily in green technologies, circular economy initiatives, and renewable energy integration.
- The region's competitive advantage in electronics manufacturing, combined with increasing pressure from global supply chain partners and consumers, creates a compelling market for sustainable solutions.
- Expected growth will be fueled by technological innovations in energy-efficient production, waste reduction systems, and sustainable materials sourcing across the semiconductor value chain..
Market Ecosystem
Related Ecosystem
Semiconductor Materials And Components
- Sensors
- Gallium Nitride (GaN)
- Digital Signal Processor (DSP)
- Natural Language Processing (NLP)
- Silicon Carbide
- Texas Instruments Incorporated
- Samsung
- APPLIED MATERIALS, INC.
- Stmicroelectronics
- Lenovo
Automotive Electronics And Electrical Equipment
- Battery Electric Vehicle (BEV)
- Light Commercial Vehicles (LCVs)
- Fuel Cell Electric Vehicle (FCEV)
- Sensors
- Hybrid Electric Vehicle (HEV)
- BOSCH LIMITED
- DENSO Corporation
- Continental ag
- Panasonic Holdings Corporation
- Texas Instruments Incorporated
Industrial Iot
- Sensors
- Pressure Sensors
- Flow Sensors
- Gas Sensors
- Image Sensors
- Siemens ag
- ABB India Limited
- HONEYWELL INTERNATIONAL INC.
- Emerson Electric Co.
- SCHNEIDER ELECTRIC SE
Key Takeaways
- Asia Pacific's sustainable manufacturing market will grow from $106.9B (2024) to $177.8B (2029) at a 10.7% CAGR, driven by semiconductor and electronics sector transformation.
- Asia Pacific's major manufacturing hubs in China, Taiwan, South Korea, and Japan are rapidly adopting circular economy and energy-efficient technologies to meet regulatory and corporate sustainability demands.
- Government incentives, multinational supply chain requirements, and consumer demand for green electronics are accelerating Asia Pacific's sustainable manufacturing adoption through 2029.
- Asia Pacific is positioned as the global leader in sustainable electronics production, with innovation in green processes and technologies outpacing other regions.
Sustainable Manufacturing Market Report Scope
| Report Metric | Details |
|---|---|
| Base Year | 2024 |
| Fastest Growing Segment | GREEN HYDROGEN (Offering) |
| Forecast Period | 2024-2029 |
| Growth Rate | CAGR of 11.3% from 2024 to 2029 |
| Largest Segment | RECYCLED STEEL (Offering) |
| Market Size Base Year (Billions) | ~USD 214.99 (2024) |
| Revenue Forecast (Billions) | ~USD 367.2 (2029) |
| Segments Covered | Offering, Application |
Asia Pacific Sustainable Manufacturing Market Report Segmentation
2 segment dimensions are covered across the global market.
By Offering
- Bioplastics & Biopolymers
- Green Hydrogen
- Natural Fiber Composites
- Recycled Aluminum
- Recycled Carbon Fiber
- Recycled Lithium-Ion Batteries
- Recycled Plastics
- Recycled Steel
- Water Recycle And Reuse
By Application
- Aerospace & Defense
- Agriculture & Horticulture
- Automotive
- Automotive & Transportation
- Building & Construction
- Chemical
- Coatings & Adhesives
- Consumer Applications
- Consumer Goods
- Electronics & Electricals
- Equipment Manufacturing
- Grid Injection
- Industrial
- Marine
- Mobility
- Non-Automotive
- Packaging
- Power
- Shipbuilding
- Sporting Goods
- Textiles
Target Audience
- Electronics Manufacturers : Semiconductor and electronics producers operating in Asia Pacific need market data to benchmark sustainability performance, identify green manufacturing investments, and align with regional environmental regulations.
- Supply Chain & Procurement Teams : Global procurement professionals sourcing from Asia Pacific require insights into sustainable manufacturing capabilities, supplier compliance standards, and green technology adoption across the region's electronics sector.
- Investment & Private Equity Firms : Investors targeting Asia Pacific's sustainable manufacturing sector need market sizing, growth forecasts, and competitive landscape analysis to identify acquisition targets and fund allocation opportunities.
- Technology & Equipment Providers : Manufacturers of sustainable manufacturing equipment and green technologies need Asia Pacific market intelligence to develop region-specific solutions and identify high-growth customer segments.
- Government & Policy Makers : Regional government agencies and policy makers require market data to design effective sustainability incentives, environmental regulations, and industrial policies supporting Asia Pacific's green manufacturing transition.
Countries within Asia Pacific - compare and drill down
| Country | 2025 size (native) |
|---|---|
| China | USD 112246.1 Million |
| India | USD 17080.9 Million |
| Japan | USD 23477.3 Million |
| Rest Of Asia Pacific | USD 24946.9 Million |
Country market size visualization
Reasons to Buy this Report
- Regional Market Dominance Data : Gain comprehensive insights into Asia Pacific's $106.9 billion sustainable manufacturing market, including country-level breakdowns for China, Japan, India, and emerging economies to identify high-growth opportunities.
- Competitive Intelligence : Understand market positioning across Asia Pacific's leading semiconductor and electronics manufacturers, their sustainability strategies, and competitive advantages in the rapidly evolving green manufacturing landscape.
- Growth Forecasting & Planning : Access detailed 5-year projections (2024-2029) showing 10.7% CAGR growth to $177.8 billion, enabling strategic investment decisions and market entry planning for Asia Pacific expansion.
- Regulatory & Compliance Insights : Navigate country-specific environmental regulations, carbon mandates, and sustainability requirements across Asia Pacific nations to ensure compliance and identify regulatory-driven market opportunities.
- Supply Chain Optimization : Identify sustainable manufacturing capabilities and green technology providers across Asia Pacific to optimize supply chains, reduce environmental impact, and meet corporate sustainability commitments.
Frequently asked questions
What is the current size of Asia Pacific's sustainable manufacturing market?
Asia Pacific's sustainable manufacturing market was valued at $106.9 billion USD in 2024, representing a significant portion of global sustainable manufacturing activity in the semiconductor and electronics sector.
What is the projected market size for Asia Pacific by 2029?
Asia Pacific's sustainable manufacturing market is forecast to reach $177.8 billion USD by 2029, representing a 10.7% compound annual growth rate from 2024 to 2029.
Which countries are driving Asia Pacific's sustainable manufacturing growth?
China, Taiwan, South Korea, and Japan are the primary drivers of Asia Pacific's sustainable manufacturing market, leveraging their established semiconductor and electronics manufacturing infrastructure to adopt green technologies.
What factors are accelerating sustainable manufacturing adoption in Asia Pacific?
Asia Pacific's sustainable manufacturing adoption is accelerated by government incentives, multinational corporation supply chain requirements, stringent environmental regulations, and increasing consumer demand for environmentally responsible electronics.
How does Asia Pacific's sustainable manufacturing growth compare to global trends?
Asia Pacific's 10.7% CAGR through 2029 demonstrates strong regional momentum, positioning the region as a global leader in sustainable electronics production and green manufacturing innovation.
RESEARCH METHODOLOGY
The study utilized four major activities to estimate the size of the sustainable manufacturing market. Exhaustive secondary research was conducted to gather information on the market and its peer and parent markets. The next step was to validate these findings, assumptions, and sizing with industry experts across the value chain through primary research. Both top-down and bottom-up approaches were employed to estimate the total market size. Finally, market breakdown and data triangulation methods were utilized to estimate the market size for different segments and subsegments.
Secondary Research
In the secondary research process, various sources were used to identify and collect information on the sustainable manufacturing market for this study. Secondary sources for this research study include corporate filings (such as annual reports, investor presentations, and financial statements), trade, business, and professional associations, white papers, certified publications, articles by recognized authors, directories, and databases. The secondary data was collected and analyzed to determine the overall market size, further validated through primary research.
List of key secondary sources
|
Sources |
WebLink |
|
Processing Magazines |
www.processingmagazine.com |
|
U.S. Environmental Protection Agency |
www.epa.gov |
|
The Organisation for Economic Co-operation and Development (OECD) |
https://www.oecd.org/about/ |
|
Chinese Association of Automation |
|
|
Association for the Advancement of Artificial Intelligence (AAAI) |
Primary Research
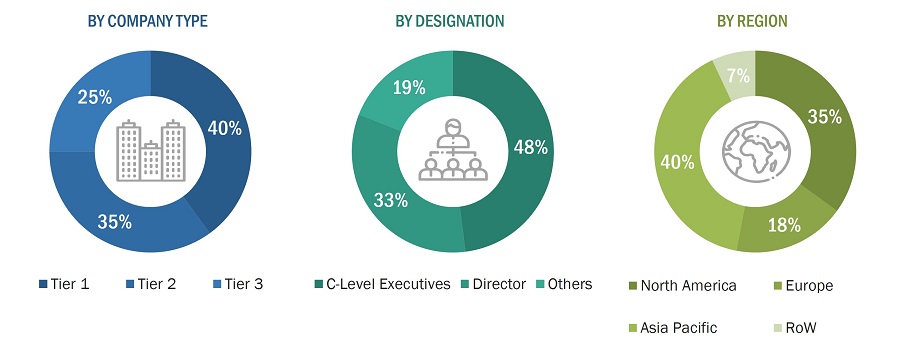
To gather insights on market statistics, revenue data, market breakdowns, size estimations, and forecasting, primary interviews were conducted. Additionally, primary research was used to comprehend the various technology, application, vertical, and regional trends. Interviews with stakeholders from the demand side, including CIOs, CTOs, CSOs, and customer/end-user installation teams using sustainable manufacturing offerings and processes, were also conducted to understand their perspective on suppliers, products, component providers, and their current and future use of sustainable manufacturing, which will impact the overall market. Several primary interviews were conducted across major countries of North America, Europe, Asia Pacific, the Middle East and Africa, and Latin America.
To know about the assumptions considered for the study, download the pdf brochure
Market Size Estimation
To estimate and validate the size of the sustainable manufacturing market and its submarkets, both top-down and bottom-up approaches were utilized. Secondary research was conducted to identify the key players in the market, and primary and secondary research was used to determine their market share in specific regions. The entire process involved studying top players’ annual and financial reports and conducting extensive interviews with industry leaders such as CEOs, VPs, directors, and marketing executives. Secondary sources were used to determine all percentage shares and breakdowns, which were then verified through primary sources. All parameters that could impact the markets covered in this research study were accounted for, analyzed in detail, verified through primary research, and consolidated to obtain the final quantitative and qualitative data.
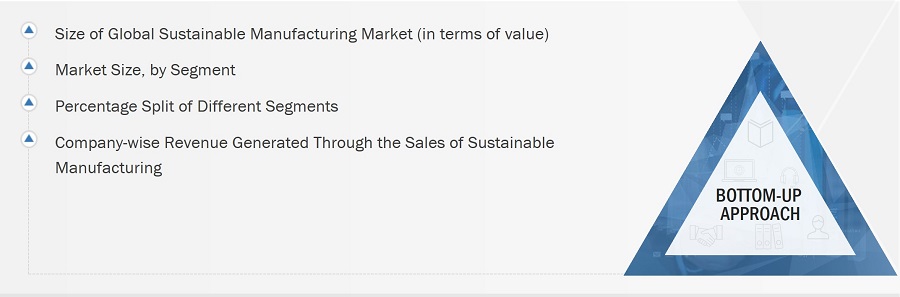
Global Sustainable Manufacturing Market Size: Botton Up Approach
- Identifying various sustainable offerings manufacturers
- Analyzing the penetration of each component through secondary and primary research
- Analyzing integration of Sustainable manufacturing in different applications through secondary and primary research
- Conducting multiple discussions with key opinion leaders to understand the detailed working of sustainable manufacturings and their implementation in multiple applications; this helped analyze the break-up of the scope of work carried out by each major company
- Verifying and cross-checking the estimates at every level with key opinion leaders, including CEOs, directors, operation managers, and finally with the domain experts at MarketsandMarkets
- Studying various paid and unpaid sources of information, such as annual reports, press releases, white papers, and databases
Global Sustainable Manufacturing Market Size: Top-Down Approach
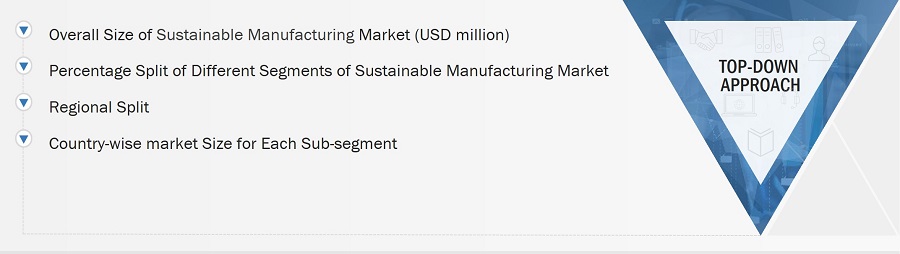
The top-down approach has been used to estimate and validate the total size of the sustainable manufacturing market.
- Focusing initially on the R&D investments and expenditures being made in the ecosystem of the sustainable manufacturing market, further splitting the market based on offerings and region, and listing the key developments
- Identifying leading players in the sustainable manufacturing market through secondary research and verifying them through brief discussions with industry experts
- Analyzing revenue, product mix, geographic presence, and key applications for which products are served by all identified players to estimate and arrive at percentage splits for all key segments
- Discussing splits with industry experts to validate the information and identify key growth pockets across all key segments
- Breaking down the total market based on verified splits and key growth pockets across all segments
Data Triangulation
Once the overall size of the Sustainable manufacturing market was determined using the methods described above, it was divided into multiple segments and subsegments. Market engineering was performed for each segment and subsegment using market breakdown and data triangulation methods, as applicable, to obtain accurate statistics. To triangulate the data, various factors and trends from the demand and supply sides were studied. The market was validated using both top-down and bottom-up approaches.
Market Definition
Sustainable manufacturing is a production approach that minimizes environmental impacts while conserving energy and natural resources. It focuses on efficient use of materials and energy, waste reduction, emissions control, and circular economy practices to extend product life cycles. Sustainable manufacturing also emphasizes social responsibility through fair labor practices and safe working conditions. This approach benefits businesses by reducing costs, improving compliance with regulations, enhancing brand reputation, and meeting consumer demand for eco-friendly products, while contributing to broader environmental goals such as carbon emissions reduction.
Key Stakeholders
- Sustainable metarials providers
- Sustainable metarials Suppliers
- Sustainable manufacturing Integrators
- Sustainable manufacturing distributors
- Sustainable manufacturing software solution providers
- Research organizations
- Analysts and strategic business planners
- Venture capitalists, private equity firms, and startups
- Educational Institutes and Universities
- Component Suppliers and Distributors
- Logistics and shipment companies
Report Objectives
- To define, describe, and forecast the sustainable manufacturing market based on offering & application and region
- To forecast the size of the market segments for four major regions—North America, Europe, Asia Pacific (APAC), and the Rest of the World (RoW)
- To provide detailed information regarding the major factors influencing the growth of the market (drivers, restraints, opportunities, and challenges)
- To strategically analyze micromarkets1 with respect to individual growth trends, prospects, and contributions to the total market
- To study the complete value chain and allied industry segments and perform a market value chain analysis.
- To provide ecosystem analysis, case study analysis, patent analysis, technology analysis, pricing analysis, Porter’s five forces analysis, key stakeholders and buying criteria, key conferences and events, and regulatory bodies, government agencies, and regulations pertaining to the market
- To strategically profile the key players and comprehensively analyze their market shares and core competencies2.
- To analyze the opportunities in the market for stakeholders and describe the competitive landscape of the market.
- To analyze competitive developments such as collaborations, agreements, contracts, partnerships, mergers & acquisitions, product launches, and research & development (R&D) in the market
- To analyze the impact of the recession on the sustainable manufacturing market
Available Customizations:
With the given market data, MarketsandMarkets offers customizations according to the specific requirements of companies. The following customization options are available for the report:
- Detailed analysis and profiling of additional market players (up to 5)
- Additional country-level analysis of the sustainable manufacturing market
Product Analysis
- Product matrix, which provides a detailed comparison of the product portfolio of each company in the sustainable manufacturing market.
Get the Full Sustainable Manufacturing Market Report
Full forecast, segment splits, and company analysis for all Sustainable Manufacturing Market.
- Canada Sustainable Manufacturing Market
- Mexico Sustainable Manufacturing Market
- US Sustainable Manufacturing Market
- France Sustainable Manufacturing Market
- Germany Sustainable Manufacturing Market
- UK Sustainable Manufacturing Market
- Rest Of Europe Sustainable Manufacturing Market
- China Sustainable Manufacturing Market
- India Sustainable Manufacturing Market
- Japan Sustainable Manufacturing Market
- Rest Of Asia Pacific Sustainable Manufacturing Market
Need a Tailored Report?
Customize this report to your needs
Get 10% FREE Customization
Customize This Report
